|
|
市場調査レポート
商品コード
1071217
スプリンクルの世界市場(2022年)Global Sprinkles Market Research Report 2022 |
||||||
|
|
|||||||
|
● お客様のご希望に応じて、既存データの加工や未掲載情報(例:国別セグメント)の追加などの対応が可能です。 詳細はお問い合わせください。 |
|||||||


| スプリンクルの世界市場(2022年) |
|
出版日: 2022年04月21日
発行: QYResearch
ページ情報: 英文 138 Pages
納期: 2~3営業日
|
- 全表示
- 概要
- 図表
- 目次
世界のスプリンクルの市場規模は、2021年に3億1,787万米ドルとなりました。
同市場は、2022年から2028年の間に5.6%のCAGRで成長し、2022年末の3億4,228万米ドルから、2028年には4億7,439万米ドルに達すると予測されています。
当レポートでは、世界のスプリンクル市場について調査し、市場規模や予測、形状・用途・企業・地域別の市場分析、市場力学、競合情勢、主要企業のプロファイルなどの情報を提供しています。
目次
第1章 スプリンクル市場概要
- スプリンクルの製品概要と範囲
- 形状別:スプリンクルセグメント
- 販売成長率の比較(2022-2028)
- スパンコール
- ニードル
- ビーズ
- その他
- 用途別:スプリンクルセグメント
- 販売比較(2022-2028)
- 商用用途
- 住宅用途
- 世界市場規模推計・予測
- 収益(2017-2028)
- 販売(2017-2028)
- 地域別:市場規模(2017vs2021vs2028)
第2章 メーカー別:スプリンクル市場の競争
- メーカー別:販売市場シェア(2017-2022)
- メーカー別:収益市場シェア(2017-2022)
- メーカー別:平均価格(2017-2022)
- 主要メーカーの本社と設立日
- 市場の競争状況と動向
第3章 地域別:スプリンクル市場のレトロスペクティブシナリオ
- 販売市場のレトロスペクティブシナリオ(2017-2022)
- 収益市場のレトロスペクティブシナリオ(2017-2022)
- 北米:国別市場のデータ
- 販売
- 収益
- 米国
- カナダ
- 欧州:国別市場のデータ
- 販売
- 収益
- ドイツ
- フランス
- 英国
- イタリア
- ロシア
- アジア太平洋:地域別市場のデータ
- 販売
- 収益
- 中国
- 日本
- 韓国
- インド
- 東南アジア
- ラテンアメリカ:国別市場のデータ
- 販売
- 収益
- メキシコ
- ブラジル
- 中東・アフリカ:国別市場のデータ
- 販売
- 収益
- 中東
- アフリカ
第4章 形状別:スプリンクルの市場実績分析
- 販売市場シェア(2017-2022)
- 収益市場シェア(2017-2022)
- 価格(2017-2022)
第5章 用途別:スプリンクルの市場実績分析
- 販売市場シェア(2017-2022)
- 収益市場シェア(2017-2022)
- 価格(2017-2022)
第6章 スプリンクル事業の企業プロファイルと主要データ
- DR. OETKER
- BARRY CALLEBAUT
- DORI ALIMENTOS
- WILTON
- MAVALERIO
- GIRRBACH
- CAKE DECOR
- PECAN DELUXE CANDY
- AMERICAN SPRINKLE
- SWEETS INDEED
- HAPPY SPRINKLES
- CARROLL INDUSTRIES
- JUBILEE CANDY CORP
- FANCY SPRINKLES
- CALAY CANDY
- XIAMEN YASIN INDUSTRY
第7章 スプリンクルの製造コスト分析
- 主要原材料
- 製造コスト構造比
- 産業チェーン分析
第8章 マーケティングチャネル、ディストリビューター、顧客
- マーケティングチャネル
- ディストリビューターリスト
- 顧客
第9章 市場力学
- 業界の動向
- 市場の促進要因
- 市場の課題
- 市場のリスク
第10章 世界の市場予測
- 形状別:市場推計・予測
- 用途別:市場推計・予測
- 地域別:市場推計・予測
第11章 調査結果と結論
第12章 調査手法と情報源
LIST OF TABLES
- Table 1. Global Sprinkles Sales Growth Rate Comparison by Form (2022-2028) & (Tons) & (US$ Million)
- Table 2. Global Sprinkles Sales Growth Rate Comparison by Application (2022-2028) & (Tons) & (US$ Million)
- Table 3. Global Sprinkles Market Size by Region (US$ Million): 2017 VS 2021 VS 2028
- Table 4. Global Sprinkles Market Competitive Situation by Manufacturers in 2021
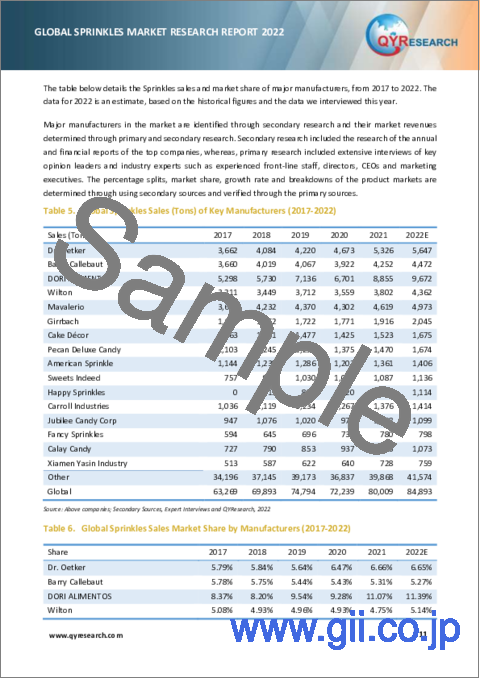
- Table 5. Global Sprinkles Sales (Tons) of Key Manufacturers (2017-2022)
- Table 6. Global Sprinkles Sales Market Share by Manufacturers (2017-2022)
- Table 7. Global Sprinkles Revenue (US$ Million) by Manufacturers (2017-2022)
- Table 8. Global Sprinkles Revenue Share by Manufacturers (2017-2022)
- Table 9. Global Market Sprinkles Average Price (US$/Ton) of Key Manufacturers (2017-2022)
- Table 10. Global Sprinkles Top Manufacturers Headquarters and Established Date
- Table 11. Global Manufacturers Market Concentration Ratio (CR5)
- Table 12. Global Sprinkles by Company Type (Tier 1, Tier 2, and Tier 3) & (based on the Revenue in Sprinkles as of 2021)
- Table 13. Global Sprinkles Sales by Region (2017-2022) & (Tons)
- Table 14. Global Sprinkles Sales Market Share by Region (2017-2022)
- Table 15. Global Sprinkles Revenue by Region (2017-2022) & (US$ Million)
- Table 16. Global Sprinkles Revenue Market Share by Region (2017-2022)
- Table 17. North America Sprinkles Sales by Country (2017-2022) & (Tons)
- Table 18. North America Sprinkles Sales Market Share by Country (2017-2022)
- Table 19. North America Sprinkles Revenue by Country (2017-2022) & (US$ Million)
- Table 20. North America Sprinkles Revenue Market Share by Country (2017-2022)
- Table 21. Europe Sprinkles Sales by Country (2017-2022) & (Tons)
- Table 22. Europe Sprinkles Sales Market Share by Country (2017-2022)
- Table 23. Europe Sprinkles Revenue by Country (2017-2022) & (US$ Million)
- Table 24. Europe Sprinkles Revenue Market Share by Country (2017-2022)
- Table 25. Asia Pacific Sprinkles Sales by Region (2017-2022) & (Tons)
- Table 26. Asia Pacific Sprinkles Sales Market Share by Region (2017-2022)
- Table 27. Asia Pacific Sprinkles Revenue by Region (2017-2022) & (US$ Million)
- Table 28. Asia Pacific Sprinkles Revenue Market Share by Region (2017-2022)
- Table 29. Latin America Sprinkles Sales by Country (2017-2022) & (Tons)
- Table 30. Latin America Sprinkles Sales Market Share by Country (2017-2022)
- Table 31. Latin America Sprinkles Revenue by Country (2017-2022) & (US$ Million)
- Table 32. Latin America Sprinkles Revenue Market Share by Country (2017-2022)
- Table 33. Middle East and Africa Sprinkles Sales by Country (2017-2022) & (Tons)
- Table 34. Middle East and Africa Sprinkles Sales Market Share by Country (2017-2022)
- Table 35. Middle East and Africa Sprinkles Revenue by Country (2017-2022) & (US$ Million)
- Table 36. Middle East and Africa Sprinkles Revenue Market Share by Country (2017-2022)
- Table 37. Global Sprinkles Sales by Form (2017-2022) & (Tons)
- Table 38. Global Sprinkles Sales Market Share by Form (2017-2022)
- Table 39. Global Sprinkles Revenue by Form (2017-2022) & (US$ Million)
- Table 40. Global Sprinkles Revenue Share by Form (2017-2022)
- Table 41. Global Sprinkles Price by Form (2017-2022) & (US$/Ton)
- Table 42. Global Sprinkles Sales (Tons) by Application (2017-2022)
- Table 43. Global Sprinkles Sales Market Share by Application (2017-2022)
- Table 44. Global Sprinkles Revenue by Application (2017-2022) & (US$ Million)
- Table 45. Global Sprinkles Revenue Share by Application (2017-2022)
- Table 46. Global Sprinkles Price by Application (2017-2022) & (US$/Ton)
- Table 47. Dr. Oetker Corporation Information
- Table 48. Dr. Oetker Introduction and Business Overview
- Table 49. Dr. Oetker Sprinkles Sales (Ton), Revenue (US$ Million), Price (USD/Ton) and Gross Margin (2017-2022)
- Table 50. Dr. Oetker Sprinkles Product
- Table 51. Barry Callebaut Corporation Information
- Table 52. Barry Callebaut Introduction and Business Overview
- Table 53. Barry Callebaut Sprinkles Sales (Ton), Revenue (US$ Million), Price (USD/Ton) and Gross Margin (2017-2022)
- Table 54. Barry Callebaut Sprinkles Product
- Table 55. DORI ALIMENTOS Corporation Information
- Table 56. DORI ALIMENTOS Introduction and Business Overview
- Table 57. DORI ALIMENTOS Sprinkles Sales (Ton), Revenue (US$ Million), Price (USD/Ton) and Gross Margin (2017-2022)
- Table 58. DORI ALIMENTOS Sprinkles Product
- Table 59. Wilton Corporation Information
- Table 60. Wilton Introduction and Business Overview
- Table 61. Wilton Sprinkles Sales (Ton), Revenue (US$ Million), Price (USD/Ton) and Gross Margin (2017-2022)
- Table 62. Wilton Sprinkles Product
- Table 63. Mavalerio Corporation Information
- Table 64. Mavalerio Introduction and Business Overview
- Table 65. Mavalerio Sprinkles Sales (Ton), Revenue (US$ Million), Price (USD/Ton) and Gross Margin (2017-2022)
- Table 66. Mavalerio Sprinkles Product
- Table 67. Girrbach Corporation Information
- Table 68. Girrbach Introduction and Business Overview
- Table 69. Girrbach Sprinkles Sales (Ton), Revenue (US$ Million), Price (USD/Ton) and Gross Margin (2017-2022)
- Table 70. Girrbach Sprinkles Product
- Table 71. Cake Decor Corporation Information
- Table 72. Cake Decor Introduction and Business Overview
- Table 73. Cake Decor Sprinkles Sales (Ton), Revenue (US$ Million), Price (USD/Ton) and Gross Margin (2017-2022)
- Table 74. Cake Decor Sprinkles Product
- Table 75. Pecan Deluxe Candy Corporation Information
- Table 76. Pecan Deluxe Candy Introduction and Business Overview
- Table 77. Pecan Deluxe Candy Sprinkles Sales (Ton), Revenue (US$ Million), Price (USD/Ton) and Gross Margin (2017-2022)
- Table 78. Pecan Deluxe Candy Sprinkles Product
- Table 79. American Sprinkle Corporation Information
- Table 80. American Sprinkle Introduction and Business Overview
- Table 81. American Sprinkle Sprinkles Sales (Ton), Revenue (US$ Million), Price (USD/Ton) and Gross Margin (2017-2022)
- Table 82. American Sprinkle Sprinkles Product
- Table 83. Sweets Indeed Corporation Information
- Table 84. Sweets Indeed Introduction and Business Overview
- Table 85. Sweets Indeed Sprinkles Sales (Ton), Revenue (US$ Million), Price (USD/Ton) and Gross Margin (2017-2022)
- Table 86. Sweets Indeed Sprinkles Product
- Table 87. Happy Sprinkles Corporation Information
- Table 88. Happy Sprinkles Introduction and Business Overview
- Table 89. Happy Sprinkles Sprinkles Sales (Ton), Revenue (US$ Million), Price (USD/Ton) and Gross Margin (2017-2022)
- Table 90. Happy Sprinkles Sprinkles Product
- Table 91. Carroll Industries Corporation Information
- Table 92. Carroll Industries Introduction and Business Overview
- Table 93. Carroll Industries Sprinkles Sales (Ton), Revenue (US$ Million), Price (USD/Ton) and Gross Margin (2017-2022)
- Table 94. Carroll Industries Sprinkles Product
- Table 95. Jubilee Candy Corp Corporation Information
- Table 96. Jubilee Candy Corp Introduction and Business Overview
- Table 97. Jubilee Candy Corp Sprinkles Sales (Ton), Revenue (US$ Million), Price (USD/Ton) and Gross Margin (2017-2022)
- Table 98. Jubilee Candy Corp Sprinkles Product
- Table 99. Fancy Sprinkles Corporation Information
- Table 100. Fancy Sprinkles Introduction and Business Overview
- Table 101. Fancy Sprinkles Sprinkles Sales (Ton), Revenue (US$ Million), Price (USD/Ton) and Gross Margin (2017-2022)
- Table 102. Fancy Sprinkles Sprinkles Product
- Table 103. Calay Candy Corporation Information
- Table 104. Calay Candy Introduction and Business Overview
- Table 105. Calay Candy Sprinkles Sales (Ton), Revenue (US$ Million), Price (USD/Ton) and Gross Margin (2017-2022)
- Table 106. Calay Candy Sprinkles Product
- Table 107. Xiamen Yasin Industry Corporation Information
- Table 108. Xiamen Yasin Industry Introduction and Business Overview
- Table 109. Xiamen Yasin Industry Sprinkles Sales (Ton), Revenue (US$ Million), Price (USD/Ton) and Gross Margin (2017-2022)
- Table 110. Xiamen Yasin Industry Sprinkles Product
- Table 111. Key Raw Materials Lists
- Table 112. Raw Materials Key Suppliers Lists
- Table 113. Sprinkles Distributors List
- Table 114. Sprinkles Customers List
- Table 115. Sprinkles Market Trends
- Table 116. Sprinkles Market Drivers
- Table 117. Sprinkles Market Challenges
- Table 118. Sprinkles Market Risks
- Table 119. Global Sprinkles Sales Forecast by Form (2023-2028) & (Tons)
- Table 120. Global Sprinkles Sales Market Share Forecast by Form (2023-2028)
- Table 121. Global Sprinkles Revenue Forecast by Form (2023-2028) & (US$ Million)
- Table 122. Global Sprinkles Revenue Market Share Forecast by Form (2023-2028)
- Table 123. Global Sprinkles Sales Forecast by Application (2023-2028) & (Tons)
- Table 124. Global Sprinkles Sales Market Share Forecast by Application (2023-2028)
- Table 125. Global Sprinkles Revenue Forecast by Application (2023-2028) & (US$ Million)
- Table 126. Global Sprinkles Revenue Market Share Forecast by Application (2023-2028)
- Table 127. Global Sprinkles Sales Forecast by Region (2023-2028) & (Tons)
- Table 128. Global Sprinkles Sales Market Share Forecast by Region (2023-2028)
- Table 129. Global Sprinkles Revenue Forecast by Region (2023-2028) & (US$ Million)
- Table 130. Global Sprinkles Revenue Market Share Forecast by Region (2023-2028)
- Table 131. Research Programs/Design for This Report
- Table 132. Key Data Information from Secondary Sources
- Table 133. Key Data Information from Primary Sources
List of Figures
- Figure 1. Product Picture of Sprinkles
- Figure 2. Global Sprinkles Market Share by Form: 2022 & 2028
- Figure 3. Product Picture of Sequins
- Figure 4. Product Picture of Needles
- Figure 5. Product Picture of Beads
- Figure 6. Global Sprinkles Market Share by Application: 2022 & 2028
- Figure 7. Product Picture of Commercial Application
- Figure 8. Product Picture of Residential Applications
- Figure 9. Global Sprinkles Revenue, (US$ Million), 2017 VS 2021 VS 2028
- Figure 10. Global Sprinkles Market Size (2017-2028) & (US$ Million)
- Figure 11. Global Sprinkles Sales (2017-2028) & (Tons)
- Figure 12. Sprinkles Sales Share by Manufacturers in 2021
- Figure 13. Global Sprinkles Revenue Share by Manufacturers in 2021
- Figure 14. Global 5 Largest Sprinkles Players: Market Share by Revenue in Sprinkles in 2021
- Figure 15. Global 10 Largest Sprinkles Players: Market Share by Revenue in Sprinkles in 2021
- Figure 16. Sprinkles Market Share by Company Type (Tier 1, Tier 2, and Tier 3): 2021
- Figure 17. North America Sprinkles Sales Market Share by Country in 2021
- Figure 18. United States Sprinkles Revenue Growth Rate (2017-2022) & (US$ Million)
- Figure 19. Canada Sprinkles Revenue Growth Rate (2017-2022) & (US$ Million)
- Figure 20. Europe Sprinkles Sales Market Share by Country in 2021
- Figure 21. Europe Sprinkles Revenue Market Share by Country in 2021
- Figure 22. Germany Sprinkles Revenue Growth Rate (2017-2022) & (US$ Million)
- Figure 23. France Sprinkles Revenue Growth Rate (2017-2022) & (US$ Million)
- Figure 24. U.K. Sprinkles Revenue Growth Rate (2017-2022) & (US$ Million)
- Figure 25. Italy Sprinkles Revenue Growth Rate (2017-2022) & (US$ Million)
- Figure 26. Russia Sprinkles Revenue Growth Rate (2017-2022) & (US$ Million)
- Figure 27. Asia Pacific Sprinkles Sales Market Share by Region in 2021
- Figure 28. Asia Pacific Sprinkles Revenue Market Share by Region in 2021
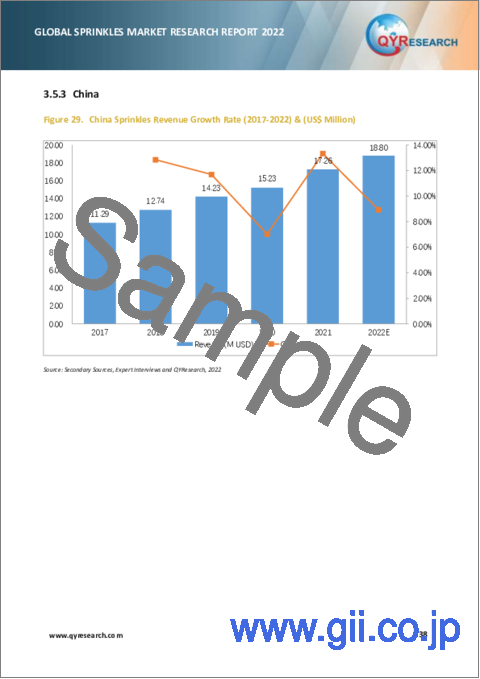
- Figure 29. China Sprinkles Revenue Growth Rate (2017-2022) & (US$ Million)
- Figure 30. Japan Sprinkles Revenue Growth Rate (2017-2022) & (US$ Million)
- Figure 31. South Korea Sprinkles Revenue Growth Rate (2017-2022) & (US$ Million)
- Figure 32. India Sprinkles Revenue Growth Rate (2017-2022) & (US$ Million)
- Figure 33. Southeast Asia Sprinkles Revenue Growth Rate (2017-2022) & (US$ Million)
- Figure 34. Latin America Sprinkles Sales Market Share by Country in 2021
- Figure 35. Latin America Sprinkles Revenue Market Share by Country in 2021
- Figure 36. Mexico Sprinkles Revenue Growth Rate (2017-2022) & (US$ Million)
- Figure 37. Brazil Sprinkles Revenue Growth Rate (2017-2022) & (US$ Million)
- Figure 38. Middle East and Africa Sprinkles Sales Market Share by Country in 2021
- Figure 39. Middle East and Africa Sprinkles Revenue Market Share by Country in 2021
- Figure 40. Middle East Sprinkles Revenue Growth Rate (2017-2022) & (US$ Million)
- Figure 41. Africa Sprinkles Revenue Growth Rate (2017-2022) & (US$ Million)
- Figure 42. Sales Market Share of Sprinkles by Form in 2021
- Figure 43. Manufacturing Cost Structure of Sprinkles
- Figure 44. Sprinkles Industrial Chain Analysis
- Figure 45. Channels of Distribution
- Figure 46. Distributors Profiles
- Figure 47. Bottom-up and Top-down Approaches for This Report
- Figure 48. Data Triangulation
- Figure 49. Key Executives Interviewed
Sprinkles, sugar strands, or hundreds and thousands, are very small pieces of confectionery used as a decoration or to add texture to desserts such as cupcakes, doughnuts or ice cream. According to the report, global revenue for Sprinkles market was valued at $ 317.87 million in 2021, and is expected to generate revenue of $ 342.28 million by end of 2022 and $ 474.39 million in 2028, growing at a CAGR of 5.6% between 2022 and 2028.
For the major players of Sprinkles, Dr. Oetker maintained its first place in the ranking in 2021, followed by Barry Callebaut, DORI ALIMENTOS, Wilton, Mavalerio. Top 5 players accounted for 35% of the Global Sprinkles revenue market share in 2021.
In this study, the sales market for Sprinkles was divided into five geographic regions. Europe occupied the largest market share with 42% in 2021 in terms of value. It is followed by North America and Asia-Pacific, while other regions have smaller market.
Global Sprinkles Market: Segment Analysis
The research report includes specific segments by region (country), by company, by Form and by Application. This study provides information about the sales and revenue during the historic and forecasted period of 2017 to 2028. Understanding the segments helps in identifying the importance of different factors that aid the market growth.
Global Sprinkles Market: Segment Analysis
The research report includes specific segments by region (country), by manufacturers, by Form and by Application. Each type provides information about the production during the forecast period of 2017 to 2028. by Application segment also provides consumption during the forecast period of 2017 to 2028. Understanding the segments helps in identifying the importance of different factors that aid the market growth.
By Company
- Dr. Oetker
- Barry Callebaut
- DORI ALIMENTOS
- Wilton
- Mavalerio
- Girrbach
- Cake Decor
- Pecan Deluxe Candy
- American Sprinkle
- Sweets Indeed
- Happy Sprinkles
- Carroll Industries
- Jubilee Candy Corp
- Fancy Sprinkles
- Calay Candy
- Xiamen Yasin Industry
Segment by Form
- Sequins
- Needles
- Beads
- Others
Segment by Application
- Commercial Application
- Residential Application
Consumption by Region
- North America
- U.S.
- Canada
- Asia-Pacific
- China
- Japan
- South Korea
- Southeast Asia
- India
- Europe
- Germany
- France
- U.K.
- Italy
- Russia
- Rest of Europe
- Latin America
- Mexico
- Brazil
- Rest of Latin America
TABLE OF CONTENTS
1 SPRINKLES MARKET OVERVIEW
- 1.1 PRODUCT OVERVIEW AND SCOPE OF SPRINKLES
- 1.2 SPRINKLES SEGMENT BY FORM
- 1.2.1 GLOBAL SPRINKLES SALES GROWTH RATE COMPARISON BY FORM (2022-2028)
- 1.2.2 SEQUINS
- 1.2.3 NEEDLES
- 1.2.4 BEADS
- 1.2.5 OTHERS
- 1.3 SPRINKLES SEGMENT BY APPLICATION
- 1.3.1 GLOBAL SPRINKLES SALES COMPARISON BY APPLICATION (2022-2028)
- 1.3.2 COMMERCIAL APPLICATION
- 1.3.3 RESIDENTIAL APPLICATIONS
- 1.4 GLOBAL SPRINKLES MARKET SIZE ESTIMATES AND FORECASTS
- 1.4.1 GLOBAL SPRINKLES REVENUE 2017-2028
- 1.4.2 GLOBAL SPRINKLES SALES 2017-2028
- 1.4.3 SPRINKLES MARKET SIZE BY REGION: 2017 VERSUS 2021 VERSUS 2028
2 SPRINKLES MARKET COMPETITION BY MANUFACTURERS
- 2.1 GLOBAL SPRINKLES SALES MARKET SHARE BY MANUFACTURERS (2017-2022)
- 2.2 GLOBAL SPRINKLES REVENUE MARKET SHARE BY MANUFACTURERS (2017-2022)
- 2.3 GLOBAL SPRINKLES AVERAGE PRICE BY MANUFACTURERS (2017-2022)
- 2.4 GLOBAL TOP SPRINKLES MANUFACTURERS HEADQUARTERS AND ESTABLISHED DATE
- 2.5 SPRINKLES MARKET COMPETITIVE SITUATION AND TRENDS
- 2.5.1 SPRINKLES MARKET CONCENTRATION RATE
- 2.5.2 THE GLOBAL 5 AND 10 LARGEST SPRINKLES PLAYERS MARKET SHARE BY REVENUE
- 2.5.3 GLOBAL SPRINKLES MARKET SHARE BY COMPANY TYPE (TIER 1, TIER 2, AND TIER 3)
3 SPRINKLES RETROSPECTIVE MARKET SCENARIO BY REGION
- 3.1 GLOBAL SPRINKLES RETROSPECTIVE MARKET SCENARIO IN SALES BY REGION: 2017-2022
- 3.2 GLOBAL SPRINKLES RETROSPECTIVE MARKET SCENARIO IN REVENUE BY REGION: 2017-2022
- 3.3 NORTH AMERICA SPRINKLES MARKET FACTS & FIGURES BY COUNTRY
- 3.3.1 NORTH AMERICA SPRINKLES SALES BY COUNTRY
- 3.3.2 NORTH AMERICA SPRINKLES REVENUE BY COUNTRY
- 3.3.3 UNITED STATES
- 3.3.4 CANADA
- 3.4 EUROPE SPRINKLES MARKET FACTS & FIGURES BY COUNTRY
- 3.4.1 EUROPE SPRINKLES SALES BY COUNTRY
- 3.4.2 EUROPE SPRINKLES REVENUE BY COUNTRY
- 3.4.3 GERMANY
- 3.4.4 FRANCE
- 3.4.5 U.K.
- 3.4.6 ITALY
- 3.4.7 RUSSIA
- 3.5 ASIA PACIFIC SPRINKLES MARKET FACTS & FIGURES BY REGION
- 3.5.1 ASIA PACIFIC SPRINKLES SALES BY REGION
- 3.5.2 ASIA PACIFIC SPRINKLES REVENUE BY REGION
- 3.5.3 CHINA
- 3.5.4 JAPAN
- 3.5.5 SOUTH KOREA
- 3.5.6 INDIA
- 3.5.7 SOUTHEAST ASIA
- 3.6 LATIN AMERICA SPRINKLES MARKET FACTS & FIGURES BY COUNTRY
- 3.6.1 LATIN AMERICA SPRINKLES SALES BY COUNTRY
- 3.6.2 LATIN AMERICA SPRINKLES REVENUE BY COUNTRY
- 3.6.3 MEXICO
- 3.6.4 BRAZIL
- 3.7 MIDDLE EAST AND AFRICA SPRINKLES MARKET FACTS & FIGURES BY COUNTRY
- 3.7.1 MIDDLE EAST AND AFRICA SPRINKLES SALES BY COUNTRY
- 3.7.2 MIDDLE EAST AND AFRICA SPRINKLES REVENUE BY COUNTRY
- 3.7.3 MIDDLE EAST
- 3.7.4 AFRICA
4 SPRINKLES HISTORIC MARKET ANALYSIS BY FORM
- 4.1 GLOBAL SPRINKLES SALES MARKET SHARE BY FORM (2017-2022)
- 4.2 GLOBAL SPRINKLES REVENUE MARKET SHARE BY FORM (2017-2022)
- 4.3 GLOBAL SPRINKLES PRICE BY FORM (2017-2022)
5 SPRINKLES HISTORIC MARKET ANALYSIS BY APPLICATION
- 5.1 GLOBAL SPRINKLES SALES MARKET SHARE BY APPLICATION (2017-2022)
- 5.2 GLOBAL SPRINKLES REVENUE MARKET SHARE BY APPLICATION (2017-2022)
- 5.3 GLOBAL SPRINKLES PRICE BY APPLICATION (2017-2022)
6 COMPANY PROFILES AND KEY FIGURES IN SPRINKLES BUSINESS
- 6.1 DR. OETKER
- 6.1.1 DR. OETKER CORPORATION INFORMATION
- 6.1.2 DR. OETKER INTRODUCTION AND BUSINESS OVERVIEW
- 6.1.3 DR. OETKER SPRINKLES SALES, REVENUE AND GROSS MARGIN (2017-2022)
- 6.1.4 DR. OETKER SPRINKLES PRODUCTS OFFERED
- 6.2 BARRY CALLEBAUT
- 6.2.1 BARRY CALLEBAUT CORPORATION INFORMATION
- 6.2.2 BARRY CALLEBAUT INTRODUCTION AND BUSINESS OVERVIEW
- 6.2.3 BARRY CALLEBAUT SPRINKLES SALES, REVENUE AND GROSS MARGIN (2017-2022)
- 6.2.4 BARRY CALLEBAUT SPRINKLES PRODUCTS OFFERED
- 6.3 DORI ALIMENTOS
- 6.3.1 DORI ALIMENTOS CORPORATION INFORMATION
- 6.3.2 DORI ALIMENTOS INTRODUCTION AND BUSINESS OVERVIEW
- 6.3.3 DORI ALIMENTOS SPRINKLES SALES, REVENUE AND GROSS MARGIN (2017-2022)
- 6.3.4 DORI ALIMENTOS SPRINKLES PRODUCTS OFFERED
- 6.4 WILTON
- 6.4.1 WILTON CORPORATION INFORMATION
- 6.4.2 WILTON INTRODUCTION AND BUSINESS OVERVIEW
- 6.4.3 WILTON SPRINKLES SALES, REVENUE AND GROSS MARGIN (2017-2022)
- 6.4.4 WILTON SPRINKLES PRODUCTS OFFERED
- 6.5 MAVALERIO
- 6.5.1 MAVALERIO CORPORATION INFORMATION
- 6.5.2 MAVALERIO INTRODUCTION AND BUSINESS OVERVIEW
- 6.5.3 MAVALERIO SPRINKLES SALES, REVENUE AND GROSS MARGIN (2017-2022)
- 6.5.4 MAVALERIO SPRINKLES PRODUCTS OFFERED
- 6.6 GIRRBACH
- 6.6.1 GIRRBACH CORPORATION INFORMATION
- 6.6.2 GIRRBACH INTRODUCTION AND BUSINESS OVERVIEW
- 6.6.3 GIRRBACH SPRINKLES SALES, REVENUE AND GROSS MARGIN (2017-2022)
- 6.6.4 GIRRBACH SPRINKLES PRODUCTS OFFERED
- 6.7 CAKE DECOR
- 6.7.1 CAKE DECOR CORPORATION INFORMATION
- 6.7.2 CAKE DECOR INTRODUCTION AND BUSINESS OVERVIEW
- 6.7.3 CAKE DECOR SPRINKLES SALES, REVENUE AND GROSS MARGIN (2017-2022)
- 6.7.4 CAKE DECOR SPRINKLES PRODUCTS OFFERED
- 6.8 PECAN DELUXE CANDY
- 6.8.1 PECAN DELUXE CANDY CORPORATION INFORMATION
- 6.8.2 PECAN DELUXE CANDY INTRODUCTION AND BUSINESS OVERVIEW
- 6.8.3 PECAN DELUXE CANDY SPRINKLES SALES, REVENUE AND GROSS MARGIN (2017-2022)
- 6.8.4 PECAN DELUXE CANDY SPRINKLES PRODUCTS OFFERED
- 6.9 AMERICAN SPRINKLE
- 6.9.1 AMERICAN SPRINKLE CORPORATION INFORMATION
- 6.9.2 AMERICAN SPRINKLE INTRODUCTION AND BUSINESS OVERVIEW
- 6.9.3 AMERICAN SPRINKLE SPRINKLES SALES, REVENUE AND GROSS MARGIN (2017-2022)
- 6.9.4 AMERICAN SPRINKLE SPRINKLES PRODUCTS OFFERED
- 6.10 SWEETS INDEED
- 6.10.1 SWEETS INDEED CORPORATION INFORMATION
- 6.10.2 SWEETS INDEED INTRODUCTION AND BUSINESS OVERVIEW
- 6.10.3 SWEETS INDEED SPRINKLES SALES, REVENUE AND GROSS MARGIN (2017-2022)
- 6.10.4 SWEETS INDEED SPRINKLES PRODUCTS OFFERED
- 6.11 HAPPY SPRINKLES
- 6.11.1 HAPPY SPRINKLES CORPORATION INFORMATION
- 6.11.2 HAPPY SPRINKLES INTRODUCTION AND BUSINESS OVERVIEW
- 6.11.3 HAPPY SPRINKLES SPRINKLES SALES, REVENUE AND GROSS MARGIN (2017-2022)
- 6.11.4 HAPPY SPRINKLES SPRINKLES PRODUCTS OFFERED
- 6.12 CARROLL INDUSTRIES
- 6.12.1 CARROLL INDUSTRIES CORPORATION INFORMATION
- 6.12.2 CARROLL INDUSTRIES INTRODUCTION AND BUSINESS OVERVIEW
- 6.12.3 CARROLL INDUSTRIES SPRINKLES SALES, REVENUE AND GROSS MARGIN (2017-2022)
- 6.12.4 CARROLL INDUSTRIES SPRINKLES PRODUCTS OFFERED
- 6.13 JUBILEE CANDY CORP
- 6.13.1 JUBILEE CANDY CORP CORPORATION INFORMATION
- 6.13.2 JUBILEE CANDY CORP INTRODUCTION AND BUSINESS OVERVIEW
- 6.13.3 JUBILEE CANDY CORP SPRINKLES SALES, REVENUE AND GROSS MARGIN (2017-2022)
- 6.13.4 JUBILEE CANDY CORP SPRINKLES PRODUCTS OFFERED
- 6.14 FANCY SPRINKLES
- 6.14.1 FANCY SPRINKLES CORPORATION INFORMATION
- 6.14.2 FANCY SPRINKLES INTRODUCTION AND BUSINESS OVERVIEW
- 6.14.3 FANCY SPRINKLES SPRINKLES SALES, REVENUE AND GROSS MARGIN (2017-2022)
- 6.14.4 FANCY SPRINKLES SPRINKLES PRODUCTS OFFERED
- 6.15 CALAY CANDY
- 6.15.1 CALAY CANDY CORPORATION INFORMATION
- 6.15.2 CALAY CANDY INTRODUCTION AND BUSINESS OVERVIEW
- 6.15.3 CALAY CANDY SPRINKLES SALES, REVENUE AND GROSS MARGIN (2017-2022)
- 6.15.4 CALAY CANDY SPRINKLES PRODUCTS OFFERED
- 6.16 XIAMEN YASIN INDUSTRY
- 6.16.1 XIAMEN YASIN INDUSTRY CORPORATION INFORMATION
- 6.16.2 XIAMEN YASIN INDUSTRY INTRODUCTION AND BUSINESS OVERVIEW
- 6.16.3 XIAMEN YASIN INDUSTRY SPRINKLES SALES, REVENUE AND GROSS MARGIN (2017-2022)
- 6.16.4 XIAMEN YASIN INDUSTRY SPRINKLES PRODUCTS OFFERED
7 SPRINKLES MANUFACTURING COST ANALYSIS
- 7.1 SPRINKLES KEY RAW MATERIALS
- 7.1.1 KEY RAW MATERIALS
- 7.1.2 RAW MATERIALS KEY SUPPLIERS
- 7.2 PROPORTION OF MANUFACTURING COST STRUCTURE
- 7.3 SPRINKLES INDUSTRIAL CHAIN ANALYSIS
8 MARKETING CHANNEL, DISTRIBUTORS AND CUSTOMERS
- 8.1 MARKETING CHANNEL
- 8.2 SPRINKLES DISTRIBUTORS LIST
- 8.3 SPRINKLES CUSTOMERS
9 SPRINKLES MARKET DYNAMICS
- 9.1 SPRINKLES INDUSTRY TRENDS
- 9.2 SPRINKLES MARKET DRIVERS
- 9.3 SPRINKLES MARKET CHALLENGES
- 9.4 SPRINKLES MARKET RISKS
10 GLOBAL MARKET FORECAST
- 10.1 SPRINKLES MARKET ESTIMATES AND PROJECTIONS BY FORM
- 10.1.1 GLOBAL FORECASTED SALES OF SPRINKLES BY FORM (2023-2028)
- 10.1.2 GLOBAL FORECASTED REVENUE OF SPRINKLES BY FORM (2023-2028)
- 10.2 SPRINKLES MARKET ESTIMATES AND PROJECTIONS BY APPLICATION
- 10.2.1 GLOBAL FORECASTED SALES OF SPRINKLES BY APPLICATION (2023-2028)
- 10.2.2 GLOBAL FORECASTED REVENUE OF SPRINKLES BY APPLICATION (2023-2028)
- 10.3 SPRINKLES MARKET ESTIMATES AND PROJECTIONS BY REGION
- 10.3.1 GLOBAL FORECASTED SALES OF SPRINKLES BY REGION (2023-2028)
- 10.3.2 GLOBAL FORECASTED REVENUE OF SPRINKLES BY REGION (2023-2028)
11 RESEARCH FINDINGS AND CONCLUSION
12 METHODOLOGY AND DATA SOURCE
- 12.1 METHODOLOGY/RESEARCH APPROACH
- 12.1.1 RESEARCH PROGRAMS/DESIGN
- 12.1.2 MARKET SIZE ESTIMATION
- 12.1.3 MARKET BREAKDOWN AND DATA TRIANGULATION
- 12.2 DATA SOURCE
- 12.2.1 SECONDARY SOURCES
- 12.2.2 PRIMARY SOURCES
- 12.3 AUTHOR LIST
- 12.4 DISCLAIMER 120