|
|
市場調査レポート
商品コード
1453077
電気自動車充電インフラ (EVCI)サービスの世界市場の分析Electric Vehicle Charging Infrastructure (EVCI) Services Global Market Analysis |
||||||
|
|||||||
| 電気自動車充電インフラ (EVCI)サービスの世界市場の分析 |
|
出版日: 2024年01月31日
発行: PTR Inc.
ページ情報: 英文 PDF/48 Slides, Excel/13 Sheets
納期: 2~3営業日
|
全表示
- 概要
- 目次
調査範囲
当レポートでは、世界の電気自動車充電インフラ (EVCI) サービス市場の情勢について分析し、特に、サービスレベル契約 (SLA) や、出発地・目的地・途上でのEV用AC・DC充電器向け遠隔整備・広告・更新・リサイクルサービスの動向、各地 (南北アメリカ、アジア太平洋、EMEA) の主要なサービスプロバイダーの情報、各地のEVCI設置・予防整備サービス市場の詳細動向、各地のサービス動向などを詳細に調査しております。
記載企業
|
|
エグゼクティブサマリー
2023年、世界のEV設置・試運転市場は、EMEA地域が43%の最大シェアを占め、アジア太平洋が42%、南北アメリカが14%と続いています。世界のEV充電器整備の市場でも、EMEA地域が再び最大の市場シェア (36%) を占め、今後も両市場で最大のシェアを維持すると予想されます。
現在、EMEAと南北アメリカ地域は予防整備に重点を置いているのに対し、アジア太平洋地域は定期整備にあまり関心がありません。しかし、今後数年の間に認知度が高まり、市場の成熟度が高まるにつれて、アジア太平洋地域でも予防整備の需要が高まると予想されます。
EV充電器の遠隔整備は、EVCI市場で拡大傾向にあります。従来の時間ベースの整備スケジュールとは異なり、予知保全はEV充電ステーションのオペレーターに問題が深刻化する前に検出し対処する力を与えるため、予知保全は今後数年間で広く採用される可能性が高いです。さらに今後数年間で、EV充電器の遠隔整備のための人工知能 (AI) の利用が増加し、EV充電器の稼働時間と信頼性を向上させることに重点が置かれるようになると予想されています。
EV充電ステーションで広告サービスを取り入れる動向も高まっています。EVCI広告業界に関わる多くの利害関係者が、EV充電器と広告を統合し、ブランドの認知度を高め、革新的なイメージを投影することを意図して、パートナーシップや提携を結んでいます。充電ポイントオペレーター (CPO) は、EV充電ステーションに広告を掲載することで、新たな収益を生み出し、運営コストを相殺し、消費者の充電料金を削減できる可能性があります。
EV充電器のリサイクルは、EVCI業界における新たな動向であり、徐々に受け入れられています。充電時間を短縮し、ユーザーの利便性を向上させたいという願望から、より高速な充電技術が重視されているため、EV充電器の更新もEVCI業界の今後の動向の一つです。DC充電器の更新率は、米国では5~10%であるのに対し、EMEAでは20%、アジア太平洋では30%となっています。
調査対象国
1. 南北アメリカ
2. アジア太平洋 (APAC)
|
3. 欧州
|
調査対象製品
EV充電器
|
|
購入の理由
- 1.南北アメリカ、アジア太平洋、EMEA地域 (特にオーストリア、カナダ、フランス、ドイツ、インド、イタリア、オランダ、北欧、スペイン、英国、米国) のEV用AC・DC充電器サービス市場の現在および潜在的な市場規模に関する洞察を得ることができます。
- 2.現在および将来の市場動向とEVCI設置・整備サービス市場に影響を与える成長要因の詳細な分析にアクセスできます。業界の動向について常に情報を入手し、それに応じて自社の戦略を適応させることができます。
- 3.レポートが提供する詳細な洞察を活用し、南北アメリカ、アジア太平洋、EMEA地域への市場参入と拡大について、十分な情報に基づいた意思決定を行うことができます。
- 4.各地域のEVCI設置・整備サービス市場の動向、今後の動向、ビジネスチャンスを理解することで、競合優位性を獲得します。
目次
第1章 定義
第2章 エグゼクティブサマリー
第3章 EV充電インフラ (EVCI) サービス市場の情勢
- EVCIサービスのバリューチェーン
- EVCIサービスの主要企業:南北アメリカ
- EVCIサービスの主要企業:アジア太平洋
- EVCIサービスの主要企業:欧州・中東・アフリカ
- サービスレベル契約 (SLA)
- EVCI業界におけるSLAの動向
- EVCI業界における延長保証契約の動向
- EV充電器の遠隔整備
- 効率的な充電器整備のためのOCPP (Open Charge Point Protocol)
- 充電ステーション管理システム (CSMS)
- 遠隔整備による故障診断
- EVCI業界に革命をもたらす遠隔整備
- EVCI業界で登場した予知保全
- 遠隔整備における人工知能の役割の増大
- EV充電器広告サービス
- プラグアンドプレイ:EVCI業界の広告に関わる利害関係者
- EV充電スタンドに広告サービスの波が押し寄せる
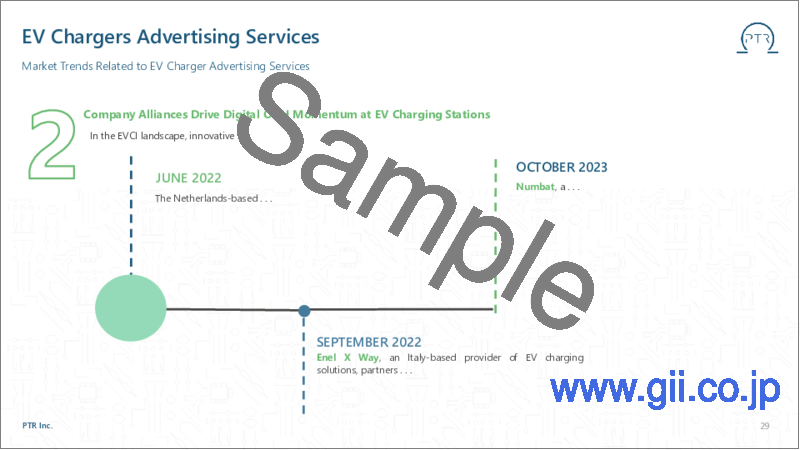
- 企業提携により、EV充電ステーションにおけるデジタルOOH (屋外広告) の勢いが促進
- CPOが、EV充電ステーションでのデジタルOOH広告の報酬のほとんどを享受
- EV充電器廃止サービス
- EV充電器の寿命
- EV充電器のリサイクル
- EV充電器の更新
- EV充電器周辺機器
- EV充電器周辺機器サービスの動向
第4章 EV充電インフラサービス市場:地域分析
- 南北アメリカ
- 南北アメリカのEVCIサービス市場:設置・試運転
- 南北アメリカのEVCIサービス市場:整備
- アジア太平洋
- アジア太平洋のEVCIサービス市場:設置・試運転
- アジア太平洋のEVCIサービス市場:整備
- 欧州・中東・アフリカ (EMEA)
- EMEAのEVCIサービス市場:設置・試運転
- EMEAのEVCIサービス市場:整備
第5章 PTRについて
Scope:
An in-depth overview of the EVCI services market landscape including service-level agreements (SLAs), trends in remote maintenance, advertising, upgrades, and recycling services of EV AC and DC chargers in depot, destination, and en-route applications, followed by key service providers in the Americas, APAC, and EMEA regions, along with a detailed regional analysis of EVCI installation and preventive and corrective maintenance services market depicting services trends in each region.
Companies Mentioned:
|
|
Executive Summary:
In 2023, the EMEA region dominated the global EV installation and commissioning market, holding the largest share at 43%, followed by APAC at 42% and Americas at 14%. In the global EV charger maintenance market, the EMEA region again held the largest market share i.e., 36% of the market, and is expected to retain the largest shares of both the markets moving forward too.
Currently, the EMEA and Americas regions depict a greater focus on preventive maintenance whereas the APAC region is less inclined towards conducting regular maintenance. However, with the growing awareness and increase in market maturity over the next few years, it is expected that the demand for preventive maintenance will increase in the APAC region as well.
Remote maintenance of EV chargers is a growing trend in the EVCI market. Predictive maintenance is likely to witness widespread adoption in the upcoming years as unlike traditional, time-based maintenance schedules, predictive maintenance empowers EV charging station operators to detect and address issues before they escalate. Moreover, an increase in the use of Artificial Intelligence (AI) for remote maintenance of EV chargers, and a heightened focus on improving the uptime and reliability of EV chargers is expected in the coming years.
There is a growing trend towards incorporating advertising services at EV charging stations. Many stakeholders involved in the EVCI advertising industry are forming partnerships and alliances intending to integrate ads with EV chargers, enhancing brand visibility and projecting an innovative image. Charge point operators (CPOs) emerge as the primary beneficiaries of advertising at EV charging stations, creating additional revenues, helping offset operational costs, and potentially reducing consumer charging fees.
The recycling of EV chargers represents a new and progressively embraced trend in the EVCI industry, showcasing an increasing awareness of environmental responsibility within the sector. Due to the emphasis on faster charging technologies, driven by the desire to reduce charging times and enhance user convenience, EV charger upgrades are another upcoming trend in the EVCI industry. DC chargers have a 5-10% upgradation rate in the U.S. whereas a 20% upgradation rate is seen in EMEA, and a 30% upgradation rate is seen in APAC.
Countries Covered:
1. Americas
2. Asia-Pacific (APAC)
|
3. Europe
|
Products Mentioned:
EV Chargers
|
|
Reasons to Purchase:
- 1. Gain insights into the current and potential market size of the EV AC and DC charger services market in the Americas, APAC, and EMEA regions, specifically focusing on Austria, Canada, France, Germany, India, Italy, Netherlands, Nordics, Spain, United Kingdom, and USA.
- 2. Access detailed analysis of current and future market trends and growth factors affecting the EVCI installation and maintenance services market over the years. Stay informed about industry developments and adapt your strategies accordingly.
- 3. Make informed decisions about market entry and expansion in the Americas, APAC, and EMEA regions by leveraging the in-depth insights provided by the report.
- 4. Gain a competitive edge by understanding the EVCI installation and maintenance services market landscape, upcoming trends, and opportunities in different regions.
Who Should Buy the Report:
- 1. Strategy Development
- 2. Director, Strategy Development
- 3. Commercial Analyst
- 4. Market Analyst
- 5. Marketing Analyst
- 6. Head of Sales
- 7. Manager Business Intelligence
- 8. Director of Sales
Research Methodology:
The information contained in the report has been gathered through authentic online sources used for secondary research and has been verified through interviews with industry professionals conducted as part of primary research.
Table of Contents
1. Definitions
2. Executive Summary
3. EV Charging Infrastructure Services Market Landscape
- i. EVCI Services Value Chain
- ii. EVCI Services Key Market Players: Americas
- iii. EVCI Services Key Market Players: APAC
- iv. EVCI Services Key Market Players: EMEA
- v. Service Level Agreements (SLAs)
- a. Service-Level Agreement (SLA) Trends in the EVCI Industry
- b. Extended Warranty Contract Trends in the EVCI Industry
- vi. EV Chargers Remote Maintenance
- a. Open Charge Point Protocol (OCPP) for Effective Charger Maintenance
- b. Charging Station Management System (CSMS)
- c. Fault Diagnosis Using Remote Maintenance
- d. Remote Maintenance Revolutionizing the EVCI Industry
- e. Predictive Maintenance Emerging in the EVCI Industry
- f. Growing Role of Artificial Intelligence in Remote Maintenance
- vii. EV Chargers Advertising Services
- a. Plug & Play: Stakeholders Involved in Advertising in EVCI Industry
- b. The Surging Wave of Advertising Services at EV Charging Stations
- c. Company Alliances Drive Digital OOH Momentum at EV Charging Stations
- d. CPOs Reap Most of the Rewards of Digital OOH Advertising at EV Charging Stations
- viii. EV Chargers Decommissioning Services
- a. Operational Life of EV Chargers
- b. Recycling of EV Chargers
- c. Upgradation of EV Chargers
- ix. EV Chargers Adjacent Equipment
- a. EV Chargers Adjacent Equipment Service Trends
4. EV Charging Infrastructure Services Market: Regional Analysis
- i. Americas
- a. Americas EVCI Services Market: Installation & Commissioning
- b. Americas EVCI Services Market: Maintenance
- ii. APAC
- a. APAC EVCI Services Market: Installation & Commissioning
- b. APAC EVCI Services Market: Maintenance
- iii. EMEA
- a. EMEA EVCI Services Market: Installation and Commissioning
- b. EMEA EVCI Services Market: Maintenance
5. About PTR
List of tables and figures
- EVCI Services Value Chain
- EVCI Services Key Market Players: Americas
- EVCI Services Key Market Players: APAC
- EVCI Services Key Market Players: EMEA
- Scope of Service Level Agreements
- Charging Station Management System (CSMS)
- Fault Diagnosis via RM
- Key Stakeholders Involved in Advertising in EVCI Industry
- Company Alliances Occurring in the EVCI Advertising Industry
- EV Charging Infrastructure Services Market: Regional Analysis
- Americas
- i. EVCI Installation and Commissioning Market by Service Provider Type (Million USD)
- ii. EVCI Maintenance Services Market by Maintenance Type (Million USD)
- iii. EVCI Maintenance Services Market by Maintenance Location (Million USD)
- iv. EVCI Maintenance Services Market by Maintenance Scope (Million USD)
- APAC
- i. EVCI Maintenance Services Market by Maintenance Type (Million USD)
- ii. EVCI Maintenance Services Market by Maintenance Location (Million USD)
- iii. EVCI Maintenance Services Market by Maintenance Scope (Million USD)
- EMEA
- i. EVCI Maintenance Services Market by Maintenance Type (Million USD)
- ii. EVCI Maintenance Services Market by Maintenance Location (Million USD)
- iii. EVCI Maintenance Services Market by Maintenance Scope (Million USD)
- Americas


