|
|
市場調査レポート
商品コード
1484688
事業継続管理の世界市場:市場規模・シェア分析 - 動向、促進要因、競合情勢、予測 (2024~2030年)Business Continuity Management Market Size & Share Analysis - Trends, Drivers, Competitive Landscape, and Forecasts (2024 - 2030) |
||||||
|
|||||||
| 事業継続管理の世界市場:市場規模・シェア分析 - 動向、促進要因、競合情勢、予測 (2024~2030年) |
|
出版日: 2024年05月01日
発行: Prescient & Strategic Intelligence
ページ情報: 英文 250 Pages
納期: 2~3営業日
|
全表示
- 概要
- 目次
主なハイライト
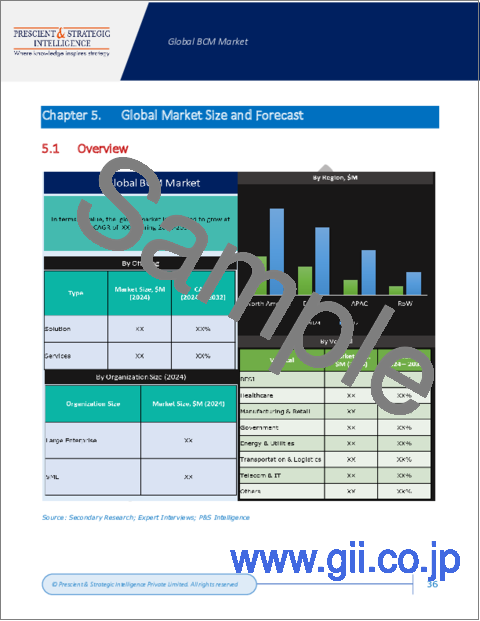
事業継続管理 (BCM) 市場の市場規模は、2023年に6億9,360万米ドルで、2030年には20億8,660万米ドルに拡大し、17.2%のCAGRで成長する見通しです。
複雑なビジネスプロセスを持つ企業は、モデル、行動、サイバーセキュリティ、ベンダーに関するリスクの高まりに加え、厳しい規制罰則、コンプライアンス義務、経済の不確実性により、運用リスクの高まりにさらされています。このような企業は、経営陣や事業部門に対して、強力なリスク軽減策、より優れたリスク説明責任、リアルタイムのリスク評価を求めています。
金融サービス企業が事業を拡大するにつれ、プロセスの透明性とアカウンタビリティの必要性、さらに積極的なリスク軽減を保証する必要性から、BCMソリューションの必要性が世界的に高まっています。
中小企業の事業継続管理 (BCM) ニーズの急増は、この業界で観察される重要な動向です。ここ数年、事業を拡大・改善するためにBCMソリューション&サービスを採用する中小企業が増加しています。一方で大手企業は、中小企業向けにより柔軟なサービスとソリューションの提供に注力しています。これは主に、新たな顧客基盤の規模が大きくなり、資産を保護することの重要性に対する意識が高まっているためです。
主な洞察
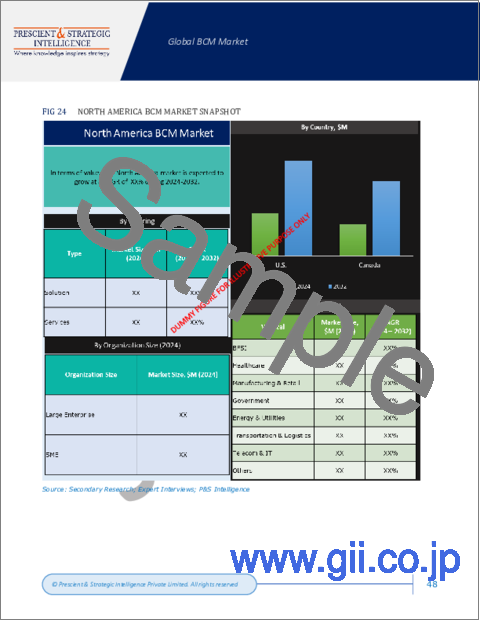
2023年、北米は約45%と最大のシェアを占めています。これは、多くの企業や主要な金融機関が存在し、また、自然災害による業務中断のリスクがあるためです。特に米国では、60%以上の企業が企業継続管理ソリューションに資金を投入しています。
アジア太平洋地域は今後数年間で、最も速い17.6%のCAGRで成長すると思われます。アジア太平洋の業界を牽引する主な要因としては、主要国の急速な景気拡大、クラウド技術の登場、大企業の存在、中国とインドにおけるIT資金の増加が挙げられます。
2023年にはソリューションカテゴリーが約70%のシェアで業界をリードし、この10年間もリードし続けると思われます。これは、危機管理・監査管理・リスク管理のためにBCMソリューションの利用が増加しているためです。
大企業のカテゴリーは、2023年には約65%のシェアで業界最大の貢献者であり、今後数年間もこの傾向が続くと思われます。これは、大企業が事業継続目標の実施と改善のために多額のIT資金を投入できるためです。
中小企業のカテゴリーは、今後数年間は17.4%と、より早い速度で成長すると思われます。競争激化により、中小企業は資産の保護と運用コストの削減に注力しています。
輸送・ロジスティクス部門は、今後数年間、17.8%と最も速いペースで成長します。これは、サプライチェーン・マネジメントにおける脅威が高まっているためです。
当レポートでは、世界の事業継続管理の市場について分析し、市場の基本構造・最新情勢や主な促進・抑制要因、世界全体および地域別・主要国の市場規模の動向見通し (金額ベース、2017~2030年)、提供品目別・組織規模別・業種別の詳細動向、現在の市場競争の状況、主要企業のプロファイルなどを調査しております。
目次
第1章 調査範囲
第2章 調査手法
第3章 エグゼクティブサマリー
第4章 市場指標
第5章 業界の展望
- 市場力学
- 動向
- 促進要因
- 抑制要因/課題
- 促進要因/抑制要因の影響分析
- 新型コロナウイルス感染症 (COVID-19) の影響
- ポーターのファイブフォース分析
第6章 世界市場
- 概要
- 市場収益:提供品目別 (2017~2030年)
- 市場収益:組織規模別 (2017~2030年)
- 市場収益:業種別 (2017~2030年)
- 市場収益:地域別 (2017~2030年)
第7章 北米市場
- 概要
- 市場収益:提供品目別 (2017~2030年)
- 市場収益:組織規模別 (2017~2030年)
- 市場収益:業種別 (2017~2030年)
- 市場収益:国別 (2017~2030年)
第8章 欧州市場
第9章 アジア太平洋市場
第10章 ラテンアメリカ市場
第11章 中東・アフリカ市場
第12章 米国市場
- 概要
- 市場収益:提供品目別 (2017~2030年)
- 市場収益:組織規模別 (2017~2030年)
- 市場収益:業種別 (2017~2030年)
第13章 カナダ市場
第14章 ドイツ市場
第15章 フランス市場
第16章 英国市場
第17章 イタリア市場
第18章 スペイン市場
第19章 日本市場
第20章 中国市場
第21章 インド市場
第22章 オーストラリア市場
第23章 韓国市場
第24章 ブラジル市場
第25章 メキシコ市場
第26章 サウジアラビア市場
第27章 南アフリカ市場
第28章 アラブ首長国連邦 (UAE) 市場
第29章 競合情勢
- 市場参入企業とその提供品目の一覧
- 主要企業の競合ベンチマーク
- 主要企業の製品ベンチマーク
- 最近の戦略的展開
第30章 企業プロファイル
- IBM Corporation
- Sai Global Pty Ltd.
- LogicManager Inc.
- Quantitative LLC
- MetricStream Inc.
- LockPath Inc.
- Dell Technologies Inc.
- Fusion Risk Management Inc.
- Sungard Availability Services
- CLDigital
- Veritas Technologies LLC
第31章 付録
Key Highlights
The business continuity management market was valued at USD 693.6 million in 2023, and it will increase to USD 2,086.6 million, propelling at a 17.2% CAGR, by 2030.
Establishments that have intricate business processes are subject to increasing operational risks because of stiff regulatory penalties, compliance mandates, and economic uncertainties, in addition to the rising risks with model, conduct, cybersecurity, and vendors.
Such companies are demanding strong risk mitigation, better risk accountability, and real-time risk assessment from management & business lines.
With financial service establishments progressively increasing their businesses, the need for process transparency and accountability, along with that for guaranteeing proactive risk mitigation, is driving the need for BCM solutions globally.
The surging need for business continuity management (BCM) from SMEs is a key trend being observed in this industry.
A rising count of SMEs, in the last few years, have employed BCM solutions & services to expand as well as improve their businesses.
The major companies in this industry are concentrating on offering more flexible services and solutions for SMEs.
This is mainly because of the new customer base's substantial size and increasing consciousness of the significance of safeguarding their assets.
The rising need has been precisely significant in companies that function in under-regulated sectors.
Key Insights
North America was the largest contributor to the industry in 2023, with approximately 45% share.
This is because of the existence of many businesses and key financial bodies and the risks of disruption to operations because of natural disasters.
Over 60% of businesses in the U.S. are funding in enterprise continuity management solutions.
This can be attributed to the existence of many commercial enterprises and IT firms, which boosts the overall security menace to this nation.
APAC will advance at the fastest compound annual growth rate, of 17.6%, in the years to come.
Major factors driving the industry in APAC include the quick economic expansion in the key nations, the advent of cloud technology, the existence of large enterprises, and the increasing IT funding in China and India.
The solutions category led the industry in 2023, with approximately 70% share, and it will remain leading throughout this decade.
This is because of the rising use of BCM solutions for crisis management, audit management, and risk management.
The large enterprise category was the largest contributor to the industry in 2023, with approximately 65% share, and it is likely to continue this trend in the coming years.
This is because of the ability of large enterprises to make large IT funding to implement and improve their business continuity goals.
The SMEs category will advance at a higher rate, of 17.4%, in the years to come.
With the rising competition in this industry, SMEs are concentrating on protecting their assets and decreasing operational expenses.
The transportation & logistics category will grow at the fastest rate, of 17.8%, in the coming years. This is because of the rising threats in supply chain management.
The industry is fragmented in nature. The players, particularly the new ones, are concentrating on providing advanced services and solutions, to satisfy the demanding consumer base.
Table of Contents
Chapter 1. Research Scope
- 1.1. Research Objectives
- 1.2. Market Definition
- 1.3. Analysis Period
- 1.4. Market Size Breakdown by Segments
- 1.4.1. Market size breakdown, by offering
- 1.4.2. Market size breakdown, by organization size
- 1.4.3. Market size breakdown, by industry
- 1.4.4. Market size breakdown, by region
- 1.4.5. Market size breakdown, by country
- 1.5. Market Data Reporting Unit
- 1.5.1. Value
- 1.6. Key Stakeholders
Chapter 2. Research Methodology
- 2.1. Secondary Research
- 2.1.1. Paid
- 2.1.2. Unpaid
- 2.1.3. P&S Intelligence database
- 2.2. Primary Research
- 2.3. Market Size Estimation
- 2.4. Data Triangulation
- 2.5. Currency Conversion Rates
- 2.6. Assumptions for the Study
- 2.7. Notes and Caveats
Chapter 3. Executive Summary
Chapter 4. Market Indicators
Chapter 5. Industry Outlook
- 5.1. Market Dynamics
- 5.1.1. Trends
- 5.1.2. Drivers
- 5.1.3. Restraints/challenges
- 5.1.4. Impact analysis of drivers/restraints
- 5.2. Impact of COVID-19
- 5.3. Porter's Five Forces Analysis
- 5.3.1. Bargaining power of buyers
- 5.3.2. Bargaining power of suppliers
- 5.3.3. Threat of new entrants
- 5.3.4. Intensity of rivalry
- 5.3.5. Threat of substitutes
Chapter 6. Global Market
- 6.1. Overview
- 6.2. Market Revenue, by Offering (2017-2030)
- 6.3. Market Revenue, by Organization Size (2017-2030)
- 6.4. Market Revenue, by Industry (2017-2030)
- 6.5. Market Revenue, by Region (2017-2030)
Chapter 7. North America Market
- 7.1. Overview
- 7.2. Market Revenue, by Offering (2017-2030)
- 7.3. Market Revenue, by Organization Size (2017-2030)
- 7.4. Market Revenue, by Industry (2017-2030)
- 7.5. Market Revenue, by Country (2017-2030)
Chapter 8. Europe Market
- 8.1. Overview
- 8.2. Market Revenue, by Offering (2017-2030)
- 8.3. Market Revenue, by Organization Size (2017-2030)
- 8.4. Market Revenue, by Industry (2017-2030)
- 8.5. Market Revenue, by Country (2017-2030)
Chapter 9. APAC Market
- 9.1. Overview
- 9.2. Market Revenue, by Offering (2017-2030)
- 9.3. Market Revenue, by Organization Size (2017-2030)
- 9.4. Market Revenue, by Industry (2017-2030)
- 9.5. Market Revenue, by Country (2017-2030)
Chapter 10. LATAM Market
- 10.1. Overview
- 10.2. Market Revenue, by Offering (2017-2030)
- 10.3. Market Revenue, by Organization Size (2017-2030)
- 10.4. Market Revenue, by Industry (2017-2030)
- 10.5. Market Revenue, by Country (2017-2030)
Chapter 11. MEA Market
- 11.1. Overview
- 11.2. Market Revenue, by Offering (2017-2030)
- 11.3. Market Revenue, by Organization Size (2017-2030)
- 11.4. Market Revenue, by Industry (2017-2030)
- 11.5. Market Revenue, by Country (2017-2030)
Chapter 12. U.S. Market
- 12.1. Overview
- 12.2. Market Revenue, by Offering (2017-2030)
- 12.3. Market Revenue, by Organization Size (2017-2030)
- 12.4. Market Revenue, by Industry (2017-2030)
Chapter 13. Canada Market
- 13.1. Overview
- 13.2. Market Revenue, by Offering (2017-2030)
- 13.3. Market Revenue, by Organization Size (2017-2030)
- 13.4. Market Revenue, by Industry (2017-2030)
Chapter 14. Germany Market
- 14.1. Overview
- 14.2. Market Revenue, by Offering (2017-2030)
- 14.3. Market Revenue, by Organization Size (2017-2030)
- 14.4. Market Revenue, by Industry (2017-2030)
Chapter 15. France Market
- 15.1. Overview
- 15.2. Market Revenue, by Offering (2017-2030)
- 15.3. Market Revenue, by Organization Size (2017-2030)
- 15.4. Market Revenue, by Industry (2017-2030)
Chapter 16. U.K. Market
- 16.1. Overview
- 16.2. Market Revenue, by Offering (2017-2030)
- 16.3. Market Revenue, by Organization Size (2017-2030)
- 16.4. Market Revenue, by Industry (2017-2030)
Chapter 17. Italy Market
- 17.1. Overview
- 17.2. Market Revenue, by Offering (2017-2030)
- 17.3. Market Revenue, by Organization Size (2017-2030)
- 17.4. Market Revenue, by Industry (2017-2030)
Chapter 18. Spain Market
- 18.1. Overview
- 18.2. Market Revenue, by Offering (2017-2030)
- 18.3. Market Revenue, by Organization Size (2017-2030)
- 18.4. Market Revenue, by Industry (2017-2030)
Chapter 19. Japan Market
- 19.1. Overview
- 19.2. Market Revenue, by Offering (2017-2030)
- 19.3. Market Revenue, by Organization Size (2017-2030)
- 19.4. Market Revenue, by Industry (2017-2030)
Chapter 20. China Market
- 20.1. Overview
- 20.2. Market Revenue, by Offering (2017-2030)
- 20.3. Market Revenue, by Organization Size (2017-2030)
- 20.4. Market Revenue, by Industry (2017-2030)
Chapter 21. India Market
- 21.1. Overview
- 21.2. Market Revenue, by Offering (2017-2030)
- 21.3. Market Revenue, by Organization Size (2017-2030)
- 21.4. Market Revenue, by Industry (2017-2030)
Chapter 22. Australia Market
- 22.1. Overview
- 22.2. Market Revenue, by Offering (2017-2030)
- 22.3. Market Revenue, by Organization Size (2017-2030)
- 22.4. Market Revenue, by Industry (2017-2030)
Chapter 23. South Korea Market
- 23.1. Overview
- 23.2. Market Revenue, by Offering (2017-2030)
- 23.3. Market Revenue, by Organization Size (2017-2030)
- 23.4. Market Revenue, by Industry (2017-2030)
Chapter 24. Brazil Market
- 24.1. Overview
- 24.2. Market Revenue, by Offering (2017-2030)
- 24.3. Market Revenue, by Organization Size (2017-2030)
- 24.4. Market Revenue, by Industry (2017-2030)
Chapter 25. Mexico Market
- 25.1. Overview
- 25.2. Market Revenue, by Offering (2017-2030)
- 25.3. Market Revenue, by Organization Size (2017-2030)
- 25.4. Market Revenue, by Industry (2017-2030)
Chapter 26. Saudi Arabia Market
- 26.1. Overview
- 26.2. Market Revenue, by Offering (2017-2030)
- 26.3. Market Revenue, by Organization Size (2017-2030)
- 26.4. Market Revenue, by Industry (2017-2030)
Chapter 27. South Africa Market
- 27.1. Overview
- 27.2. Market Revenue, by Offering (2017-2030)
- 27.3. Market Revenue, by Organization Size (2017-2030)
- 27.4. Market Revenue, by Industry (2017-2030)
Chapter 28. U.A.E. Market
- 28.1. Overview
- 28.2. Market Revenue, by Offering (2017-2030)
- 28.3. Market Revenue, by Organization Size (2017-2030)
- 28.4. Market Revenue, by Industry (2017-2030)
Chapter 29. Competitive Landscape
- 29.1. List of Market Players and their Offerings
- 29.2. Competitive Benchmarking of Key Players
- 29.3. Product Benchmarking of Key Players
- 29.4. Recent Strategic Developments
Chapter 30. Company Profiles
- 30.1. IBM Corporation
- 30.1.1. Business overview
- 30.1.2. Product and service offerings
- 30.1.3. Key financial summary
- 30.2. Sai Global Pty Ltd.
- 30.2.1. Business overview
- 30.2.2. Product and service offerings
- 30.2.3. Key financial summary
- 30.3. LogicManager Inc.
- 30.3.1. Business overview
- 30.3.2. Product and service offerings
- 30.3.3. Key financial summary
- 30.4. Quantitative LLC
- 30.4.1. Business overview
- 30.4.2. Product and service offerings
- 30.4.3. Key financial summary
- 30.5. MetricStream Inc.
- 30.5.1. Business overview
- 30.5.2. Product and service offerings
- 30.5.3. Key financial summary
- 30.6. LockPath Inc.
- 30.6.1. Business overview
- 30.6.2. Product and service offerings
- 30.6.3. Key financial summary
- 30.7. Dell Technologies Inc.
- 30.7.1. Business overview
- 30.7.2. Product and service offerings
- 30.7.3. Key financial summary
- 30.8. Fusion Risk Management Inc.
- 30.8.1. Business overview
- 30.8.2. Product and service offerings
- 30.8.3. Key financial summary
- 30.9. Sungard Availability Services
- 30.9.1. Business overview
- 30.9.2. Product and service offerings
- 30.9.3. Key financial summary
- 30.10. CLDigital
- 30.10.1. Business overview
- 30.10.2. Product and service offerings
- 30.10.3. Key financial summary
- 30.11. Veritas Technologies LLC
- 30.11.1. Business overview
- 30.11.2. Product and service offerings
- 30.11.3. Key financial summary
Chapter 31. Appendix
- 31.1. Abbreviations
- 31.2. Sources and References
- 31.3. Related Reports


