|
|
市場調査レポート
商品コード
1468715
自動車向けOTAアップデートの世界市場:市場規模・シェア分析 - 動向、促進要因、競合情勢、予測 (2024年~2030年)Automotive OTA Updates Market Size & Share Analysis - Trends, Drivers, Competitive Landscape, and Forecasts (2024 - 2030) |
||||||

|
|||||||
|
|||||||

| 自動車向けOTAアップデートの世界市場:市場規模・シェア分析 - 動向、促進要因、競合情勢、予測 (2024年~2030年) |
|
出版日: 2024年03月01日
発行: Prescient & Strategic Intelligence
ページ情報: 英文 310 Pages
納期: 2~3営業日
|

全表示
- 概要
- 目次
市場概要
世界の自動車向けOTAアップデートの市場規模は、2023年に39億1,720万米ドルに達し、2024年から2030年に20.1%のCAGRで推移し、2030年には138億6,350万米ドルに達すると予測されます。
優れた技術に依存するこの種の乗用車が増加していることが、OTAアップデートの需要増加につながるため、もう1つ注目すべき点です。その結果、OEMはワイヤレス経由での自動車ソフトウェアの提供を引き受けることとなり、そのため自動車ソフトウェアを最新にする技術に傾斜しています。
主な洞察
ソフトウェアカテゴリーは2023年に80%の大きな収益シェアを占め、今後も優位性を維持すると予想されます。車両ソフトウェアを更新するためのOTA (Over-the-Air) サービスは迅速かつ安全であり、ソフトウェアカテゴリーの高い売上に貢献しています。
推進方式別に見ると、電動カテゴリーが予測期間中に28%のCAGRで急成長が見込まれます。EV導入に対する奨励金や助成金などの政府支援や、厳しい排ガス規制がこの成長を後押ししています。
電気自動車の成長にもかかわらず、2023年の市場シェアは内燃機関車が大きく、今後もその地位を維持すると予想されます。
乗用車は2023年に約68%の大きな売上シェアを占め、今後もその地位を維持すると予想されます。自動運転のような機能を付加した中級・高級乗用車の販売増加がこの動向を牽引しています。
北米は2023年に約37%の最大収益シェアを占め、コネクテッドカーの採用増加によりその優位性を維持すると予想されます。
欧州市場では、高級車の需要が伸びており、製造するメーカーが増えているほか、研究開発や組立への投資も活発です。
当レポートでは、世界の自動車向けOTAアップデートの市場について分析し、市場の基本構造・最新情勢や主な促進・抑制要因、世界全体および地域別・主要国の市場規模の動向見通し (金額ベース、2017~2030年)、種類別・推進方式別・車種別・用途別の詳細動向、現在の市場競争の状況、主要企業のプロファイルなどを調査しております。
目次
第1章 調査範囲
第2章 調査手法
第3章 エグゼクティブサマリー
第4章 市場指標
第5章 業界の展望
- 市場力学
- 動向
- 促進要因
- 抑制要因/課題
- 促進要因/抑制要因の影響分析
- 新型コロナウイルス感染症 (COVID-19) の影響
- ポーターのファイブフォース分析
第6章 世界市場
- 概要
- 市場収益:種類別 (2017~2030年)
- 市場収益:推進方式別 (2017~2030年)
- 市場収益:車種別 (2017~2030年)
- 市場収益:用途別 (2017~2030年)
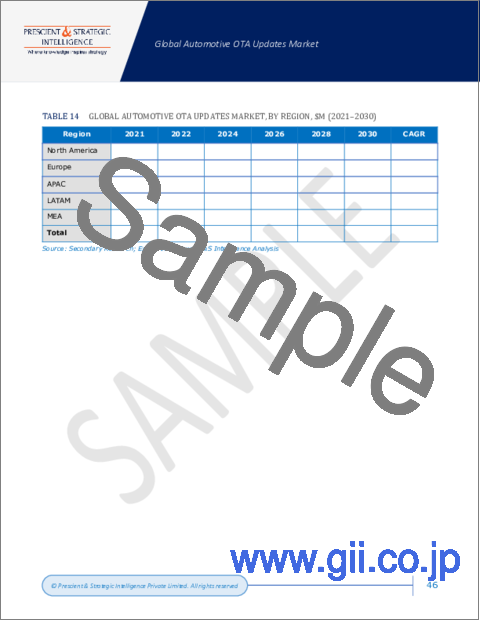
- 市場収益:地域別 (2017~2030年)
第7章 北米市場
- 概要
- 市場収益:種類別 (2017~2030年)
- 市場収益:推進方式別 (2017~2030年)
- 市場収益:車種別 (2017~2030年)
- 市場収益:用途別 (2017~2030年)
- 市場収益:国別 (2017~2030年)
第8章 欧州市場
第9章 アジア太平洋市場
第10章 ラテンアメリカ市場
第11章 中東・アフリカ市場
第12章 米国市場
- 概要
- 市場収益:種類別 (2017~2030年)
- 市場収益:推進方式別 (2017~2030年)
- 市場収益:車種別 (2017~2030年)
- 市場収益:用途別 (2017~2030年)
第13章 カナダ市場
第14章 ドイツ市場
第15章 フランス市場
第16章 英国市場
第17章 イタリア市場
第18章 スペイン市場
第19章 日本市場
第20章 中国市場
第21章 インド市場
第22章 オーストラリア市場
第23章 韓国市場
第24章 ブラジル市場
第25章 メキシコ市場
第26章 サウジアラビア市場
第27章 南アフリカ市場
第28章 アラブ首長国連邦 (UAE) 市場
第29章 競合情勢
- 市場参入企業とその提供品目の一覧
- 主要企業の競合ベンチマーク
- 主要企業の製品ベンチマーク
- 最近の戦略展開状況
第30章 企業プロファイル
- NXP Semiconductors N.V.
- AT&T Inc.
- DENSO Corporation
- Aptiv PLC
- Continental AG
- HARMAN International
- HERE Global B.V.
- Infineon Technologies AG
- Nvidia Corporation
- Qualcomm Incorporated
- Robert Bosch GmbH
- Lear Corporation
- Verizon Communications Inc.
- Garmin Ltd.
第31章 付録
Market Overview
The global automotive OTA updates market size was USD 3,917.2 million in 2023, and it is expected to reach USD 13,863.5 million by 2030, advancing at a CAGR of 20.1% during 2024-2030.
The rising number of this kind of passenger cars, which rely on superior technology is one more thing that should be looked into because it will lead to the increase in demand for OTA updates. Consequently, the OEMs are inclining towards technologies that take care of one's dose of car software via wireless, hence making the automotive software up-to-date.
The rise in the employment of IoT technology is developing interest amongst major carmakers to move their focus from regular vehicles to connected ones and either upgrade the old variants or inject the smart connectivity features into the current models.
In this regard, it is replacing older and outdated systems in vehicles with the latest infotainment systems, telematics, and navigation technology by customers. These systems are the software installed in the embedded auto hardware board updates which help to ensure smooth functioning. The result of this is the vast growth in the use of smart and connected technologies among vehicles and this is a major trend which is observed in the automotive over-the-air updates market today.
Key Insights
The software category held a significant revenue share of 80% in 2023 and is expected to maintain dominance.
Over-the-air (OTA) services for upgrading vehicle software are fast and secure, contributing to high sales in the software category.
The electric category in the propulsion segment is expected to grow rapidly with a CAGR of 28% during the forecast period.
Government support, including incentives and grants for EV adoption, and stringent emission regulations are driving this growth.
Despite the growth of electric vehicles, the ICE category held a larger market share in 2023 and is expected to maintain its position in the coming years.
Passenger vehicles held a larger revenue share of around 68% in 2023 and are expected to maintain this position.
Increasing sales of mid-range and premium passenger vehicles with added features like autonomy are driving this trend.
Autonomous cars are equipped with various systems such as eye tracking, virtual assistance, speech recognition, driver monitoring, gesture recognition, and natural language interfaces.
North America held the largest revenue share of around 37% in 2023 and is expected to maintain its dominance due to increased adoption of connected vehicles.
The region's demand for automobile networking, navigation, communication, and entertainment features has surged with growing mobile device compatibility.
OEMs and technology providers in North America are investing substantially in robust technologies to attract customers.
The US makes up a substantial percentage of North American revenues using strict regulations and is important for the growing trend for safer vehicles.
In addition to having high sales revenue in 2023, Europe is expected to continue to be the top manufacturer of the car industry in the world due to the presence of many players, high adoption rate, and introduction of advanced technologies.
The European market is experiencing a growth in vehicle demand for premium vehicles, developing the numbers of manufacturer companies, as well as the big investments in R&D and assembling
Germany is in charge of the European automobile market, owing to a sufficient infrastructure and the latest innovations in car technology.
Table of Contents
Chapter 1. Research Scope
- 1.1. Research Objectives
- 1.2. Market Definition
- 1.3. Analysis Period
- 1.4. Market Size Breakdown by Segments
- 1.4.1. Market size breakdown, by type
- 1.4.2. Market size breakdown, by propulsion
- 1.4.3. Market size breakdown, by vehicle type
- 1.4.4. Market size breakdown, by application
- 1.4.5. Market size breakdown, by region
- 1.4.6. Market size breakdown, by country
- 1.5. Market Data Reporting Unit
- 1.5.1. Value
- 1.6. Key Stakeholders
Chapter 2. Research Methodology
- 2.1. Secondary Research
- 2.1.1. Paid
- 2.1.2. Unpaid
- 2.1.3. P&S Intelligence database
- 2.2. Primary Research
- 2.3. Market Size Estimation
- 2.4. Data Triangulation
- 2.5. Currency Conversion Rates
- 2.6. Assumptions for the Study
- 2.7. Notes and Caveats
Chapter 3. Executive Summary
Chapter 4. Market Indicators
Chapter 5. Industry Outlook
- 5.1. Market Dynamics
- 5.1.1. Trends
- 5.1.2. Drivers
- 5.1.3. Restraints/challenges
- 5.1.4. Impact analysis of drivers/restraints
- 5.2. Impact of COVID-19
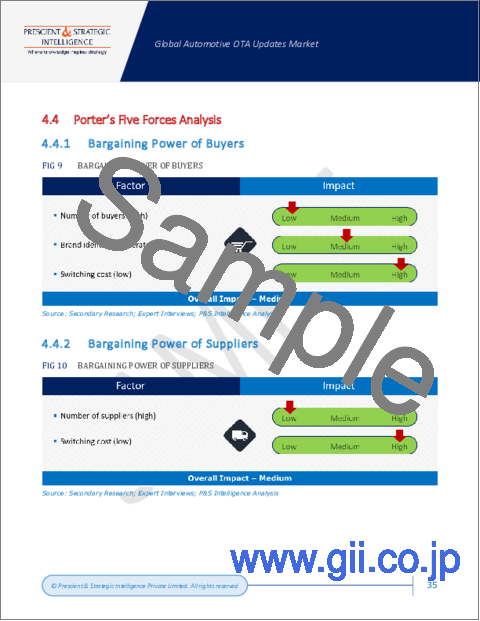
- 5.3. Porter's Five Forces Analysis
- 5.3.1. Bargaining power of buyers
- 5.3.2. Bargaining power of suppliers
- 5.3.3. Threat of new entrants
- 5.3.4. Intensity of rivalry
- 5.3.5. Threat of substitutes
Chapter 6. Global Market
- 6.1. Overview
- 6.2. Market Revenue, by Type (2017-2030)
- 6.3. Market Revenue, by Propulsion (2017-2030)
- 6.4. Market Revenue, by Vehicle Type (2017-2030)
- 6.5. Market Revenue, by Application (2017-2030)
- 6.6. Market Revenue, by Region (2017-2030)
Chapter 7. North America Market
- 7.1. Overview
- 7.2. Market Revenue, by Type (2017-2030)
- 7.3. Market Revenue, by Propulsion (2017-2030)
- 7.4. Market Revenue, by Vehicle Type (2017-2030)
- 7.5. Market Revenue, by Application (2017-2030)
- 7.6. Market Revenue, by Country (2017-2030)
Chapter 8. Europe Market
- 8.1. Overview
- 8.2. Market Revenue, by Type (2017-2030)
- 8.3. Market Revenue, by Propulsion (2017-2030)
- 8.4. Market Revenue, by Vehicle Type (2017-2030)
- 8.5. Market Revenue, by Application (2017-2030)
- 8.6. Market Revenue, by Country (2017-2030)
Chapter 9. APAC Market
- 9.1. Overview
- 9.2. Market Revenue, by Type (2017-2030)
- 9.3. Market Revenue, by Propulsion (2017-2030)
- 9.4. Market Revenue, by Vehicle Type (2017-2030)
- 9.5. Market Revenue, by Application (2017-2030)
- 9.6. Market Revenue, by Country (2017-2030)
Chapter 10. LATAM Market
- 10.1. Overview
- 10.2. Market Revenue, by Type (2017-2030)
- 10.3. Market Revenue, by Propulsion (2017-2030)
- 10.4. Market Revenue, by Vehicle Type (2017-2030)
- 10.5. Market Revenue, by Application (2017-2030)
- 10.6. Market Revenue, by Country (2017-2030)
Chapter 11. MEA Market
- 11.1. Overview
- 11.2. Market Revenue, by Type (2017-2030)
- 11.3. Market Revenue, by Propulsion (2017-2030)
- 11.4. Market Revenue, by Vehicle Type (2017-2030)
- 11.5. Market Revenue, by Application (2017-2030)
- 11.6. Market Revenue, by Country (2017-2030)
Chapter 12. U.S. Market
- 12.1. Overview
- 12.2. Market Revenue, by Type (2017-2030)
- 12.3. Market Revenue, by Propulsion (2017-2030)
- 12.4. Market Revenue, by Vehicle Type (2017-2030)
- 12.5. Market Revenue, by Application (2017-2030)
Chapter 13. Canada Market
- 13.1. Overview
- 13.2. Market Revenue, by Type (2017-2030)
- 13.3. Market Revenue, by Propulsion (2017-2030)
- 13.4. Market Revenue, by Vehicle Type (2017-2030)
- 13.5. Market Revenue, by Application (2017-2030)
Chapter 14. Germany Market
- 14.1. Overview
- 14.2. Market Revenue, by Type (2017-2030)
- 14.3. Market Revenue, by Propulsion (2017-2030)
- 14.4. Market Revenue, by Vehicle Type (2017-2030)
- 14.5. Market Revenue, by Application (2017-2030)
Chapter 15. France Market
- 15.1. Overview
- 15.2. Market Revenue, by Type (2017-2030)
- 15.3. Market Revenue, by Propulsion (2017-2030)
- 15.4. Market Revenue, by Vehicle Type (2017-2030)
- 15.5. Market Revenue, by Application (2017-2030)
Chapter 16. U.K. Market
- 16.1. Overview
- 16.2. Market Revenue, by Type (2017-2030)
- 16.3. Market Revenue, by Propulsion (2017-2030)
- 16.4. Market Revenue, by Vehicle Type (2017-2030)
- 16.5. Market Revenue, by Application (2017-2030)
Chapter 17. Italy Market
- 17.1. Overview
- 17.2. Market Revenue, by Type (2017-2030)
- 17.3. Market Revenue, by Propulsion (2017-2030)
- 17.4. Market Revenue, by Vehicle Type (2017-2030)
- 17.5. Market Revenue, by Application (2017-2030)
Chapter 18. Spain Market
- 18.1. Overview
- 18.2. Market Revenue, by Type (2017-2030)
- 18.3. Market Revenue, by Propulsion (2017-2030)
- 18.4. Market Revenue, by Vehicle Type (2017-2030)
- 18.5. Market Revenue, by Application (2017-2030)
Chapter 19. Japan Market
- 19.1. Overview
- 19.2. Market Revenue, by Type (2017-2030)
- 19.3. Market Revenue, by Propulsion (2017-2030)
- 19.4. Market Revenue, by Vehicle Type (2017-2030)
- 19.5. Market Revenue, by Application (2017-2030)
Chapter 20. China Market
- 20.1. Overview
- 20.2. Market Revenue, by Type (2017-2030)
- 20.3. Market Revenue, by Propulsion (2017-2030)
- 20.4. Market Revenue, by Vehicle Type (2017-2030)
- 20.5. Market Revenue, by Application (2017-2030)
Chapter 21. India Market
- 21.1. Overview
- 21.2. Market Revenue, by Type (2017-2030)
- 21.3. Market Revenue, by Propulsion (2017-2030)
- 21.4. Market Revenue, by Vehicle Type (2017-2030)
- 21.5. Market Revenue, by Application (2017-2030)
Chapter 22. Australia Market
- 22.1. Overview
- 22.2. Market Revenue, by Type (2017-2030)
- 22.3. Market Revenue, by Propulsion (2017-2030)
- 22.4. Market Revenue, by Vehicle Type (2017-2030)
- 22.5. Market Revenue, by Application (2017-2030)
Chapter 23. South Korea Market
- 23.1. Overview
- 23.2. Market Revenue, by Type (2017-2030)
- 23.3. Market Revenue, by Propulsion (2017-2030)
- 23.4. Market Revenue, by Vehicle Type (2017-2030)
- 23.5. Market Revenue, by Application (2017-2030)
Chapter 24. Brazil Market
- 24.1. Overview
- 24.2. Market Revenue, by Type (2017-2030)
- 24.3. Market Revenue, by Propulsion (2017-2030)
- 24.4. Market Revenue, by Vehicle Type (2017-2030)
- 24.5. Market Revenue, by Application (2017-2030)
Chapter 25. Mexico Market
- 25.1. Overview
- 25.2. Market Revenue, by Type (2017-2030)
- 25.3. Market Revenue, by Propulsion (2017-2030)
- 25.4. Market Revenue, by Vehicle Type (2017-2030)
- 25.5. Market Revenue, by Application (2017-2030)
Chapter 26. Saudi Arabia Market
- 26.1. Overview
- 26.2. Market Revenue, by Type (2017-2030)
- 26.3. Market Revenue, by Propulsion (2017-2030)
- 26.4. Market Revenue, by Vehicle Type (2017-2030)
- 26.5. Market Revenue, by Application (2017-2030)
Chapter 27. South Africa Market
- 27.1. Overview
- 27.2. Market Revenue, by Type (2017-2030)
- 27.3. Market Revenue, by Propulsion (2017-2030)
- 27.4. Market Revenue, by Vehicle Type (2017-2030)
- 27.5. Market Revenue, by Application (2017-2030)
Chapter 28. U.A.E. Market
- 28.1. Overview
- 28.2. Market Revenue, by Type (2017-2030)
- 28.3. Market Revenue, by Propulsion (2017-2030)
- 28.4. Market Revenue, by Vehicle Type (2017-2030)
- 28.5. Market Revenue, by Application (2017-2030)
Chapter 29. Competitive Landscape
- 29.1. List of Market Players and their Offerings
- 29.2. Competitive Benchmarking of Key Players
- 29.3. Product Benchmarking of Key Players
- 29.4. Recent Strategic Developments
Chapter 30. Company Profiles
- 30.1. NXP Semiconductors N.V.
- 30.1.1. Business overview
- 30.1.2. Product and service offerings
- 30.1.3. Key financial summary
- 30.2. AT&T Inc.
- 30.2.1. Business overview
- 30.2.2. Product and service offerings
- 30.2.3. Key financial summary
- 30.3. DENSO Corporation
- 30.3.1. Business overview
- 30.3.2. Product and service offerings
- 30.3.3. Key financial summary
- 30.4. Aptiv PLC
- 30.4.1. Business overview
- 30.4.2. Product and service offerings
- 30.4.3. Key financial summary
- 30.5. Continental AG
- 30.5.1. Business overview
- 30.5.2. Product and service offerings
- 30.5.3. Key financial summary
- 30.6. HARMAN International
- 30.6.1. Business overview
- 30.6.2. Product and service offerings
- 30.6.3. Key financial summary
- 30.7. HERE Global B.V.
- 30.7.1. Business overview
- 30.7.2. Product and service offerings
- 30.7.3. Key financial summary
- 30.8. Infineon Technologies AG
- 30.8.1. Business overview
- 30.8.2. Product and service offerings
- 30.8.3. Key financial summary
- 30.9. Nvidia Corporation
- 30.9.1. Business overview
- 30.9.2. Product and service offerings
- 30.9.3. Key financial summary
- 30.10. Qualcomm Incorporated
- 30.10.1. Business overview
- 30.10.2. Product and service offerings
- 30.10.3. Key financial summary
- 30.11. Robert Bosch GmbH
- 30.11.1. Business overview
- 30.11.2. Product and service offerings
- 30.11.3. Key financial summary
- 30.12. Lear Corporation
- 30.12.1. Business overview
- 30.12.2. Product and service offerings
- 30.12.3. Key financial summary
- 30.13. Verizon Communications Inc.
- 30.13.1. Business overview
- 30.13.2. Product and service offerings
- 30.13.3. Key financial summary
- 30.14. Garmin Ltd.
- 30.14.1. Business overview
- 30.14.2. Product and service offerings
- 30.14.3. Key financial summary
Chapter 31. Appendix
- 31.1. Abbreviations
- 31.2. Sources and References
- 31.3. Related Reports

