|
|
市場調査レポート
商品コード
1092758
MaaS(モビリティ・アズ・ア・サービス)市場:サービスタイプ別、車両タイプ別、通勤パターン別、最終用途別、決済タイプ別、推進タイプ別 - 2030年までの世界の業界最新動向と需要予測Mobility-as-a-Service Market Report: By Service Type, Vehicle Type, Commuting Pattern, End Use, Payment Type, Propulsion Type - Global Industry Latest Trends and Demand Forecast to 2030 |
||||||
|
|
|||||||


| MaaS(モビリティ・アズ・ア・サービス)市場:サービスタイプ別、車両タイプ別、通勤パターン別、最終用途別、決済タイプ別、推進タイプ別 - 2030年までの世界の業界最新動向と需要予測 |
|
出版日: 2022年05月01日
発行: Prescient & Strategic Intelligence
ページ情報: 英文 385 Pages
納期: 2~3営業日
|
- 全表示
- 概要
- 図表
- 目次
世界のMaaS(モビリティ・アズ・ア・サービス)の市場規模は、2021年に1,284億8,920万米ドルとなりました。同市場は今後、16.8%のCAGRで拡大し、2030年には5,196億9,750万米ドルに達すると予測されています。
当レポートでは、世界のMaaS(モビリティ・アズ・ア・サービス)市場について調査し、市場の概要とともに、サービスタイプ別、車両タイプ別、通勤パターン別、最終用途別、決済タイプ別、推進タイプ別、地域別の動向、および市場に参入する企業のプロファイルなどを提供しています。
目次
第1章 調査の背景
第2章 調査手法
第3章 エグゼクティブサマリー
第4章 市場セグメントの定義
- サービスタイプ別
- ライドヘイリング
- ライドシェアリング
- マイクロモビリティ
- レンタカー
- シャトルサービス
- 車両タイプ別
- 二輪車
- 自動車
- バス
- 通勤パターン別
- 毎日の通勤
- ラストマイル接続
- 時折通勤
- その他
- 最終用途別
- 個人
- 企業
- 決済タイプ別
- 短期サブスクリプション
- 現金払い
- 推進力タイプ別
- 電気
- ICE
- その他
第5章 業界の見通し
- 市場力学
- 動向
- 促進要因
- 市場予測に対する促進要因の影響分析
- 抑制要因
- 市場予測に対する抑制要因の影響分析
- ポーターのファイブフォース分析
第6章 MaaSテクノロジーの動向
第7章 世界の市場規模と予測
- 概要
- サービスタイプ別の市場収益
- 車両タイプ別の市場収益
- 通勤パターン別の市場収益
- 決済タイプ別の市場収益
- 推進タイプ別の市場収益
- 最終用途別の市場収益
- 地域別の市場収益
第8章 北米の市場規模と予測
第9章 欧州の市場規模と予測
第10章 アジア太平洋の市場規模と予測
第11章 ラテンアメリカの市場規模と予測
第12章 中東・アフリカの市場規模と予測
第13章 米国の市場規模と予測
第14章 カナダの市場規模と予測
第15章 ドイツの市場規模と予測
第16章 フランスの市場規模と予測
第17章 英国の市場規模と予測
第18章 イタリアの市場規模と予測
第19章 スペインの市場規模と予測
第20章 中国の市場規模と予測
第21章 日本の市場規模と予測
第22章 インドの市場規模と予測
第23章 オーストラリアの市場規模と予測
第24章 韓国の市場規模と予測
第25章 ブラジルの市場規模と予測
第26章 メキシコの市場規模と予測
第27章 南アフリカの市場規模と予測
第28章 サウジアラビアの市場規模と予測
第29章 UAEの市場規模と予測
第30章 競合情勢
第31章 企業プロファイル
- ANI Technologies Pvt. Ltd.
- Lyft Inc.
- Uber Technologies Inc.
- Beijing Xiaoju Technology Co. Ltd.(Didi Chuxing)
- Grab Holdings Inc.
- Hertz Global Holdings Inc.
- Avis Budget Group Inc.
- Enterprise Holdings Inc.
- Europcar Mobility Group S.A.
- Sixt SE
- CarShare Australia Pty. Ltd.
- Turo Inc.
- Gett Inc.
- FREE NOW
- Addison Lee Ltd.
- moovel Group GmbH
- Curb Mobility LLC
- Cabify Espana SL
- Bolt Technology OU
- Moovit App Global Ltd.
- MaaS Global Ltd.
第32章 付録
LIST OF FIGURES
- FIG 1 MARKET SIZE BREAKDOWN BY SEGMENT
- FIG 2 RESEARCH METHODOLOGY
- FIG 3 BREAKDOWN OF PRIMARY RESEARCH BY REGION
- FIG 4 BREAKDOWN OF PRIMARY RESEARCH BY INDUSTRY PARTICIPANT
- FIG 5 BREAKDOWN OF PRIMARY RESEARCH BY COMPANY TYPE
- FIG 6 DATA TRIANGULATION APPROACH
- FIG 7 CURRENCY CONVERSION RATES FOR USD (2021)
- FIG 8 GLOBAL MAAS MARKET SUMMARY
- FIG 9 NUMBER OF PEOPLE LIVING IN URBAN AREAS, IN BILLIONS (2015-2020)
- FIG 10 BARGAINING POWER OF BUYERS
- FIG 11 BARGAINING POWER OF SUPPLIERS
- FIG 12 INTENSITY OF RIVALRY
- FIG 13 THREAT OF NEW ENTRANTS
- FIG 14 THREAT OF SUBSTITUTES
- FIG 15 GLOBAL MAAS MARKET SNAPSHOT
- FIG 16 GLOBAL MAAS MARKET REVENUE, BY SERVICE TYPE, $M (2017-2030)
- FIG 17 GLOBAL MAAS MARKET REVENUE, BY VEHICLE TYPE, $M (2017-2030)
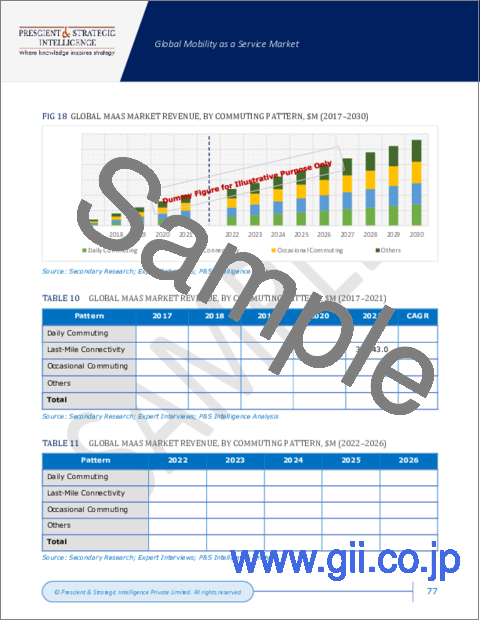
- FIG 18 GLOBAL MAAS MARKET REVENUE, BY COMMUTING PATTERN, $M (2017-2030)
- FIG 19 GLOBAL MAAS MARKET REVENUE, BY PAYMENT TYPE, $M (2017-2030)
- FIG 20 GLOBAL MAAS MARKET REVENUE, BY END USE, $M (2017-2030)
- FIG 21 MAJOR WORLDWIDE MARKETS FOR MAAS, $M
- FIG 22 GLOBAL MAAS MARKET REVENUE, BY REGION, $M (2017-2030)
- FIG 23 NORTH AMERICA MAAS MARKET SNAPSHOT
- FIG 24 NORTH AMERICA MAAS MARKET REVENUE, BY SERVICE TYPE, $M (2017-2030)
- FIG 25 NORTH AMERICA MAAS MARKET REVENUE, BY VEHICLE TYPE, $M (2017-2030)
- FIG 26 NORTH AMERICA MAAS MARKET REVENUE, BY COMMUTING PATTERN, $M (2017-2030)
- FIG 27 NORTH AMERICA MAAS MARKET REVENUE, BY PAYMENT TYPE, $M (2017-2030)
- FIG 28 NORTH AMERICA MAAS MARKET REVENUE, BY PROPULSION TYPE, $M (2017-2030)
- FIG 29 NORTH AMERICA MAAS MARKET REVENUE, BY END USE, $M (2017-2030)
- FIG 30 NORTH AMERICA MAAS MARKET REVENUE, BY COUNTRY, $M (2017-2030)
- FIG 31 EUROPE MAAS MARKET SNAPSHOT
- FIG 32 EUROPE MAAS MARKET REVENUE, BY SERVICE TYPE, $M (2017-2030)
- FIG 33 EUROPE MAAS MARKET REVENUE, BY VEHICLE TYPE, $M (2017-2030)
- FIG 34 EUROPE MAAS MARKET REVENUE, BY COMMUTING PATTERN, $M (2017-2030)
- FIG 35 EUROPE MAAS MARKET REVENUE, BY PAYMENT TYPE, $M (2017-2030)
- FIG 36 EUROPE MAAS MARKET REVENUE, BY PROPULSION TYPE, $M (2017-2030)
- FIG 37 EUROPE MAAS MARKET REVENUE, BY END USE, $M (2017-2030)
- FIG 38 EUROPE MAAS MARKET REVENUE, BY COUNTRY, $M (2017-2030)
- FIG 39 APAC MAAS MARKET SNAPSHOT
- FIG 40 APAC MAAS MARKET REVENUE, BY SERVICE TYPE, $M (2017-2030)
- FIG 41 APAC MAAS MARKET REVENUE, BY VEHICLE TYPE, $M (2017-2030)
- FIG 42 APAC MAAS MARKET REVENUE, BY COMMUTING PATTERN, $M (2017-2030)
- FIG 43 APAC MAAS MARKET REVENUE, BY PAYMENT TYPE, $M (2017-2030)
- FIG 44 APAC MAAS MARKET REVENUE, BY PROPULSION TYPE, $M (2017-2030)
- FIG 45 APAC MAAS MARKET REVENUE, BY END USE, $M (2017-2030)
- FIG 46 APAC MAAS MARKET REVENUE, BY COUNTRY, $M (2017-2030)
- FIG 47 LATAM MAAS MARKET SNAPSHOT
- FIG 48 LATAM MAAS MARKET REVENUE, BY SERVICE TYPE, $M (2017-2030)
- FIG 49 LATAM MAAS MARKET REVENUE, BY VEHICLE TYPE, $M (2017-2030)
- FIG 50 LATAM MAAS MARKET REVENUE, BY COMMUTING PATTERN, $M (2017-2030)
- FIG 51 LATAM MAAS MARKET REVENUE, BY PAYMENT TYPE, $M (2017-2030)
- FIG 52 LATAM MAAS MARKET REVENUE, BY PROPULSION TYPE, $M (2017-2030)
- FIG 53 LATAM MAAS MARKET REVENUE, BY END USE, $M (2017-2030)
- FIG 54 LATAM MAAS MARKET REVENUE, BY COUNTRY, $M (2017-2030)
- FIG 55 MEA MAAS MARKET SNAPSHOT
- FIG 56 MEA MAAS MARKET REVENUE, BY SERVICE TYPE, $M (2017-2030)
- FIG 57 MEA MAAS MARKET REVENUE, BY VEHICLE TYPE, $M (2017-2030)
- FIG 58 MEA MAAS MARKET REVENUE, BY COMMUTING PATTERN, $M (2017-2030)
- FIG 59 MEA MAAS MARKET REVENUE, BY PAYMENT TYPE, $M (2017-2030)
- FIG 60 MEA MAAS MARKET REVENUE, BY PROPULSION TYPE, $M (2017-2030)
- FIG 61 MEA MAAS MARKET REVENUE, BY END USE, $M (2017-2030)
- FIG 62 MEA MAAS MARKET REVENUE, BY COUNTRY, $M (2017-2030)
- FIG 63 U.S. MAAS MARKET REVENUE, BY SERVICE TYPE, $M (2017-2030)
- FIG 64 U.S. MAAS MARKET REVENUE, BY VEHICLE TYPE, $M (2017-2030)
- FIG 65 U.S. MAAS MARKET REVENUE, BY COMMUTING PATTERN, $M (2017-2030)
- FIG 66 U.S. MAAS MARKET REVENUE, BY PAYMENT TYPE, $M (2017-2030)
- FIG 67 U.S. MAAS MARKET REVENUE, BY PROPULSION TYPE, $M (2017-2030)
- FIG 68 U.S. MAAS MARKET REVENUE, BY END USE, $M (2017-2030)
- FIG 69 CANADA MAAS MARKET REVENUE, BY SERVICE TYPE, $M (2017-2030)
- FIG 70 CANADA MAAS MARKET REVENUE, BY VEHICLE TYPE, $M (2017-2030)
- FIG 71 CANADA MAAS MARKET REVENUE, BY COMMUTING PATTERN, $M (2017-2030)
- FIG 72 CANADA MAAS MARKET REVENUE, BY PAYMENT TYPE, $M (2017-2030)
- FIG 73 CANADA MAAS MARKET REVENUE, BY PROPULSION TYPE, $M (2017-2030)
- FIG 74 CANADA MAAS MARKET REVENUE, BY END USE, $M (2017-2030)
- FIG 75 GERMANY MAAS MARKET REVENUE, BY SERVICE TYPE, $M (2017-2030)
- FIG 76 GERMANY MAAS MARKET REVENUE, BY VEHICLE TYPE, $M (2017-2030)
- FIG 77 GERMANY MAAS MARKET REVENUE, BY COMMUTING PATTERN, $M (2017-2030)
- FIG 78 GERMANY MAAS MARKET REVENUE, BY PAYMENT TYPE, $M (2017-2030)
- FIG 79 GERMANY MAAS MARKET REVENUE, BY PROPULSION TYPE, $M (2017-2030)
- FIG 80 GERMANY MAAS MARKET REVENUE, BY END USE, $M (2017-2030)
- FIG 81 FRANCE MAAS MARKET REVENUE, BY SERVICE TYPE, $M (2017-2030)
- FIG 82 FRANCE MAAS MARKET REVENUE, BY VEHICLE TYPE, $M (2017-2030)
- FIG 83 FRANCE MAAS MARKET REVENUE, BY COMMUTING PATTERN, $M (2017-2030)
- FIG 84 FRANCE MAAS MARKET REVENUE, BY PAYMENT TYPE, $M (2017-2030)
- FIG 85 FRANCE MAAS MARKET REVENUE, BY PROPULSION TYPE, $M (2017-2030)
- FIG 86 FRANCE MAAS MARKET REVENUE, BY END USE, $M (2017-2030)
- FIG 87 U.K. MAAS MARKET REVENUE, BY SERVICE TYPE, $M (2017-2030)
- FIG 88 U.K. MAAS MARKET REVENUE, BY VEHICLE TYPE, $M (2017-2030)
- FIG 89 U.K. MAAS MARKET REVENUE, BY COMMUTING PATTERN, $M (2017-2030)
- FIG 90 U.K. MAAS MARKET REVENUE, BY PAYMENT TYPE, $M (2017-2030)
- FIG 91 U.K. MAAS MARKET REVENUE, BY PROPULSION TYPE, $M (2017-2030)
- FIG 92 U.K. MAAS MARKET REVENUE, BY END USE, $M (2017-2030)
- FIG 93 ITALY MAAS MARKET REVENUE, BY SERVICE TYPE, $M (2017-2030)
- FIG 94 ITALY MAAS MARKET REVENUE, BY VEHICLE TYPE, $M (2017-2030)
- FIG 95 ITALY MAAS MARKET REVENUE, BY COMMUTING PATTERN, $M (2017-2030)
- FIG 96 ITALY MAAS MARKET REVENUE, BY PAYMENT TYPE, $M (2017-2030)
- FIG 97 ITALY MAAS MARKET REVENUE, BY PROPULSION TYPE, $M (2017-2030)
- FIG 98 ITALY MAAS MARKET REVENUE, BY END USE, $M (2017-2030)
- FIG 99 SPAIN MAAS MARKET REVENUE, BY SERVICE TYPE, $M (2017-2030)
- FIG 100 SPAIN MAAS MARKET REVENUE, BY VEHICLE TYPE, $M (2017-2030)
- FIG 101 SPAIN MAAS MARKET REVENUE, BY COMMUTING PATTERN, $M (2017-2030)
- FIG 102 SPAIN MAAS MARKET REVENUE, BY PAYMENT TYPE, $M (2017-2030)
- FIG 103 SPAIN MAAS MARKET REVENUE, BY PROPULSION TYPE, $M (2017-2030)
- FIG 104 SPAIN MAAS MARKET REVENUE, BY END USE, $M (2017-2030)
- FIG 105 CHINA MAAS MARKET REVENUE, BY SERVICE TYPE, $M (2017-2030)
- FIG 106 CHINA MAAS MARKET REVENUE, BY VEHICLE TYPE, $M (2017-2030)
- FIG 107 CHINA MAAS MARKET REVENUE, BY COMMUTING PATTERN, $M (2017-2030)
- FIG 108 CHINA MAAS MARKET REVENUE, BY PAYMENT TYPE, $M (2017-2030)
- FIG 109 CHINA MAAS MARKET REVENUE, BY PROPULSION TYPE, $M (2017-2030)
- FIG 110 CHINA MAAS MARKET REVENUE, BY END USE, $M (2017-2030)
- FIG 111 JAPAN MAAS MARKET REVENUE, BY SERVICE TYPE, $M (2017-2030)
- FIG 112 JAPAN MAAS MARKET REVENUE, BY VEHICLE TYPE, $M (2017-2030)
- FIG 113 JAPAN MAAS MARKET REVENUE, BY COMMUTING PATTERN, $M (2017-2030)
- FIG 114 JAPAN MAAS MARKET REVENUE, BY PAYMENT TYPE, $M (2017-2030)
- FIG 115 JAPAN MAAS MARKET REVENUE, BY PROPULSION TYPE, $M (2017-2030)
- FIG 116 JAPAN MAAS MARKET REVENUE, BY END USE, $M (2017-2030)
- FIG 117 INDIA MAAS MARKET REVENUE, BY SERVICE TYPE, $M (2017-2030)
- FIG 118 INDIA MAAS MARKET REVENUE, BY VEHICLE TYPE, $M (2017-2030)
- FIG 119 INDIA MAAS MARKET REVENUE, BY COMMUTING PATTERN, $M (2017-2030)
- FIG 120 INDIA MAAS MARKET REVENUE, BY PAYMENT TYPE, $M (2017-2030)
- FIG 121 INDIA MAAS MARKET REVENUE, BY PROPULSION TYPE, $M (2017-2030)
- FIG 122 INDIA MAAS MARKET REVENUE, BY END USE, $M (2017-2030)
- FIG 123 AUSTRALIA MAAS MARKET REVENUE, BY SERVICE TYPE, $M (2017-2030)
- FIG 124 AUSTRALIA MAAS MARKET REVENUE, BY VEHICLE TYPE, $M (2017-2030)
- FIG 125 AUSTRALIA MAAS MARKET REVENUE, BY COMMUTING PATTERN, $M (2017-2030)
- FIG 126 AUSTRALIA MAAS MARKET REVENUE, BY PAYMENT TYPE, $M (2017-2030)
- FIG 127 AUSTRALIA MAAS MARKET REVENUE, BY PROPULSION TYPE, $M (2017-2030)
- FIG 128 AUSTRALIA MAAS MARKET REVENUE, BY END USE, $M (2017-2030)
- FIG 129 SOUTH KOREA MAAS MARKET REVENUE, BY SERVICE TYPE, $M (2017-2030)
- FIG 130 SOUTH KOREA MAAS MARKET REVENUE, BY VEHICLE TYPE, $M (2017-2030)
- FIG 131 SOUTH KOREA MAAS MARKET REVENUE, BY COMMUTING PATTERN, $M (2017-2030)
- FIG 132 SOUTH KOREA MAAS MARKET REVENUE, BY PAYMENT TYPE, $M (2017-2030)
- FIG 133 SOUTH KOREA MAAS MARKET REVENUE, BY PROPULSION TYPE, $M (2017-2030)
- FIG 134 SOUTH KOREA MAAS MARKET REVENUE, BY END USE, $M (2017-2030)
- FIG 135 BRAZIL MAAS MARKET REVENUE, BY SERVICE TYPE, $M (2017-2030)
- FIG 136 BRAZIL MAAS MARKET REVENUE, BY VEHICLE TYPE, $M (2017-2030)
- FIG 137 BRAZIL MAAS MARKET REVENUE, BY COMMUTING PATTERN, $M (2017-2030)
- FIG 138 BRAZIL MAAS MARKET REVENUE, BY PAYMENT TYPE, $M (2017-2030)
- FIG 139 BRAZIL MAAS MARKET REVENUE, BY PROPULSION TYPE, $M (2017-2030)
- FIG 140 BRAZIL MAAS MARKET REVENUE, BY END USE, $M (2017-2030)
- FIG 141 MEXICO MAAS MARKET REVENUE, BY SERVICE TYPE, $M (2017-2030)
- FIG 142 MEXICO MAAS MARKET REVENUE, BY VEHICLE TYPE, $M (2017-2030)
- FIG 143 MEXICO MAAS MARKET REVENUE, BY COMMUTING PATTERN, $M (2017-2030)
- FIG 144 MEXICO MAAS MARKET REVENUE, BY PAYMENT TYPE, $M (2017-2030)
- FIG 145 MEXICO MAAS MARKET REVENUE, BY PROPULSION TYPE, $M (2017-2030)
- FIG 146 MEXICO MAAS MARKET REVENUE, BY END USE, $M (2017-2030)
- FIG 147 SOUTH AFRICA MAAS MARKET REVENUE, BY SERVICE TYPE, $M (2017-2030)
- FIG 148 SOUTH AFRICA MAAS MARKET REVENUE, BY VEHICLE TYPE, $M (2017-2030)
- FIG 149 SOUTH AFRICA MAAS MARKET REVENUE, BY COMMUTING PATTERN, $M (2017-2030)
- FIG 150 SOUTH AFRICA MAAS MARKET REVENUE, BY PAYMENT TYPE, $M (2017-2030)
- FIG 151 SOUTH AFRICA MAAS MARKET REVENUE, BY PROPULSION TYPE, $M (2017-2030)
- FIG 152 SOUTH AFRICA MAAS MARKET REVENUE, BY END USE, $M (2017-2030)
- FIG 153 SAUDI ARABIA MAAS MARKET REVENUE, BY SERVICE TYPE, $M (2017-2030)
- FIG 154 SAUDI ARABIA MAAS MARKET REVENUE, BY VEHICLE TYPE, $M (2017-2030)
- FIG 155 SAUDI ARABIA MAAS MARKET REVENUE, BY COMMUTING PATTERN, $M (2017-2030)
- FIG 156 SAUDI ARABIA MAAS MARKET REVENUE, BY PAYMENT TYPE, $M (2017-2030)
- FIG 157 SAUDI ARABIA MAAS MARKET REVENUE, BY PROPULSION TYPE, $M (2017-2030)
- FIG 158 SAUDI ARABIA MAAS MARKET REVENUE, BY END USE, $M (2017-2030)
- FIG 159 U.A.E. MAAS MARKET REVENUE, BY SERVICE TYPE, $M (2017-2030)
- FIG 160 U.A.E. MAAS MARKET REVENUE, BY VEHICLE TYPE, $M (2017-2030)
- FIG 161 U.A.E. MAAS MARKET REVENUE, BY COMMUTING PATTERN, $M (2017-2030)
- FIG 162 U.A.E. MAAS MARKET REVENUE, BY PAYMENT TYPE, $M (2017-2030)
- FIG 163 U.A.E. MAAS MARKET REVENUE, BY PROPULSION TYPE, $M (2017-2030)
- FIG 164 U.A.E. MAAS MARKET REVENUE, BY END USE, $M (2017-2030)
- FIG 165 UBER TECHNOLOGIES INC. - REVENUE SPLIT BY SEGMENT AND GEOGRAPHY (2021)
- FIG 166 HERTZ GLOBAL HOLDINGS INC. - REVENUE SPLIT BY SEGMENT (2021)
- FIG 167 AVIS BUDGET GROUP INC. - REVENUE SPLIT BY SEGMENT AND GEOGRAPHY (2021)
- FIG 168 EUROPCAR MOBILITY GROUP S.A. - REVENUE SPLIT BY SEGMENT AND GEOGRAPHY (2021)
- FIG 169 SIXT SE - REVENUE SPLIT BY GEOGRAPHY (2021)
The global mobility-as-a-service market was valued at $128,489.2 million in 2021, which is expected to reach $519,697.5 million by 2030, fostering at a CAGR of 16.8% from 2021 to 2030. In 2021, the ride-hailing category held over 50% market share. The growth of the travel and tourism sector and the transition from offline to online booking and payment systems are driving the demand for ride-hailing services.
Urban traffic jams also drive the MaaS market. The rising population of large cities has led to an advance in the number of daily commuters, thus producing significant traffic congestion, especially during rush hours. Due to the lack of an efficient public transportation system, individuals prefer personal automobiles, thus compounding the situation. Hence, governments are striving to develop alternative transportation choices to combat this problem.
Key Findings of Mobility-as-a-Service Market Report:
- By 2050, 68% of the world's population will live in urban areas, and it is expected to aggravate the traffic congestion on highways, thereby driving the demand for MaaS.
- According to Transportation for America, in spite of investing over $500 billion to expand and create new roadways across the country, congestion in urban areas increased by 144% between 1993 and 2017.
- In 2021, the daily commuting category accounted for the largest mobility-as-a-service market share, and it is predicted to expand at the fastest pace in the coming years. The rising demand for shared vehicles among the young generation for satisfying its daily commuting demands is primarily responsible for the market development in this category.
- Because of the growing demand for the electrification of transportation systems, the electric propulsion category is predicted to boom at a significant CAGR in the future. Emission concerns and the stringent regulations in place to check them are impelling MaaS service providers to adopt EVs.
- For instance, Bird Rides Inc. and Moovit App Global Ltd. partnered in October 2021 to provide multimodal transportation services via EVs across 12 countries, namely Austria, France, Belgium, Germany, Italy, Israel, Norway, Spain, Portugal, Sweden, the U.K., and Switzerland, with plans to expand to the U.S.
- Sixt SE and Mobileye, an Intel Corporation subsidiary, announced their agreement in September 2021 to provide an autonomous robotaxi service in Munich, Germany. Later, the businesses hope to expand their autonomous ride-sharing services across other European countries.
- Environmental concerns are driving the mobility-as-a-service market at a high pace, primarily due to the initiatives being taken by governments around the world to achieve carbon neutrality and sustainability. Concerns about the degrading quality of the air caused by the growing automobile exhaust emissions have prompted governments to implement emission norms, promote shared mobility, and encourage the adoption of EVs.
- To maintain a competitive advantage in the market, big players have been engaged in collaborations and partnerships. Such mobility-as-a-service market players include Sixt SE, Europcar Mobility Group S.A., Enterprise Holdings Inc., Avis Budget Group Inc., Hertz Global Holdings Inc., Grab Holdings Inc., Beijing Xiaoju Technology Co. Ltd., Uber Technologies Inc., Lyft Inc., and ANI Technologies Pvt. Ltd.
Table of Contents
Chapter 1. Research Background
- 1.1 Research Objectives
- 1.2 Market Definition
- 1.3 Analysis Period
- 1.4 Market Data Reporting Unit
- 1.5 Market Size Breakdown by Segment
- 1.5.1 Market Segmentation by Service Type
- 1.5.2 Market Segmentation by Vehicle Type
- 1.5.3 Market Segmentation by Commuting Pattern
- 1.5.4 Market Segmentation by End Use
- 1.5.5 Market Segmentation by Payment Type
- 1.5.6 Market Segmentation by Propulsion Type
- 1.5.7 Market Segmentation by Region
- 1.6 Key Stakeholders
Chapter 2. Research Methodology
- 2.1 Secondary Research
- 2.2 Primary Research
- 2.2.1 Breakdown of Primary Research Respondents
- 2.2.1.1 By region
- 2.2.1.2 By industry participant
- 2.2.1.3 By company type
- 2.2.1 Breakdown of Primary Research Respondents
- 2.3 Market Size Estimation
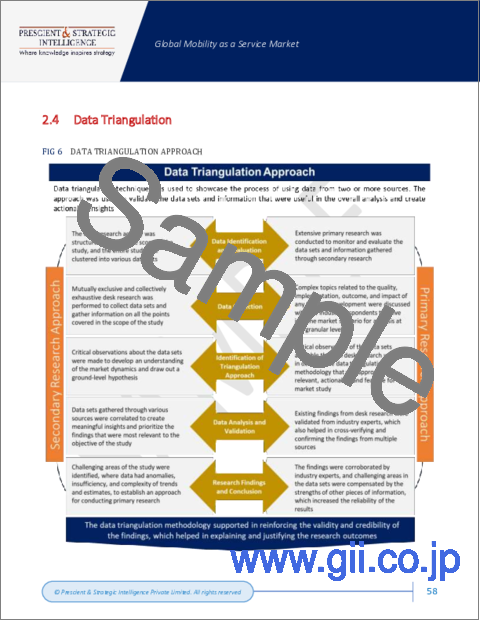
- 2.4 Data Triangulation
- 2.5 Assumptions for the Study
- 2.6 Currency Conversion Rates
Chapter 3. Executive Summary
Chapter 4. Definition of Market Segments
- 4.1 By Service Type
- 4.1.1 Ride Hailing
- 4.1.2 Ride Sharing
- 4.1.3 Micromobility
- 4.1.4 Car Rental
- 4.1.5 Shuttle Service
- 4.2 By Vehicle Type
- 4.2.1 Two-Wheeler
- 4.2.2 Car
- 4.2.3 Bus
- 4.3 By Commuting Pattern
- 4.3.1 Daily Commuting
- 4.3.2 Last-Mile Connectivity
- 4.3.3 Occasional Commuting
- 4.3.4 Others
- 4.4 By End Use
- 4.4.1 Personal
- 4.4.2 Business
- 4.5 By Payment Type
- 4.5.1 Short-Term Subscription
- 4.5.2 Pay-as-You-Go
- 4.6 By Propulsion Type
- 4.6.1 Electric
- 4.6.2 ICE
- 4.6.3 Others
Chapter 5. Industry Outlook
- 5.1 Market Dynamics
- 5.1.1 Trends
- 5.1.1.1 Deployment of EVs in mobility services
- 5.1.1.2 Incorporation of autonomous vehicles in MaaS
- 5.1.1.3 Technological developments allowing easy access to mobility services
- 5.1.2 Drivers
- 5.1.2.1 Cost-effectiveness and convenience of MaaS
- 5.1.2.2 Growing concerns over greenhouse gas emissions
- 5.1.2.3 Urban road congestion
- 5.1.2.4 Government initiatives facilitating adoption of MaaS
- 5.1.3 Impact Analysis of Drivers on Market Forecast
- 5.1.4 Restraints
- 5.1.4.1 Vandalism, thefts, and improper parking
- 5.1.4.2 Weather and infrastructure challenges
- 5.1.5 Impact Analysis of Restraints on Market Forecast
- 5.1.1 Trends
- 5.2 Porter's Five Forces Analysis
- 5.2.1 Bargaining Power of Buyers
- 5.2.2 Bargaining Power of Suppliers
- 5.2.3 Intensity of Rivalry
- 5.2.4 Threat of New Entrants
- 5.2.5 Threat of Substitutes
Chapter 6. MaaS Technology Trends
- 6.1 EVs
- 6.1.1 Initiatives of MaaS Companies for Adoption of EVs
- 6.1.2 Targets of MaaS Companies for Adoption of EVs
- 6.2 Autonomous Vehicles
Chapter 7. Global Market Size and Forecast
- 7.1 Overview
- 7.2 Market Revenue, by Service Type
- 7.3 Market Revenue, by Vehicle Type
- 7.4 Market Revenue, by Commuting Pattern
- 7.5 Market Revenue, by Payment Type
- 7.6 Market Revenue, by Propulsion Type
- 7.7 Market Revenue, by End Use
- 7.8 Market Revenue, by Region
Chapter 8. North America Market Size and Forecast
- 8.1 Market Revenue, by Service Type
- 8.2 Market Revenue, by Vehicle Type
- 8.3 Market Revenue, by Commuting Pattern
- 8.4 Market Revenue, by Payment Type
- 8.5 Market Revenue, by Propulsion Type
- 8.6 Market Revenue, by End Use
- 8.7 Market Revenue, by Country
Chapter 9. Europe Market Size and Forecast
- 9.1 Market Revenue, by Service Type
- 9.2 Market Revenue, by Vehicle Type
- 9.3 Market Revenue, by Commuting Pattern
- 9.4 Market Revenue, by Payment Type
- 9.5 Market Revenue, by Propulsion Type
- 9.6 Market Revenue, by End Use
- 9.7 Market Revenue, by Country
Chapter 10. APAC Market Size and Forecast
- 10.1 Market Revenue, by Service Type
- 10.2 Market Revenue, by Vehicle Type
- 10.3 Market Revenue, by Commuting Pattern
- 10.4 Market Revenue, by Payment Type
- 10.5 Market Revenue, by Propulsion Type
- 10.6 Market Revenue, by End Use
- 10.7 Market Revenue, by Country
Chapter 11. LATAM Market Size and Forecast
- 11.1 Market Revenue, by Service Type
- 11.2 Market Revenue, by Vehicle Type
- 11.3 Market Revenue, by Commuting Pattern
- 11.4 Market Revenue, by Payment Type
- 11.5 Market Revenue, by Propulsion Type
- 11.6 Market Revenue, by End Use
- 11.7 Market Revenue, by Country
Chapter 12. MEA Market Size and Forecast
- 12.1 Market Revenue, by Service Type
- 12.2 Market Revenue, by Vehicle Type
- 12.3 Market Revenue, by Commuting Pattern
- 12.4 Market Revenue, by Payment Type
- 12.5 Market Revenue, by Propulsion Type
- 12.6 Market Revenue, by End Use
- 12.7 Market Revenue, by Country
Chapter 13. U.S. Market Size and Forecast
- 13.1 Market Revenue, by Service Type
- 13.2 Market Revenue, by Vehicle Type
- 13.3 Market Revenue, by Commuting Pattern
- 13.4 Market Revenue, by Payment Type
- 13.5 Market Revenue, by Propulsion Type
- 13.6 Market Revenue, by End Use
Chapter 14. Canada Market Size and Forecast
- 14.1 Market Revenue, by Service Type
- 14.2 Market Revenue, by Vehicle Type
- 14.3 Market Revenue, by Commuting Pattern
- 14.4 Market Revenue, by Payment Type
- 14.5 Market Revenue, by Propulsion Type
- 14.6 Market Revenue, by End Use
Chapter 15. Germany Market Size and Forecast
- 15.1 Market Revenue, by Service Type
- 15.2 Market Revenue, by Vehicle Type
- 15.3 Market Revenue, by Commuting Pattern
- 15.4 Market Revenue, by Payment Type
- 15.5 Market Revenue, by Propulsion Type
- 15.6 Market Revenue, by End Use
Chapter 16. France Market Size and Forecast
- 16.1 Market Revenue, by Service Type
- 16.2 Market Revenue, by Vehicle Type
- 16.3 Market Revenue, by Commuting Pattern
- 16.4 Market Revenue, by Payment Type
- 16.5 Market Revenue, by Propulsion Type
- 16.6 Market Revenue, by End Use
Chapter 17. U.K. Market Size and Forecast
- 17.1 Market Revenue, by Service Type
- 17.2 Market Revenue, by Vehicle Type
- 17.3 Market Revenue, by Commuting Pattern
- 17.4 Market Revenue, by Payment Type
- 17.5 Market Revenue, by Propulsion Type
- 17.6 Market Revenue, by End Use
Chapter 18. Italy Market Size and Forecast
- 18.1 Market Revenue, by Service Type
- 18.2 Market Revenue, by Vehicle Type
- 18.3 Market Revenue, by Commuting Pattern
- 18.4 Market Revenue, by Payment Type
- 18.5 Market Revenue, by Propulsion Type
- 18.6 Market Revenue, by End Use
Chapter 19. Spain Market Size and Forecast
- 19.1 Market Revenue, by Service Type
- 19.2 Market Revenue, by Vehicle Type
- 19.3 Market Revenue, by Commuting Pattern
- 19.4 Market Revenue, by Payment Type
- 19.5 Market Revenue, by Propulsion Type
- 19.6 Market Revenue, by End Use
Chapter 20. China Market Size and Forecast
- 20.1 Market Revenue, by Service Type
- 20.2 Market Revenue, by Vehicle Type
- 20.3 Market Revenue, by Commuting Pattern
- 20.4 Market Revenue, by Payment Type
- 20.5 Market Revenue, by Propulsion Type
- 20.6 Market Revenue, by End Use
Chapter 21. Japan Market Size and Forecast
- 21.1 Market Revenue, by Service Type
- 21.2 Market Revenue, by Vehicle Type
- 21.3 Market Revenue, by Commuting Pattern
- 21.4 Market Revenue, by Payment Type
- 21.5 Market Revenue, by Propulsion Type
- 21.6 Market Revenue, by End Use
Chapter 22. India Market Size and Forecast
- 22.1 Market Revenue, by Service Type
- 22.2 Market Revenue, by Vehicle Type
- 22.3 Market Revenue, by Commuting Pattern
- 22.4 Market Revenue, by Payment Type
- 22.5 Market Revenue, by Propulsion Type
- 22.6 Market Revenue, by End Use
Chapter 23. Australia Market Size and Forecast
- 23.1 Market Revenue, by Service Type
- 23.2 Market Revenue, by Vehicle Type
- 23.3 Market Revenue, by Commuting Pattern
- 23.4 Market Revenue, by Payment Type
- 23.5 Market Revenue, by Propulsion Type
- 23.6 Market Revenue, by End Use
Chapter 24. South Korea Market Size and Forecast
- 24.1 Market Revenue, by Service Type
- 24.2 Market Revenue, by Vehicle Type
- 24.3 Market Revenue, by Commuting Pattern
- 24.4 Market Revenue, by Payment Type
- 24.5 Market Revenue, by Propulsion Type
- 24.6 Market Revenue, by End Use
Chapter 25. Brazil Market Size and Forecast
- 25.1 Market Revenue, by Service Type
- 25.2 Market Revenue, by Vehicle Type
- 25.3 Market Revenue, by Commuting Pattern
- 25.4 Market Revenue, by Payment Type
- 25.5 Market Revenue, by Propulsion Type
- 25.6 Market Revenue, by End Use
Chapter 26. Mexico Market Size and Forecast
- 26.1 Market Revenue, by Service Type
- 26.2 Market Revenue, by Vehicle Type
- 26.3 Market Revenue, by Commuting Pattern
- 26.4 Market Revenue, by Payment Type
- 26.5 Market Revenue, by Propulsion Type
- 26.6 Market Revenue, by End Use
Chapter 27. South Africa Market Size and Forecast
- 27.1 Market Revenue, by Service Type
- 27.2 Market Revenue, by Vehicle Type
- 27.3 Market Revenue, by Commuting Pattern
- 27.4 Market Revenue, by Payment Type
- 27.5 Market Revenue, by Propulsion Type
- 27.6 Market Revenue, by End Use
Chapter 28. Saudi Arabia Market Size and Forecast
- 28.1 Market Revenue, by Service Type
- 28.2 Market Revenue, by Vehicle Type
- 28.3 Market Revenue, by Commuting Pattern
- 28.4 Market Revenue, by Payment Type
- 28.5 Market Revenue, by Propulsion Type
- 28.6 Market Revenue, by End Use
Chapter 29. U.A.E. Market Size and Forecast
- 29.1 Market Revenue, by Service Type
- 29.2 Market Revenue, by Vehicle Type
- 29.3 Market Revenue, by Commuting Pattern
- 29.4 Market Revenue, by Payment Type
- 29.5 Market Revenue, by Propulsion Type
- 29.6 Market Revenue, by End Use
Chapter 30. Competitive Landscape
- 30.1 Competitive Analysis of Key Players
- 30.2 Strategic Developments of Key Players
- 30.2.1 Product and Service Launches
- 30.2.2 Mergers and Acquisitions
- 30.2.3 Partnerships
- 30.2.4 Service Expansions
- 30.2.5 Geographical Expansions
- 30.2.6 Other Developments
Chapter 31. Company Profiles
- 31.1 ANI Technologies Pvt. Ltd.
- 31.1.1 Business Overview
- 31.1.2 Product and Service Offerings
- 31.2 Lyft Inc.
- 31.2.1 Business Overview
- 31.2.2 Product and Service Offerings
- 31.2.3 Key Financial Summary
- 31.3 Uber Technologies Inc.
- 31.3.1 Business Overview
- 31.3.2 Product and Service Offerings
- 31.3.3 Key Financial Summary
- 31.4 Beijing Xiaoju Technology Co. Ltd. (Didi Chuxing)
- 31.4.1 Business Overview
- 31.4.2 Product and Service Offerings
- 31.5 Grab Holdings Inc.
- 31.5.1 Business Overview
- 31.5.2 Product and Service Offerings
- 31.6 Hertz Global Holdings Inc.
- 31.6.1 Business Overview
- 31.6.2 Product and Service Offerings
- 31.6.3 Key Financial Summary
- 31.7 Avis Budget Group Inc.
- 31.7.1 Business Overview
- 31.7.2 Product and Service Offerings
- 31.7.3 Key Financial Summary
- 31.8 Enterprise Holdings Inc.
- 31.8.1 Business Overview
- 31.8.2 Product and Service Offerings
- 31.9 Europcar Mobility Group S.A.
- 31.9.1 Business Overview
- 31.9.2 Product and Service Offerings
- 31.9.3 Key Financial Summary
- 31.10 Sixt SE
- 31.10.1 Business Overview
- 31.10.2 Product and Service Offerings
- 31.10.3 Key Financial Summary
- 31.11 CarShare Australia Pty. Ltd.
- 31.11.1 Business Overview
- 31.11.2 Product and Service Offerings
- 31.12 Turo Inc.
- 31.12.1 Business Overview
- 31.12.2 Product and Service Offerings
- 31.13 Gett Inc.
- 31.13.1 Business Overview
- 31.13.2 Product and Service Offerings
- 31.14 FREE NOW
- 31.14.1 Business Overview
- 31.14.2 Product and Service Offerings
- 31.15 Addison Lee Ltd.
- 31.15.1 Business Overview
- 31.15.2 Product and Service Offerings
- 31.16 moovel Group GmbH
- 31.16.1 Business Overview
- 31.16.2 Product and Service Offerings
- 31.17 Curb Mobility LLC
- 31.17.1 Business Overview
- 31.17.2 Product and Service Offerings
- 31.18 Cabify Espana SL
- 31.18.1 Business Overview
- 31.18.2 Product and Service Offerings
- 31.19 Bolt Technology OU
- 31.19.1 Business Overview
- 31.19.2 Product and Service Offerings
- 31.2 Moovit App Global Ltd.
- 31.20.1 Business Overview
- 31.20.2 Product and Service Offerings
- 31.21 MaaS Global Ltd.
- 31.21.1 Business Overview
- 31.21.2 Product and Service Offerings
Chapter 32. Appendix
- 32.1 Abbreviations
- 32.2 Sources and References
- 32.3 Related Reports