|
|
市場調査レポート
商品コード
1478637
セキュリティスクリーニング市場、シェア、規模、動向、産業分析レポート:技術別、用途別、最終用途別、地域別、セグメント別予測、2024年~2032年Security Screening Market Share, Size, Trends, Industry Analysis Report, By Technology (Biometrics, X-ray Screening, Electromagnetic Metal Detection, Others); By Application; By End Use; By Region; Segment Forecast, 2024- 2032 |
||||||

|
|||||||
カスタマイズ可能
|
|||||||

| セキュリティスクリーニング市場、シェア、規模、動向、産業分析レポート:技術別、用途別、最終用途別、地域別、セグメント別予測、2024年~2032年 |
|
出版日: 2024年04月24日
発行: Polaris Market Research
ページ情報: 英文 119 Pages
納期: 即日から翌営業日
|

全表示
- 概要
- 図表
- 目次
Polaris Market Researchの最新調査によると、世界のセキュリティスクリーニング市場規模は2032年までに170億7,360万米ドルに達する見込みです。この調査レポートは、現在の市場力学を詳細に洞察し、将来の市場成長に関する分析を提供しています。
セキュリティスクリーニング市場は、公共の安全とインフラ保護への関心の高まりが成長の原動力となっています。政府、重要インフラ施設、交通ハブ、商業施設は、テロ、密輸、違法行為などの様々な脅威から人、資産、インフラを守るために、強固なセキュリティスクリーニング対策の実施を優先しています。世界的にセキュリティに対する懸念が高まる中、手荷物・貨物スクリーニングシステム、金属探知機、爆発物微量探知機、生体認証システムなどの高度なスクリーニング技術に対する需要が高まっています。
世界各地の空港は、セキュリティ上の課題の高まりに直面しており、当局はスクリーニング能力の強化に多大なリソースを割いています。航空旅行の増加と脅威の進化に伴い、乗客の安全を確保し、セキュリティ侵害を防止するための高度なスクリーニング技術と手順に対する需要が高まっています。政府や空港運営会社は、高度な画像技術や生体認証ソリューションなど、最先端のスクリーニング機器やインフラに投資しています。規制要件や国際基準は空港での厳格なセキュリティ対策を義務付けており、スクリーニング技術への投資をさらに促進しています。
セキュリティスクリーニング市場は、スマート技術の採用増加によっても牽引されています。スマートシティとIoTの台頭により、インテリジェント・システムがスクリーニング・プロセスに統合され、効率と有効性が向上しています。スマートセンサーは異常を検知し、さらなる調査のためのアラートを発し、データ解析は予測的洞察を提供します。コネクティビティ・ソリューションは、セキュリティ担当者間のリアルタイム・コミュニケーションを可能にし、潜在的脅威への迅速な対応を促進します。これらのテクノロジーを統合することで、業務ワークフローが改善され、手作業による介入が減り、全体的なセキュリティが強化されます。
物理的な身体検査や侵襲的な検査を伴う従来の方法は、ミリ波スキャナーや高度な画像処理システムのような非侵入型テクノロジーに取って代わられつつあります。これらのソリューションは、プライバシーを損なうことなく、また不便を強いることなく、迅速かつ正確に脅威を検知します。特に空港やスタジアムのような混雑した場所では、非侵入型スクリーニングは、乗客の体験を維持しながらセキュリティを強化する上で極めて重要です。合理化されたスクリーニング・プロセスの必要性とともにセキュリティの重視が高まるにつれ、非侵入型スクリーニング・ソリューションの市場は世界的に拡大し続け、セキュリティスクリーニング市場の革新と普及を促進しています。
セキュリティスクリーニング市場のレポートハイライト
2023年には、セキュリティ強化、他のセキュリティシステムとの統合、規制要件により、生体認証分野が大きな収益シェアを占めました。
2023年、空港・交通ハブ、政府・公共施設におけるセキュリティスクリーニングソリューションの広範な使用により、人による検査が大きな収益シェアを占めました。
2023年、輸送部門は、乗客数の多さ、規制遵守、運用効率により、大きな収益シェアを占めました。
アジア太平洋地域は、急速な経済発展、テロの脅威の増大、航空産業の拡大により、予測期間中に大きな成長が見込まれています。
目次
第1章 イントロダクション
第2章 エグゼクティブサマリー
第3章 調査手法
第4章 世界セキュリティスクリーニング市場の洞察
- 最終用途スナップショット
- セキュリティスクリーニング市場力学
- 促進要因と機会
- セキュリティ脅威の増大により、製品の需要が増加すると予測される
- 厳格な規制要件により、セキュリティスクリーニング市場の成長が促進されると予想される
- 抑制要因と課題
- 導入コストが高いため、市場の成長が阻害される可能性がある
- 促進要因と機会
- PESTEL分析
- セキュリティスクリーニング市場の最終用途の動向
- バリューチェーン分析
- COVID-19の影響分析
第5章 世界のセキュリティスクリーニング市場:技術別
- 主な調査結果
- イントロダクション
- 生体認証
- X線検査
- 電磁金属探知機
- その他
第6章 世界のセキュリティスクリーニング市場:用途別
- 主な調査結果
- イントロダクション
- 手荷物および貨物検査
- 人物スクリーニング
- 車両検査
- その他
第7章 世界のセキュリティスクリーニング市場:最終用途別
- 主な調査結果
- イントロダクション
- 商業
- 輸送機関
- 小売り
- 政府
- ホスピタリティ
- 産業
- その他
第8章 世界のセキュリティスクリーニング市場:地域
- 主な調査結果
- イントロダクション
- セキュリティスクリーニング市場の評価:地域別、2019-2032年
- 北米
- 北米:技術別、2019-2032年
- 北米:最終用途別、2019年~2032年
- 北米:用途別、2019-2032年
- 米国
- カナダ
- 欧州
- 欧州:技術別、2019-2032年
- 欧州:最終用途別、2019-2032年
- 欧州:用途別、2019-2032年
- 英国
- フランス
- ドイツ
- イタリア
- スペイン
- オランダ
- ロシア
- アジア太平洋地域
- アジア太平洋地域:技術別、2019-2032年
- アジア太平洋地域:最終用途別、2019年~2032年
- アジア太平洋地域:用途別、2019-2032年
- 中国
- インド
- マレーシア
- 日本
- インドネシア
- 韓国
- 中東・アフリカ
- 中東・アフリカ:技術別、2019年~2032年
- 中東・アフリカ:最終用途別、2019-2032年
- 中東・アフリカ:用途別、2019-2032年
- サウジアラビア
- アラブ首長国連邦
- イスラエル
- 南アフリカ
- ラテンアメリカ
- ラテンアメリカ:技術別、2019-2032年
- ラテンアメリカ:最終用途別、2019-2032年
- ラテンアメリカ:用途別、2019-2032年
- メキシコ
- ブラジル
- アルゼンチン
第9章 競合情勢
- 拡大と買収の分析
- 拡大
- 買収
- 提携/協業/合意/公開
第10章 企業プロファイル
- Analogic Corporation
- Astrophysics Inc.
- Autoclear LLC
- CEIA S.p.A.
- Garrett Metal Detectors
- Gilardoni S.p.A.
- Honeywell International Inc.
- Leidos Holdings, Inc.
- NEC Corporation
- Nuctech Company Limited
- OSI Systems, Inc.
- Raytheon Company
- Smiths Group plc
- Thales
- Vanderlande Industries
List of Tables
- Table 1 Global Security Screening Market, by Technology, 2019-2032 (USD Million)
- Table 2 Global Security Screening Market, by Application, 2019-2032 (USD Million)
- Table 3 Global Security Screening Market, by End Use, 2019-2032 (USD Million)
- Table 4 Security Screening Market Assessment, By Geography, 2019-2032 (USD Million)
- Table 5 North America: Security Screening Market, by Technology, 2019-2032 (USD Million)
- Table 6 North America: Security Screening Market, by Application, 2019-2032 (USD Million)
- Table 7 North America: Security Screening Market, by End Use, 2019-2032 (USD Million)
- Table 8 U.S.: Security Screening Market, by Technology, 2019-2032 (USD Million)
- Table 9 U.S.: Security Screening Market, by Application, 2019-2032 (USD Million)
- Table 10 U.S.: Security Screening Market, by End Use, 2019-2032 (USD Million)
- Table 11 Canada: Security Screening Market, by Technology, 2019-2032 (USD Million)
- Table 12 Canada: Security Screening Market, by Application, 2019-2032 (USD Million)
- Table 13 Canada: Security Screening Market, by End Use, 2019-2032 (USD Million)
- Table 14 Europe: Security Screening Market, by Technology, 2019-2032 (USD Million)
- Table 15 Europe: Security Screening Market, by Application, 2019-2032 (USD Million)
- Table 16 Europe: Security Screening Market, by End Use, 2019-2032 (USD Million)
- Table 17 UK: Security Screening Market, by Technology, 2019-2032 (USD Million)
- Table 18 UK: Security Screening Market, by Application, 2019-2032 (USD Million)
- Table 19 UK: Security Screening Market, by End Use, 2019-2032 (USD Million)
- Table 20 France: Security Screening Market, by Technology, 2019-2032 (USD Million)
- Table 21 France: Security Screening Market, by Application, 2019-2032 (USD Million)
- Table 22 France: Security Screening Market, by End Use, 2019-2032 (USD Million)
- Table 23 Germany: Security Screening Market, by Technology, 2019-2032 (USD Million)
- Table 24 Germany: Security Screening Market, by Application, 2019-2032 (USD Million)
- Table 25 Germany: Security Screening Market, by End Use, 2019-2032 (USD Million)
- Table 26 Italy: Security Screening Market, by Technology, 2019-2032 (USD Million)
- Table 27 Italy: Security Screening Market, by Application, 2019-2032 (USD Million)
- Table 28 Italy: Security Screening Market, by End Use, 2019-2032 (USD Million)
- Table 29 Spain: Security Screening Market, by Technology, 2019-2032 (USD Million)
- Table 30 Spain: Security Screening Market, by Application, 2019-2032 (USD Million)
- Table 31 Spain: Security Screening Market, by End Use, 2019-2032 (USD Million)
- Table 32 Netherlands: Security Screening Market, by Technology, 2019-2032 (USD Million)
- Table 33 Netherlands: Security Screening Market, by Application, 2019-2032 (USD Million)
- Table 34 Netherlands: Security Screening Market, by End Use, 2019-2032 (USD Million)
- Table 35 Russia: Security Screening Market, by Technology, 2019-2032 (USD Million)
- Table 36 Russia: Security Screening Market, by Application, 2019-2032 (USD Million)
- Table 37 Russia: Security Screening Market, by End Use, 2019-2032 (USD Million)
- Table 38 Asia Pacific: Security Screening Market, by Technology, 2019-2032 (USD Million)
- Table 39 Asia Pacific: Security Screening Market, by Application, 2019-2032 (USD Million)
- Table 40 Asia Pacific: Security Screening Market, by End Use, 2019-2032 (USD Million)
- Table 41 China: Security Screening Market, by Technology, 2019-2032 (USD Million)
- Table 42 China: Security Screening Market, by Application, 2019-2032 (USD Million)
- Table 43 China: Security Screening Market, by End Use, 2019-2032 (USD Million)
- Table 44 India: Security Screening Market, by Technology, 2019-2032 (USD Million)
- Table 45 India: Security Screening Market, by Application, 2019-2032 (USD Million)
- Table 46 India: Security Screening Market, by End Use, 2019-2032 (USD Million)
- Table 47 Malaysia: Security Screening Market, by Technology, 2019-2032 (USD Million)
- Table 48 Malaysia: Security Screening Market, by Application, 2019-2032 (USD Million)
- Table 49 Malaysia: Security Screening Market, by End Use, 2019-2032 (USD Million)
- Table 50 Japan: Security Screening Market, by Technology, 2019-2032 (USD Million)
- Table 51 Japan: Security Screening Market, by Application, 2019-2032 (USD Million)
- Table 52 Japan: Security Screening Market, by End Use, 2019-2032 (USD Million)
- Table 53 Indonesia: Security Screening Market, by Technology, 2019-2032 (USD Million)
- Table 54 Indonesia: Security Screening Market, by Application, 2019-2032 (USD Million)
- Table 55 Indonesia: Security Screening Market, by End Use, 2019-2032 (USD Million)
- Table 56 South Korea: Security Screening Market, by Technology, 2019-2032 (USD Million)
- Table 57 South Korea: Security Screening Market, by Application, 2019-2032 (USD Million)
- Table 58 South Korea: Security Screening Market, by End Use, 2019-2032 (USD Million)
- Table 59 Middle East & Africa: Security Screening Market, by Technology, 2019-2032 (USD Million)
- Table 60 Middle East & Africa: Security Screening Market, by Application, 2019-2032 (USD Million)
- Table 61 Middle East & Africa: Security Screening Market, by End Use, 2019-2032 (USD Million)
- Table 62 Saudi Arabia: Security Screening Market, by Technology, 2019-2032 (USD Million)
- Table 63 Saudi Arabia: Security Screening Market, by Application, 2019-2032 (USD Million)
- Table 64 Saudi Arabia: Security Screening Market, by End Use, 2019-2032 (USD Million)
- Table 65 UAE: Security Screening Market, by Technology, 2019-2032 (USD Million)
- Table 66 UAE: Security Screening Market, by Application, 2019-2032 (USD Million)
- Table 67 UAE: Security Screening Market, by End Use, 2019-2032 (USD Million)
- Table 68 Israel: Security Screening Market, by Technology, 2019-2032 (USD Million)
- Table 69 Israel: Security Screening Market, by Application, 2019-2032 (USD Million)
- Table 70 Israel: Security Screening Market, by End Use, 2019-2032 (USD Million)
- Table 71 South Africa: Security Screening Market, by Technology, 2019-2032 (USD Million)
- Table 72 South Africa: Security Screening Market, by Application, 2019-2032 (USD Million)
- Table 73 South Africa: Security Screening Market, by End Use, 2019-2032 (USD Million)
- Table 74 Latin America: Security Screening Market, by Technology, 2019-2032 (USD Million)
- Table 75 Latin America: Security Screening Market, by Application, 2019-2032 (USD Million)
- Table 76 Latin America: Security Screening Market, by End Use, 2019-2032 (USD Million)
- Table 77 Mexico: Security Screening Market, by Technology, 2019-2032 (USD Million)
- Table 78 Mexico: Security Screening Market, by Application, 2019-2032 (USD Million)
- Table 79 Mexico: Security Screening Market, by End Use, 2019-2032 (USD Million)
- Table 80 Brazil: Security Screening Market, by Technology, 2019-2032 (USD Million)
- Table 81 Brazil: Security Screening Market, by Application, 2019-2032 (USD Million)
- Table 82 Brazil: Security Screening Market, by End Use, 2019-2032 (USD Million)
- Table 83 Argentina: Security Screening Market, by Technology, 2019-2032 (USD Million)
- Table 84 Argentina: Security Screening Market, by Application, 2019-2032 (USD Million)
- Table 85 Argentina: Security Screening Market, by End Use, 2019-2032 (USD Million)
List of Figures
- Figure 1. Global Security Screening Market, 2019-2032 (USD Million)
- Figure 2. Integrated Ecosystem
- Figure 3. Research Methodology: Top-Down & Bottom-Up Approach
- Figure 4. Market by Geography
- Figure 5. Porter's Five Forces
- Figure 6. Market by Application
- Figure 7. Global Security Screening Market, by Application, 2022 & 2032 (USD Million)
- Figure 8. Market by Technology
- Figure 9. Global Security Screening Market, by Technology, 2022 & 2032 (USD Million)
- Figure 10. Market by End Use
- Figure 11. Global Security Screening Market, by End Use, 2022 & 2032 (USD Million)
- Figure 12. Security Screening Market Assessment, By Geography, 2019-2032 (USD Million)
- Figure 13. Strategic Analysis - Security Screening Market
The global Security Screening market size is expected to reach USD 17,073.60 million by 2032, according to a new study by Polaris Market Research. The report "Security Screening Market Share, Size, Trends, Industry Analysis Report, By Technology (Biometrics, X-ray Screening, Electromagnetic Metal Detection, Others); By Application; By End Use; By Region; Segment Forecast, 2024- 2032" gives a detailed insight into current market dynamics and provides analysis on future market growth.
The security screening market experiences growth driven by a heightened focus on public safety and infrastructure protection. Governments, critical infrastructure facilities, transportation hubs, and commercial establishments prioritize implementing robust security screening measures to safeguard people, assets, and infrastructure against various threats, including terrorism, smuggling, and illegal activities. With increasing security concerns globally, there's a growing demand for advanced screening technologies such as baggage and cargo screening systems, metal detectors, explosive trace detectors, and biometric identification systems.
Airports globally face heightened security challenges, leading authorities to allocate significant resources to enhance screening capabilities. With rising air travel and evolving threats, there's a growing demand for advanced screening technologies and procedures to ensure passenger safety and prevent security breaches. Governments and airport operators invest in state-of-the-art screening equipment and infrastructure, including advanced imaging technologies and biometric authentication solutions. Regulatory requirements and international standards mandate stringent security measures at airports, further driving investments in screening technologies.
The security screening market is also driven by the increasing adoption of smart technologies. With the rise of smart cities and IoT, intelligent systems are integrated into screening processes, enhancing efficiency and effectiveness. Smart sensors detect anomalies, triggering alerts for further investigation, while data analytics provide predictive insights. Connectivity solutions enable real-time communication among security personnel, facilitating swift responses to potential threats. Integration of these technologies improves operational workflows, reduces manual intervention, and enhances overall security.
Traditional methods, involving physical pat-downs or invasive searches, are increasingly replaced by non-intrusive technologies like millimeter-wave scanners and advanced imaging systems. These solutions swiftly and accurately detect threats without compromising privacy or causing inconvenience. Particularly crucial in crowded areas such as airports and stadiums, non-intrusive screening enhances security while maintaining the passenger experience. As the emphasis on security grows alongside the need for streamlined screening processes, the market for non-intrusive screening solutions continues to expand globally, driving innovation and adoption in the security screening market.
Security Screening Market Report Highlights
In 2023, the biometrics segment held significant revenue share owing to enhanced security, integration with other security systems, and regulatory requirements.
In 2023, the people screening held significant revenue share owing to wide use of security screening solutions in airports & transportation hubs, and government & public facilities.
In 2023, the transportation segment held significant revenue share owing to high volumes of passengers, regulatory compliance, and operational efficiency.
Asia-Pacific region is expected to experience significant growth during the forecast period due to rapid economic development, growing terrorism threats, and expansion of aviation industry.
The market is highly competitive owing to the existence of market players with a global presence, including Analogic Corporation, Astrophysics Inc., Autoclear LLC, Honeywell International Inc., Leidos Holdings, Inc., NEC Corporation, Raytheon Company, and Smiths Group plc among others.
Polaris Market Research has segmented the Security Screening market report based on technology, application, end use, and region:
Security Screening, Technology Outlook (Revenue - USD Million, 2019 - 2032)
- Biometrics
- X-ray Screening
- Electromagnetic Metal Detection
- Others
Security Screening, Application Outlook (Revenue - USD Million, 2019 - 2032)
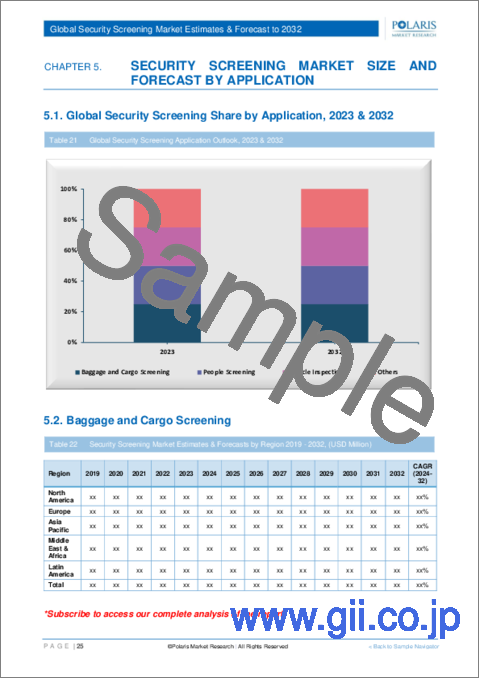
- Baggage and Cargo Screening
- People Screening
- Vehicle Inspection
- Others
Security Screening, End Use Outlook (Revenue - USD Million, 2019 - 2032)
- Commercial
- Transportation
- Retail
- Government
- Hospitality
- Industrial
- Others
Security Screening, Regional Outlook (Revenue - USD Million, 2019 - 2032)
- North America
- U.S.
- Canada
- Europe
- France
- Germany
- UK
- Italy
- Netherlands
- Spain
- Russia
- Asia Pacific
- Japan
- China
- India
- Malaysia
- Indonesia
- South Korea
- Latin America
- Brazil
- Mexico
- Argentina
- Middle East & Africa
- Saudi Arabia
- UAE
- Israel
- South Africa
Table of Contents
1. Introduction
- 1.1. Report Description
- 1.1.1. Objectives of the Study
- 1.1.2. Market Scope
- 1.1.3. Assumptions
- 1.2. Stakeholders
2. Executive Summary
- 2.1. Market Highlights
3. Research Methodology
- 3.1. Overview
- 3.1.1. Data Mining
- 3.2. Data Sources
- 3.2.1. Primary Sources
- 3.2.2. Secondary Sources
4. Global Security Screening Market Insights
- 4.1. Security Screening Market - End Use Snapshot
- 4.2. Security Screening Market Dynamics
- 4.2.1. Drivers and Opportunities
- 4.2.1.1. Increasing security threats are projected to spur the product demand
- 4.2.1.2. Stringent regulatory requirements are expected to drive security screening market growth
- 4.2.2. Restraints and Challenges
- 4.2.2.1. High Cost of Implementation is likely to impede the market growth
- 4.2.1. Drivers and Opportunities
- 4.3. Porter's Five Forces Analysis
- 4.3.1. Bargaining Power of Suppliers (Moderate)
- 4.3.2. Threats of New Entrants: (Low)
- 4.3.3. Bargaining Power of Buyers (Moderate)
- 4.3.4. Threat of Substitute (Moderate)
- 4.3.5. Rivalry among existing firms (High)
- 4.4. PESTEL Analysis
- 4.5. Security Screening Market End Use Trends
- 4.6. Value Chain Analysis
- 4.7. COVID-19 Impact Analysis
5. Global Security Screening Market, by Technology
- 5.1. Key Findings
- 5.2. Introduction
- 5.2.1. Global Security Screening Market, by Technology, 2019-2032 (USD Million)
- 5.3. Biometrics
- 5.3.1. Global Security Screening Market, by Biometrics, by Region, 2019-2032 (USD Million)
- 5.4. X-ray Screening
- 5.4.1. Global Security Screening Market, by X-ray Screening, by Region, 2019-2032 (USD Million)
- 5.5. Electromagnetic Metal Detection
- 5.5.1. Global Security Screening Market, by Electromagnetic Metal Detection, by Region, 2019-2032 (USD Million)
- 5.6. Others
- 5.6.1. Global Security Screening Market, by Others, by Region, 2019-2032 (USD Million)
6. Global Security Screening Market, by Application
- 6.1. Key Findings
- 6.2. Introduction
- 6.2.1. Global Security Screening Market, by Application, 2019-2032 (USD Million)
- 6.3. Baggage and Cargo Screening
- 6.3.1. Global Security Screening Market, by Baggage and Cargo Screening, by Region, 2019-2032 (USD Million)
- 6.4. People Screening
- 6.4.1. Global Security Screening Market, by People Screening, by Region, 2019-2032 (USD Million)
- 6.5. Vehicle Inspection
- 6.5.1. Global Security Screening Market, by Vehicle Inspection, by Region, 2019-2032 (USD Million)
- 6.6. Others
- 6.6.1. Global Security Screening Market, by Others, by Region, 2019-2032 (USD Million)
7. Global Security Screening Market, by End Use
- 7.1. Key Findings
- 7.2. Introduction
- 7.2.1. Global Security Screening Market, by End Use, 2019-2032 (USD Million)
- 7.3. Commercial
- 7.3.1. Global Security Screening Market, by Commercial, By Region, 2019-2032 (USD Million)
- 7.4. Transportation
- 7.4.1. Global Security Screening Market, by Transportation, By Region, 2019-2032 (USD Million)
- 7.5. Retail
- 7.5.1. Global Security Screening Market, by Retail, By Region, 2019-2032 (USD Million)
- 7.6. Government
- 7.6.1. Global Security Screening Market, by Government, By Region, 2019-2032 (USD Million)
- 7.7. Hospitality
- 7.7.1. Global Security Screening Market, by Hospitality, By Region, 2019-2032 (USD Million)
- 7.8. Industrial
- 7.8.1. Global Security Screening Market, by Industrial, By Region, 2019-2032 (USD Million)
- 7.9. Others
- 7.9.1. Global Security Screening Market, by Others, By Region, 2019-2032 (USD Million)
8. Global Security Screening Market, by Geography
- 8.1. Key findings
- 8.2. Introduction
- 8.2.1. Security Screening Market Assessment, By Geography, 2019-2032 (USD Million)
- 8.3. Security Screening Market - North America
- 8.3.1. North America: Security Screening Market, by Technology, 2019-2032 (USD Million)
- 8.3.2. North America: Security Screening Market, by End Use, 2019-2032 (USD Million)
- 8.3.3. North America: Security Screening Market, by Application, 2019-2032 (USD Million)
- 8.3.4. Security Screening Market - U.S.
- 8.3.4.1. U.S.: Security Screening Market, by Technology, 2019-2032 (USD Million)
- 8.3.4.2. U.S.: Security Screening Market, by End Use, 2019-2032 (USD Million)
- 8.3.4.3. U.S.: Security Screening Market, by Application, 2019-2032 (USD Million)
- 8.3.5. Security Screening Market - Canada
- 8.3.5.1. Canada: Security Screening Market, by Technology, 2019-2032 (USD Million)
- 8.3.5.2. Canada.: Security Screening Market, by End Use, 2019-2032 (USD Million)
- 8.3.5.3. Canada: Security Screening Market, by Application, 2019-2032 (USD Million)
- 8.4. Security Screening Market - Europe
- 8.4.1. Europe: Security Screening Market, by Technology, 2019-2032 (USD Million)
- 8.4.2. Europe.: Security Screening Market, by End Use, 2019-2032 (USD Million)
- 8.4.3. Europe: Security Screening Market, by Application, 2019-2032 (USD Million)
- 8.4.4. Security Screening Market - UK
- 8.4.4.1. UK: Security Screening Market, by Technology, 2019-2032 (USD Million)
- 8.4.4.2. UK.: Security Screening Market, by End Use, 2019-2032 (USD Million)
- 8.4.4.3. UK: Security Screening Market, by Application, 2019-2032 (USD Million)
- 8.4.5. Security Screening Market - France
- 8.4.5.1. France: Security Screening Market, by Technology, 2019-2032 (USD Million)
- 8.4.5.2. France.: Security Screening Market, by End Use, 2019-2032 (USD Million)
- 8.4.5.3. France: Security Screening Market, by Application, 2019-2032 (USD Million)
- 8.4.6. Security Screening Market - Germany
- 8.4.6.1. Germany: Security Screening Market, by Technology, 2019-2032 (USD Million)
- 8.4.6.2. Germany.: Security Screening Market, by End Use, 2019-2032 (USD Million)
- 8.4.6.3. Germany: Security Screening Market, by Application, 2019-2032 (USD Million)
- 8.4.7. Security Screening Market - Italy
- 8.4.7.1. Italy: Security Screening Market, by Technology, 2019-2032 (USD Million)
- 8.4.7.2. Italy.: Security Screening Market, by End Use, 2019-2032 (USD Million)
- 8.4.7.3. Italy: Security Screening Market, by Application, 2019-2032 (USD Million)
- 8.4.8. Security Screening Market - Spain
- 8.4.8.1. Spain: Security Screening Market, by Technology, 2019-2032 (USD Million)
- 8.4.8.2. Spain.: Security Screening Market, by End Use, 2019-2032 (USD Million)
- 8.4.8.3. Spain: Security Screening Market, by Application, 2019-2032 (USD Million)
- 8.4.9. Security Screening Market - Netherlands
- 8.4.9.1. Netherlands: Security Screening Market, by Technology, 2019-2032 (USD Million)
- 8.4.9.2. Netherlands.: Security Screening Market, by End Use, 2019-2032 (USD Million)
- 8.4.9.3. Netherlands: Security Screening Market, by Application, 2019-2032 (USD Million)
- 8.4.10. Security Screening Market - Russia
- 8.4.10.1. Russia: Security Screening Market, by Technology, 2019-2032 (USD Million)
- 8.4.10.2. Russia.: Security Screening Market, by End Use, 2019-2032 (USD Million)
- 8.4.10.3. Russia: Security Screening Market, by Application, 2019-2032 (USD Million)
- 8.5. Security Screening Market - Asia Pacific
- 8.5.1. Asia Pacific: Security Screening Market, by Technology, 2019-2032 (USD Million)
- 8.5.2. Asia Pacific.: Security Screening Market, by End Use, 2019-2032 (USD Million)
- 8.5.3. Asia Pacific: Security Screening Market, by Application, 2019-2032 (USD Million)
- 8.5.4. Security Screening Market - China
- 8.5.4.1. China: Security Screening Market, by Technology, 2019-2032 (USD Million)
- 8.5.4.2. China.: Security Screening Market, by End Use, 2019-2032 (USD Million)
- 8.5.4.3. China: Security Screening Market, by Application, 2019-2032 (USD Million)
- 8.5.5. Security Screening Market - India
- 8.5.5.1. India: Security Screening Market, by Technology, 2019-2032 (USD Million)
- 8.5.5.2. India.: Security Screening Market, by End Use, 2019-2032 (USD Million)
- 8.5.5.3. India: Security Screening Market, by Application, 2019-2032 (USD Million)
- 8.5.6. Security Screening Market - Malaysia
- 8.5.6.1. Malaysia: Security Screening Market, by Technology, 2019-2032 (USD Million)
- 8.5.6.2. Malaysia.: Security Screening Market, by End Use, 2019-2032 (USD Million)
- 8.5.6.3. Malaysia: Security Screening Market, by Application, 2019-2032 (USD Million)
- 8.5.7. Security Screening Market - Japan
- 8.5.7.1. Japan: Security Screening Market, by Technology, 2019-2032 (USD Million)
- 8.5.7.2. Japan.: Security Screening Market, by End Use, 2019-2032 (USD Million)
- 8.5.7.3. Japan: Security Screening Market, by Application, 2019-2032 (USD Million)
- 8.5.8. Security Screening Market - Indonesia
- 8.5.8.1. Indonesia: Security Screening Market, by Technology, 2019-2032 (USD Million)
- 8.5.8.2. Indonesia.: Security Screening Market, by End Use, 2019-2032 (USD Million)
- 8.5.8.3. Indonesia: Security Screening Market, by Application, 2019-2032 (USD Million)
- 8.5.9. Security Screening Market - South Korea
- 8.5.9.1. South Korea: Security Screening Market, by Technology, 2019-2032 (USD Million)
- 8.5.9.2. South Korea.: Security Screening Market, by End Use, 2019-2032 (USD Million)
- 8.5.9.3. South Korea: Security Screening Market, by Application, 2019-2032 (USD Million)
- 8.6. Security Screening Market - Middle East & Africa
- 8.6.1. Middle East & Africa: Security Screening Market, by Technology, 2019-2032 (USD Million)
- 8.6.2. Middle East & Africa.: Security Screening Market, by End Use, 2019-2032 (USD Million)
- 8.6.3. Middle East & Africa: Security Screening Market, by Application, 2019-2032 (USD Million)
- 8.6.4. Security Screening Market - Saudi Arabia
- 8.6.4.1. Saudi Arabia: Security Screening Market, by Technology, 2019-2032 (USD Million)
- 8.6.4.2. Saudi Arabia.: Security Screening Market, by End Use, 2019-2032 (USD Million)
- 8.6.4.3. Saudi Arabia: Security Screening Market, by Application, 2019-2032 (USD Million)
- 8.6.5. Security Screening Market - UAE
- 8.6.5.1. UAE: Security Screening Market, by Technology, 2019-2032 (USD Million)
- 8.6.5.2. UAE.: Security Screening Market, by End Use, 2019-2032 (USD Million)
- 8.6.5.3. UAE: Security Screening Market, by Application, 2019-2032 (USD Million)
- 8.6.6. Security Screening Market - Israel
- 8.6.6.1. Israel: Security Screening Market, by Technology, 2019-2032 (USD Million)
- 8.6.6.2. Israel.: Security Screening Market, by End Use, 2019-2032 (USD Million)
- 8.6.6.3. Israel: Security Screening Market, by Application, 2019-2032 (USD Million)
- 8.6.7. Security Screening Market - South Africa
- 8.6.7.1. South Africa: Security Screening Market, by Technology, 2019-2032 (USD Million)
- 8.6.7.2. South Africa.: Security Screening Market, by End Use, 2019-2032 (USD Million)
- 8.6.7.3. South Africa: Security Screening Market, by Application, 2019-2032 (USD Million)
- 8.7. Security Screening Market - Latin America
- 8.7.1. Latin America: Security Screening Market, by Technology, 2019-2032 (USD Million)
- 8.7.2. Latin America.: Security Screening Market, by End Use, 2019-2032 (USD Million)
- 8.7.3. Latin America: Security Screening Market, by Application, 2019-2032 (USD Million)
- 8.7.4. Security Screening Market - Mexico
- 8.7.4.1. Mexico: Security Screening Market, by Technology, 2019-2032 (USD Million)
- 8.7.4.2. Mexico.: Security Screening Market, by End Use, 2019-2032 (USD Million)
- 8.7.4.3. Mexico: Security Screening Market, by Application, 2019-2032 (USD Million)
- 8.7.5. Security Screening Market - Brazil
- 8.7.5.1. Brazil: Security Screening Market, by Technology, 2019-2032 (USD Million)
- 8.7.5.2. Brazil.: Security Screening Market, by End Use, 2019-2032 (USD Million)
- 8.7.5.3. Brazil: Security Screening Market, by Application, 2019-2032 (USD Million)
- 8.7.6. Security Screening Market - Argentina
- 8.7.6.1. Argentina: Security Screening Market, by Technology, 2019-2032 (USD Million)
- 8.7.6.2. Argentina.: Security Screening Market, by End Use, 2019-2032 (USD Million)
- 8.7.6.3. Argentina: Security Screening Market, by Application, 2019-2032 (USD Million)
9. Competitive Landscape
- 9.1. Expansion and Acquisition Analysis
- 9.1.1. Expansion
- 9.1.2. Acquisitions
- 9.2. Partnerships/Collaborations/Agreements/Exhibitions
10. Company Profiles
- 10.1. Analogic Corporation
- 10.1.1. Company Overview
- 10.1.2. Financial Performance
- 10.1.3. Product Benchmarking
- 10.1.4. Recent Development
- 10.2. Astrophysics Inc.
- 10.2.1. Company Overview
- 10.2.2. Financial Performance
- 10.2.3. Product Benchmarking
- 10.2.4. Recent Development
- 10.3. Autoclear LLC
- 10.3.1. Company Overview
- 10.3.2. Financial Performance
- 10.3.3. Product Benchmarking
- 10.3.4. Recent Development
- 10.4. CEIA S.p.A.
- 10.4.1. Company Overview
- 10.4.2. Financial Performance
- 10.4.3. Product Benchmarking
- 10.4.4. Recent Development
- 10.5. Garrett Metal Detectors
- 10.5.1. Company Overview
- 10.5.2. Financial Performance
- 10.5.3. Product Benchmarking
- 10.5.4. Recent Development
- 10.6. Gilardoni S.p.A.
- 10.6.1. Company Overview
- 10.6.2. Financial Performance
- 10.6.3. Product Benchmarking
- 10.6.4. Recent Development
- 10.7. Honeywell International Inc.
- 10.7.1. Company Overview
- 10.7.2. Financial Performance
- 10.7.3. Product Benchmarking
- 10.7.4. Recent Development
- 10.8. Leidos Holdings, Inc.
- 10.8.1. Company Overview
- 10.8.2. Financial Performance
- 10.8.3. Product Benchmarking
- 10.8.4. Recent Development
- 10.9. NEC Corporation
- 10.9.1. Company Overview
- 10.9.2. Financial Performance
- 10.9.3. Product Benchmarking
- 10.9.4. Recent Development
- 10.10. Nuctech Company Limited
- 10.10.1. Company Overview
- 10.10.2. Financial Performance
- 10.10.3. Product Benchmarking
- 10.10.4. Recent Development
- 10.11. OSI Systems, Inc.
- 10.11.1. Company Overview
- 10.11.2. Financial Performance
- 10.11.3. Product Benchmarking
- 10.11.4. Recent Development
- 10.12. Raytheon Company
- 10.12.1. Company Overview
- 10.12.2. Financial Performance
- 10.12.3. Product Benchmarking
- 10.12.4. Recent Development
- 10.13. Smiths Group plc
- 10.13.1. Company Overview
- 10.13.2. Financial Performance
- 10.13.3. Product Benchmarking
- 10.13.4. Recent Development
- 10.14. Thales
- 10.14.1. Company Overview
- 10.14.2. Financial Performance
- 10.14.3. Product Benchmarking
- 10.14.4. Recent Development
- 10.15. Vanderlande Industries
- 10.15.1. Company Overview
- 10.15.2. Financial Performance
- 10.15.3. Product Benchmarking
- 10.15.4. Recent Development

