|
|
市場調査レポート
商品コード
1175533
プロテインバーの世界市場-シェア、規模、動向、業界分析:供給源別(植物ベース、動物ベース)、タイプ別、地域別;セグメント別予測(2022年~2030年)Protein Bar Market Share, Size, Trends, Industry Analysis Report, By Source (Plant-Based, Animal-Based), By Type, By Region, Segment Forecast, 2022-2030 |
||||||
|
|
|||||||
|
● お客様のご希望に応じて、既存データの加工や未掲載情報(例:国別セグメント)の追加などの対応が可能です。 詳細はお問い合わせください。 |
|||||||


| プロテインバーの世界市場-シェア、規模、動向、業界分析:供給源別(植物ベース、動物ベース)、タイプ別、地域別;セグメント別予測(2022年~2030年) |
|
出版日: 2022年11月01日
発行: Polaris Market Research
ページ情報: 英文 118 Pages
納期: 即日から翌営業日
|
- 全表示
- 概要
- 図表
- 目次
世界のプロテインバーの市場規模は、2030年までに76億6,000万米ドルに達する見込みです。
当レポートでは、世界のプロテインバー市場について調査しており、市場の洞察、市場分析、競合情勢、企業プロファイルなど、包括的な情報を提供しています。
目次
第1章 イントロダクション
- レポートの説明
- 調査の目的
- 市場範囲
- 仮定
- 利害関係者
第2章 エグゼクティブサマリー
- 市場のハイライト
第3章 調査手法
- 概要
- データマイニング
- データソース
- 一次情報
- 二次情報
第4章 世界のプロテインバー市場の洞察
- プロテインバー市場-業界のスナップショット
- プロテインバー市場力学
- 促進要因と機会
- 抑制要因と課題
- ポーターのファイブフォース分析
- 供給企業の交渉力(中程度)
- 新規参入者の脅威(低)
- 買い手の交渉力(中程度)
- 代替品の脅威(中程度)
- 既存企業間の競争力(高)
- PESTLE分析
- プロテインバー業界の動向
- バリューチェーン分析
- COVID-19影響分析
第5章 世界のプロテインバー市場:タイプ別
- 主な調査結果
- イントロダクション
- 世界のプロテインバー(10億米ドル)(2018年~2030年):タイプ別
- スポーツ栄養バー
- 世界のプロテインバー市場(10億米ドル)(2018年~2030年):スポーツ栄養バー別:地域別
- 食事代替バー
- 世界のプロテインバー市場(10億米ドル)(2018年~2030年):食事代替バー別:地域別
- その他
- 世界のプロテインバー市場(10億米ドル)(2018年~2030年):その他別:地域別
第6章 世界のプロテインバー市場:供給源別
- 主な調査結果
- イントロダクション
- 世界のプロテインバー市場(10億米ドル)(2018年~2030年):供給源別
- 植物ベース
- 世界のプロテインバー市場(10億米ドル)(2018年~2030年):植物ベース別:地域別
- 動物ベース
- 世界のプロテインバー市場(10億米ドル)(2018年~2030年):動物ベース別:地域別
第7章 世界のプロテインバー市場:地域別
- 主な調査結果
- イントロダクション
- プロテインバー市場の評価(10億米ドル)(2018年~2030年):地域別
- プロテインバー市場-北米
- プロテインバー市場-欧州
- プロテインバー市場-アジア太平洋
- プロテインバー市場-中東およびアフリカ
- プロテインバー市場-ラテンアメリカ
第8章 競合情勢
- 拡大と買収の分析
- 拡大
- 買収
- パートナーシップ/コラボレーション/協定/展示会
第9章 企業プロファイル
- General Mills
- Simply Good Foods
- Caveman Foods
- Kellogg Company
- Nestle
- Clif Bar & Company
- Glanbia
- GNC Holdings
- Mars Incorporated
- Hormel Foods
- Mondelez International
- Premier Nutrition
- Amway
- Bountiful Company
- NuGo Nutrition
- Orgain
List of Tables
- Table 1 Global Protein Bar Market, by Source, 2018 - 2030 (USD Billion)
- Table 2 Global Protein Bar Market, by Type, 2018 - 2030 (USD Billion)
- Table 3 Protein Bar Market Assessment, By Geography, 2018 - 2030 (USD Billion)
- Table 4 North America: Protein Bar Market, by Source, 2018 - 2030 (USD Billion)
- Table 5 North America: Protein Bar Market, by Type, 2018 - 2030 (USD Billion)
- Table 6 U.S.: Protein Bar Market, by Source, 2018 - 2030 (USD Billion)
- Table 7 U.S.: Protein Bar Market, by Type, 2018 - 2030 (USD Billion)
- Table 8 Canada: Protein Bar Market, by Source, 2018 - 2030 (USD Billion)
- Table 9 Canada: Protein Bar Market, by Type, 2018 - 2030 (USD Billion)
- Table 10 Europe: Protein Bar Market, by Source, 2018 - 2030 (USD Billion)
- Table 11 Europe: Protein Bar Market, by Type, 2018 - 2030 (USD Billion)
- Table 12 UK: Protein Bar Market, by Source, 2018 - 2030 (USD Billion)
- Table 13 UK: Protein Bar Market, by Type, 2018 - 2030 (USD Billion)
- Table 14 France: Protein Bar Market, by Source, 2018 - 2030 (USD Billion)
- Table 15 France: Protein Bar Market, by Type, 2018 - 2030 (USD Billion)
- Table 16 Germany: Protein Bar Market, by Source, 2018 - 2030 (USD Billion)
- Table 17 Germany: Protein Bar Market, by Type, 2018 - 2030 (USD Billion)
- Table 18 Italy: Protein Bar Market, by Source, 2018 - 2030 (USD Billion)
- Table 19 Italy: Protein Bar Market, by Type, 2018 - 2030 (USD Billion)
- Table 20 Spain: Protein Bar Market, by Source, 2018 - 2030 (USD Billion)
- Table 21 Spain: Protein Bar Market, by Type, 2018 - 2030 (USD Billion)
- Table 22 Netherlands: Protein Bar Market, by Source, 2018 - 2030 (USD Billion)
- Table 23 Netherlands: Protein Bar Market, by Type, 2018 - 2030 (USD Billion)
- Table 24 Russia: Protein Bar Market, by Source, 2018 - 2030 (USD Billion)
- Table 25 Russia: Protein Bar Market, by Type, 2018 - 2030 (USD Billion)
- Table 26 Asia Pacific: Protein Bar Market, by Source, 2018 - 2030 (USD Billion)
- Table 27 Asia Pacific: Protein Bar Market, by Type, 2018 - 2030 (USD Billion)
- Table 28 China: Protein Bar Market, by Source, 2018 - 2030 (USD Billion)
- Table 29 China: Protein Bar Market, by Type, 2018 - 2030 (USD Billion)
- Table 30 India: Protein Bar Market, by Source, 2018 - 2030 (USD Billion)
- Table 31 India: Protein Bar Market, by Type, 2018 - 2030 (USD Billion)
- Table 32 Malaysia: Protein Bar Market, by Source, 2018 - 2030 (USD Billion)
- Table 33 Malaysia: Protein Bar Market, by Type, 2018 - 2030 (USD Billion)
- Table 34 Japan: Protein Bar Market, by Source, 2018 - 2030 (USD Billion)
- Table 35 Japan: Protein Bar Market, by Type, 2018 - 2030 (USD Billion)
- Table 36 Indonesia: Protein Bar Market, by Source, 2018 - 2030 (USD Billion)
- Table 37 Indonesia: Protein Bar Market, by Type, 2018 - 2030 (USD Billion)
- Table 38 South Korea: Protein Bar Market, by Source, 2018 - 2030 (USD Billion)
- Table 39 South Korea: Protein Bar Market, by Type, 2018 - 2030 (USD Billion)
- Table 40 Middle East & Africa: Protein Bar Market, by Source, 2018 - 2030 (USD Billion)
- Table 41 Middle East & Africa: Protein Bar Market, by Type, 2018 - 2030 (USD Billion)
- Table 42 Saudi Arabia: Protein Bar Market, by Source, 2018 - 2030 (USD Billion)
- Table 43 Saudi Arabia: Protein Bar Market, by Type, 2018 - 2030 (USD Billion)
- Table 44 UAE: Protein Bar Market, by Source, 2018 - 2030 (USD Billion)
- Table 45 UAE: Protein Bar Market, by Type, 2018 - 2030 (USD Billion)
- Table 46 Israel: Protein Bar Market, by Source, 2018 - 2030 (USD Billion)
- Table 47 Israel: Protein Bar Market, by Type, 2018 - 2030 (USD Billion)
- Table 48 South Africa: Protein Bar Market, by Source, 2018 - 2030 (USD Billion)
- Table 49 South Africa: Protein Bar Market, by Type, 2018 - 2030 (USD Billion)
- Table 50 Latin America: Protein Bar Market, by Source, 2018 - 2030 (USD Billion)
- Table 51 Latin America: Protein Bar Market, by Type, 2018 - 2030 (USD Billion)
- Table 52 Mexico: Protein Bar Market, by Source, 2018 - 2030 (USD Billion)
- Table 53 Mexico: Protein Bar Market, by Type, 2018 - 2030 (USD Billion)
- Table 54 Brazil: Protein Bar Market, by Source, 2018 - 2030 (USD Billion)
- Table 55 Brazil: Protein Bar Market, by Type, 2018 - 2030 (USD Billion)
- Table 56 Argentina: Protein Bar Market, by Source, 2018 - 2030 (USD Billion)
- Table 57 Argentina: Protein Bar Market, by Type, 2018 - 2030 (USD Billion)
List of Figures
Figure 1 Global Protein Bar Market, 2018 - 2030 (USD Billion)
Figure 2 Integrated Ecosystem
Figure 3 Research Methodology: Top-Down & Bottom-Up Approach
Figure 4 Market by Geography
Figure 5 Porter's Five Forces
Figure 6 Market by Source
Figure 7 Global Protein Bar Market, by Source, 2021 & 2030 (USD Billion)
Figure 8 Market by Type
Figure 9 Global Protein Bar Market, by Type, 2021 & 2030 (USD Billion)
Figure 10 Protein Bar Market Assessment, By Geography, 2018 - 2030 (USD Billion)
Figure 11 Strategic Analysis - Protein Bar Market
The global protein bar market size is expected to reach USD 7.66 billion by 2030, according to a new study by Polaris Market Research. The report "Protein Bar Market Share, Size, Trends, Industry Analysis Report, By Source (Plant-Based, Animal-Based); By Type; By Region; Segment Forecast, 2022-2030" gives a detailed insight into current market dynamics and provides analysis on future market growth.
The rise in the number of customers who are health-conscious, the rise in the knowledge of the advantages of nutrition bars, the entry of new market participants, and the expansion of the digital marketing trend are the main factors driving market growth.
Additionally, the sale of nutrition bars worldwide is projected to experience a consistent rise in the future years as more and more sports figures and social media influencers continue to endorse them. During the projected period, this is anticipated to drive the market for nutrition bars.
Dates, dried fruit, nuts, seeds, and whole grains like quinoa and oats are the main ingredients of protein bars, which are nutritional bars. It is a good source of protein, carbs, lipids, vitamins, minerals, and other necessary nutrients. Its frequent use has a number of health advantages, including increasing energy, promoting weight control, strengthening bones and muscles, and lowering blood sugar levels.
According to the WHO, people can reduce their risk of developing heart disease, stroke, diabetes, and cancer by changing their eating habits, exercising more, and quitting smoking. They can also prevent up to 40% of instances of cancer. Such statements from the most influential institutions motivate people to alter their routines. As a result, more individuals are engaging in regular exercise.
The use of vegan protein bars is rising as a result of this. For instance, Nestle introduced a pea energy bar in 2020 as part of a new line of YES snack bars. This snack bar is made out of almonds and peas and has 10g of protein. These snacks come in various flavors, including Cashew, Blueberry, and Dark Chocolate and Almond, Peanut, and Double Dark Chocolate.
Growing usage of sports beverages as refreshment drinks, as a new marketing trend, and products offering sustainable energy advantages, and constantly shifting flavor trends. During the COVID-19 lockdown, more snacks, bars, and other quick meals were available, supporting the market's demand. Customers were compelled to boost their nutritional intake and eat safer, healthier meals as a result of the uncertain scenario across the world as their interest in products that promote the general maintenance of health and wellness increased. The demand for energy bars increased as more people started working from home or spent more time at home.
Protein Bar Market Report Highlights
Plant-based protein bars are anticipated to rule the industry in 2021. Demand for the product, which delivers better results than other types of bars, is driven up by the rising number of health and fitness club members who are obsessed with maintaining their physical health.
Sports nutrition bars are anticipated to dominate the market in 2021. Proteins are anticipated to grow in popularity as a component of a healthy diet due to their many practical benefits, including better nutritional content, immune system support, and weight control.
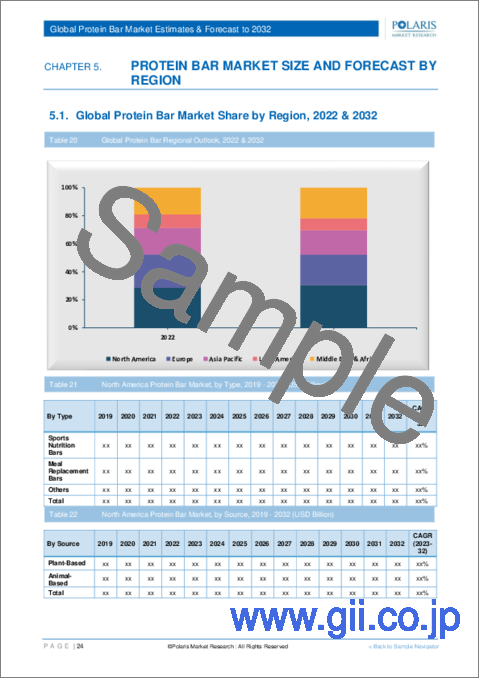
North America dominates the global market growth owing to the rise in fitness enthusiasts and the number of gyms, fitness training facilities, and health clubs in North America.
The global players with a global presence include General Mills, Simply Good Foods, Caveman Foods LLC, Kellogg Company and others.
Polaris Market Research has segmented the protein bar market report based on source, type, and region:
Protein Bar, Source Outlook (Revenue - USD Billion, 2018 - 2030)
Plant-Based
Animal-Based
Protein Bar, Type Outlook (Revenue - USD Billion, 2018 - 2030)
Sports Nutrition Bars
Meal Replacement Bars
Others
Protein Bar, Regional Outlook (Revenue - USD Billion, 2018 - 2030)
North America
U.S
Canada
Europe
Germany
UK
France
Italy
Spain
Russia
Netherlands
Asia Pacific
China
India
Japan
South Korea
Indonesia
Malaysia
Latin America
Argentina
Brazil
Mexico
Middle East & Africa
UAE
Saudi Arabia
Israel
South Africa
Table of Contents
1. Introduction
- 1.1. Report Description
- 1.1.1. Objectives of the Study
- 1.1.2. Market Scope
- 1.1.3. Assumptions
- 1.2. Stakeholders
2. Executive Summary
- 2.1. Market Highlights
3. Research Methodology
- 3.1. Overview
- 3.1.1. Data Mining
- 3.2. Data Sources
- 3.2.1. Primary Sources
- 3.2.2. Secondary Sources
4. Global Protein Bar Market Insights
- 4.1. Protein Bar Market - Industry Snapshot
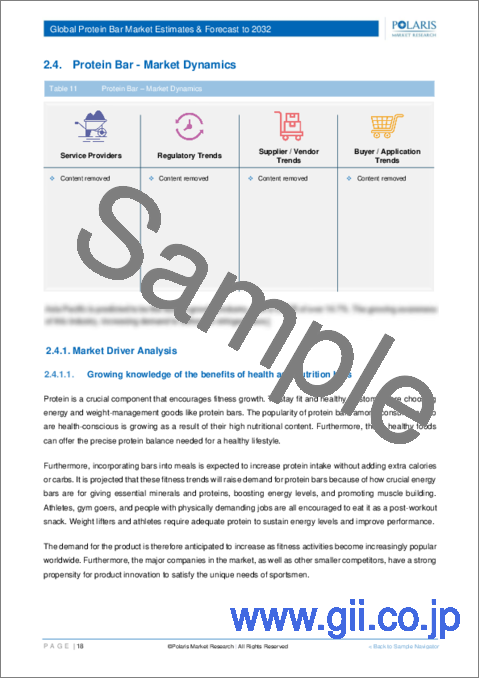
- 4.2. Protein Bar Market Dynamics
- 4.2.1. Drivers and Opportunities
- 4.2.1.1. Growing knowledge of the benefits of health and nutrition bars
- 4.2.1.2. Increase as fitness activities
- 4.2.2. Restraints and Challenges
- 4.2.2.1. Fluctuation of raw material prices
- 4.2.1. Drivers and Opportunities
- 4.3. Porter's Five Forces Analysis
- 4.3.1. Bargaining Power of Suppliers (Moderate)
- 4.3.2. Threats of New Entrants: (Low)
- 4.3.3. Bargaining Power of Buyers (Moderate)
- 4.3.4. Threat of Substitute (Moderate)
- 4.3.5. Rivalry among existing firms (High)
- 4.4. PESTLE Analysis
- 4.5. Protein Bar Industry trends
- 4.6. Value Chain Analysis
- 4.7. COVID-19 Impact Analysis
5. Global Protein Bar Market, by Type
- 5.1. Key Findings
- 5.2. Introduction
- 5.2.1. Global Protein Bar, by Type, 2018 - 2030 (USD Billion)
- 5.3. Sports Nutrition Bars
- 5.3.1. Global Protein Bar Market, by Sports Nutrition Bars, by Region, 2018 - 2030 (USD Billion)
- 5.4. Meal Replacement Bars
- 5.4.1. Global Protein Bar Market, by Meal Replacement Bars, by Region, 2018 - 2030 (USD Billion)
- 5.5. Others
- 5.5.1. Global Protein Bar Market, by Others, by Region, 2018 - 2030 (USD Billion)
6. Global Protein Bar Market, by Source
- 6.1. Key Findings
- 6.2. Introduction
- 6.2.1. Global Protein Bar Market, by Source, 2018 - 2030 (USD Billion)
- 6.3. Plant-Based
- 6.3.1. Global Protein Bar Market, by Plant-Based, by Region, 2018 - 2030 (USD Billion)
- 6.4. Animal-Based
- 6.4.1. Global Protein Bar Market, by Animal-Based, by Region, 2018 - 2030 (USD Billion)
7. Global Protein Bar Market, by Geography
- 7.1. Key findings
- 7.2. Introduction
- 7.2.1. Protein Bar Market Assessment, By Geography, 2018 - 2030 (USD Billion)
- 7.3. Protein Bar Market - North America
- 7.3.1. North America: Protein Bar Market, by Source, 2018 - 2030 (USD Billion)
- 7.3.2. North America: Protein Bar Market, by Type, 2018 - 2030 (USD Billion)
- 7.3.3. Protein Bar Market - U.S.
- 7.3.3.1. U.S.: Protein Bar Market, by Source, 2018 - 2030 (USD Billion)
- 7.3.3.2. U.S.: Protein Bar Market, by Type, 2018 - 2030 (USD Billion)
- 7.3.4. Protein Bar Market - Canada
- 7.3.4.1. Canada: Protein Bar Market, by Source, 2018 - 2030 (USD Billion)
- 7.3.4.2. Canada: Protein Bar Market, by Type, 2018 - 2030 (USD Billion)
- 7.4. Protein Bar Market - Europe
- 7.4.1. Europe: Protein Bar Market, by Source, 2018 - 2030 (USD Billion)
- 7.4.2. Europe: Protein Bar Market, by Type, 2018 - 2030 (USD Billion)
- 7.4.3. Protein Bar Market - UK
- 7.4.3.1. UK: Protein Bar Market, by Source, 2018 - 2030 (USD Billion)
- 7.4.3.2. UK: Protein Bar Market, by Type, 2018 - 2030 (USD Billion)
- 7.4.4. Protein Bar Market - France
- 7.4.4.1. France: Protein Bar Market, by Source, 2018 - 2030 (USD Billion)
- 7.4.4.2. France: Protein Bar Market, by Type, 2018 - 2030 (USD Billion)
- 7.4.5. Protein Bar Market - Germany
- 7.4.5.1. Germany: Protein Bar Market, by Source, 2018 - 2030 (USD Billion)
- 7.4.5.2. Germany: Protein Bar Market, by Type, 2018 - 2030 (USD Billion)
- 7.4.6. Protein Bar Market - Italy
- 7.4.6.1. Italy: Protein Bar Market, by Source, 2018 - 2030 (USD Billion)
- 7.4.6.2. Italy: Protein Bar Market, by Type, 2018 - 2030 (USD Billion)
- 7.4.7. Protein Bar Market - Spain
- 7.4.7.1. Spain: Protein Bar Market, by Source, 2018 - 2030 (USD Billion)
- 7.4.7.2. Spain: Protein Bar Market, by Type, 2018 - 2030 (USD Billion)
- 7.4.8. Protein Bar Market - Netherlands
- 7.4.8.1. Netherlands: Protein Bar Market, by Source, 2018 - 2030 (USD Billion)
- 7.4.8.2. Netherlands: Protein Bar Market, by Type, 2018 - 2030 (USD Billion)
- 7.4.9. Protein Bar Market - Russia
- 7.4.9.1. Russia: Protein Bar Market, by Source, 2018 - 2030 (USD Billion)
- 7.4.9.2. Russia: Protein Bar Market, by Type, 2018 - 2030 (USD Billion)
- 7.5. Protein Bar Market - Asia Pacific
- 7.5.1. Asia Pacific: Protein Bar Market, by Source, 2018 - 2030 (USD Billion)
- 7.5.2. Asia Pacific: Protein Bar Market, by Type, 2018 - 2030 (USD Billion)
- 7.5.3. Protein Bar Market - China
- 7.5.3.1. China: Protein Bar Market, by Source, 2018 - 2030 (USD Billion)
- 7.5.3.2. China: Protein Bar Market, by Type, 2018 - 2030 (USD Billion)
- 7.5.4. Protein Bar Market - India
- 7.5.4.1. India: Protein Bar Market, by Source, 2018 - 2030 (USD Billion)
- 7.5.4.2. India: Protein Bar Market, by Type, 2018 - 2030 (USD Billion)
- 7.5.5. Protein Bar Market - Malaysia
- 7.5.5.1. Malaysia: Protein Bar Market, by Source, 2018 - 2030 (USD Billion)
- 7.5.5.2. Malaysia: Protein Bar Market, by Type, 2018 - 2030 (USD Billion)
- 7.5.6. Protein Bar Market - Japan
- 7.5.6.1. Japan: Protein Bar Market, by Source, 2018 - 2030 (USD Billion)
- 7.5.6.2. Japan: Protein Bar Market, by Type, 2018 - 2030 (USD Billion)
- 7.5.7. Protein Bar Market - Indonesia
- 7.5.7.1. Indonesia: Protein Bar Market, by Source, 2018 - 2030 (USD Billion)
- 7.5.7.2. Indonesia: Protein Bar Market, by Type, 2018 - 2030 (USD Billion)
- 7.5.8. Protein Bar Market - South Korea
- 7.5.8.1. South Korea: Protein Bar Market, by Source, 2018 - 2030 (USD Billion)
- 7.5.8.2. South Korea: Protein Bar Market, by Type, 2018 - 2030 (USD Billion)
- 7.6. Protein Bar Market - Middle East & Africa
- 7.6.1. Middle East & Africa: Protein Bar Market, by Source, 2018 - 2030 (USD Billion)
- 7.6.2. Middle East & Africa: Protein Bar Market, by Type, 2018 - 2030 (USD Billion)
- 7.6.3. Protein Bar Market - Saudi Arabia
- 7.6.3.1. Saudi Arabia: Protein Bar Market, by Source, 2018 - 2030 (USD Billion)
- 7.6.3.2. Saudi Arabia: Protein Bar Market, by Type, 2018 - 2030 (USD Billion)
- 7.6.4. Protein Bar Market - UAE
- 7.6.4.1. UAE: Protein Bar Market, by Source, 2018 - 2030 (USD Billion)
- 7.6.4.2. UAE: Protein Bar Market, by Type, 2018 - 2030 (USD Billion)
- 7.6.5. Protein Bar Market - Israel
- 7.6.5.1. Israel: Protein Bar Market, by Source, 2018 - 2030 (USD Billion)
- 7.6.5.2. Israel: Protein Bar Market, by Type, 2018 - 2030 (USD Billion)
- 7.6.6. Protein Bar Market - South Africa
- 7.6.6.1. South Africa: Protein Bar Market, by Source, 2018 - 2030 (USD Billion)
- 7.6.6.2. South Africa: Protein Bar Market, by Type, 2018 - 2030 (USD Billion)
- 7.7. Protein Bar Market - Latin America
- 7.7.1. Latin America: Protein Bar Market, by Source, 2018 - 2030 (USD Billion)
- 7.7.2. Latin America: Protein Bar Market, by Type, 2018 - 2030 (USD Billion)
- 7.7.3. Protein Bar Market - Mexico
- 7.7.3.1. Mexico: Protein Bar Market, by Source, 2018 - 2030 (USD Billion)
- 7.7.3.2. Mexico: Protein Bar Market, by Type, 2018 - 2030 (USD Billion)
- 7.7.4. Protein Bar Market - Brazil
- 7.7.4.1. Brazil: Protein Bar Market, by Source, 2018 - 2030 (USD Billion)
- 7.7.4.2. Brazil: Protein Bar Market, by Type, 2018 - 2030 (USD Billion)
- 7.7.5. Protein Bar Market - Argentina
- 7.7.5.1. Argentina: Protein Bar Market, by Source, 2018 - 2030 (USD Billion)
- 7.7.5.2. Argentina: Protein Bar Market, by Type, 2018 - 2030 (USD Billion)
8. Competitive Landscape
- 8.1. Expansion and Acquisition Analysis
- 8.1.1. Expansion
- 8.1.2. Acquisitions
- 8.2. Partnerships/Collaborations/Agreements/Exhibitions
9. Company Profiles
- 9.1. General Mills
- 9.1.1. Company Overview
- 9.1.2. Financial Performance
- 9.1.3. Product Benchmarking
- 9.1.4. Recent Development
- 9.2. Simply Good Foods
- 9.2.1. Company Overview
- 9.2.2. Financial Performance
- 9.2.3. Product Benchmarking
- 9.2.4. Recent Development
- 9.3. Caveman Foods
- 9.3.1. Company Overview
- 9.3.2. Financial Performance
- 9.3.3. Product Benchmarking
- 9.3.4. Recent Development
- 9.4. Kellogg Company
- 9.4.1. Company Overview
- 9.4.2. Financial Performance
- 9.4.3. Product Benchmarking
- 9.4.4. Recent Development
- 9.5. Nestle
- 9.5.1. Company Overview
- 9.5.2. Financial Performance
- 9.5.3. Product Benchmarking
- 9.5.4. Recent Development
- 9.6. Clif Bar & Company
- 9.6.1. Company Overview
- 9.6.2. Financial Performance
- 9.6.3. Product Benchmarking
- 9.6.4. Recent Development
- 9.7. Glanbia
- 9.7.1. Company Overview
- 9.7.2. Financial Performance
- 9.7.3. Product Benchmarking
- 9.7.4. Recent Development
- 9.8. GNC Holdings
- 9.8.1. Company Overview
- 9.8.2. Financial Performance
- 9.8.3. Product Benchmarking
- 9.8.4. Recent Development
- 9.9. Mars Incorporated
- 9.9.1. Company Overview
- 9.9.2. Financial Performance
- 9.9.3. Product Benchmarking
- 9.9.4. Recent Development
- 9.10. Hormel Foods
- 9.10.1. Company Overview
- 9.10.2. Financial Performance
- 9.10.3. Product Benchmarking
- 9.10.4. Recent Development
- 9.11. Mondelez International
- 9.11.1. Company Overview
- 9.11.2. Financial Performance
- 9.11.3. Product Benchmarking
- 9.11.4. Recent Development
- 9.12. Premier Nutrition
- 9.12.1. Company Overview
- 9.12.2. Financial Performance
- 9.12.3. Product Benchmarking
- 9.12.4. Recent Development
- 9.13. Amway
- 9.13.1. Company Overview
- 9.13.2. Financial Performance
- 9.13.3. Product Benchmarking
- 9.13.4. Recent Development
- 9.14. Bountiful Company
- 9.14.1. Company Overview
- 9.14.2. Financial Performance
- 9.14.3. Product Benchmarking
- 9.14.4. Recent Development
- 9.15. NuGo Nutrition
- 9.15.1. Company Overview
- 9.15.2. Financial Performance
- 9.15.3. Product Benchmarking
- 9.15.4. Recent Development
- 9.16. Orgain
- 9.16.1. Company Overview
- 9.16.2. Financial Performance
- 9.16.3. Product Benchmarking
- 9.16.4. Recent Development