|
|
市場調査レポート
商品コード
1513649
グルコース管理サプリメント市場:世界の産業分析、規模、シェア、成長、動向、予測、2024年~2033年Glucose Management Supplements Market: Global Industry Analysis, Size, Share, Growth, Trends, and Forecast, 2024-2033 |
||||||
|
|
|||||||
カスタマイズ可能
|
|||||||


| グルコース管理サプリメント市場:世界の産業分析、規模、シェア、成長、動向、予測、2024年~2033年 |
|
出版日: 2024年07月08日
発行: Persistence Market Research
ページ情報: 英文 250 Pages
納期: 2~5営業日
|

- 全表示
- 概要
- 目次
Persistence Market Research社はこのほど、世界のグルコース管理サプリメント市場に関する包括的なレポートを発表しました。当レポートでは、市場促進要因・動向・機会・課題を含む重要な市場ダイナミクスを徹底的に評価し、市場構造に関する詳細な洞察を提供しています。
主な洞察
- グルコース管理サプリメントの市場規模(2024年):97億米ドル
- 予測市場価値(2033年):160億米ドル
- 世界市場成長率(CAGR 2024年~2033年):6.4%
グルコース管理サプリメント市場 - 調査範囲:
グルコース管理サプリメントは、血糖値を調整し、糖尿病や関連疾患を予防・管理する上で重要な役割を果たしています。これらのサプリメントには、ベルベリン、シナモンエキス、クロム、α-リポ酸など、グルコース低下作用で知られる天然成分が含まれていることが多いです。グルコース管理サプリメント市場は、糖尿病予備軍、2型糖尿病患者、予防的健康対策を求める人々など、幅広い消費者を対象としています。
市場成長の促進要因:
世界のグルコース管理サプリメント市場は、血糖調節の重要性に対する意識の高まりや、世界の糖尿病有病率の上昇など、いくつかの主要な要因によって推進されています。また、予防ヘルスケア対策の採用拡大や、天然サプリメントや栄養補助食品に関する情報の入手可能性の増加も、市場拡大の原動力となっています。さらに、血糖値管理の問題を抱えやすい人口の高齢化や、代謝異常の発生率の上昇につながるライフスタイルの変化が、市場の成長をさらに刺激しています。
市場抑制要因:
有望な成長見通しにもかかわらず、グルコース管理サプリメント市場は、規制遵守、科学的検証、サプリメントの有効性に対する消費者の懐疑心に関連する課題に直面しています。栄養補助食品の販売と使用を管理する厳しい規制は、メーカーにコンプライアンス上の負担を課し、市場参入の障壁と運営コストに影響を与えます。さらに、一部のサプリメントの効能を裏付ける包括的な臨床エビデンスがないことや、高品質の製品が高価であることが、特にヘルスケア予算に制約のある新興経済国において、市場浸透の課題となっています。
市場機会:
グルコース管理サプリメント市場は、技術革新、ヘルスケア意識の高まり、オンライン小売プラットフォームの拡大により、大きな成長機会をもたらしています。血糖値モニタリング用モバイルヘルスアプリや個別化サプリメント推奨などのデジタルヘルス技術の統合は、消費者の関与とアドヒアランスを高める。さらに、戦略的パートナーシップ、研究開発への投資、ユーザーフレンドリーで費用対効果の高いサプリメント製剤の導入は、新たな機会を活用し、ダイナミックなグルコース管理状況において市場でのリーダーシップを維持するために不可欠です。
本レポートで扱う主な質問
- グルコース管理サプリメント市場の世界的成長を促進する主な要因は何か?
- 異なる消費者層でどのサプリメントの種類と成分が採用を促進しているか?
- 技術の進歩はどのようにグルコース管理サプリメント市場の競合情勢を再構築しているか?
- グルコース管理サプリメント市場に貢献している主要企業はどこで、また市場の関連性を維持するためにどのような戦略を採用しているか?
- 世界のグルコース管理サプリメント市場の新たな動向と将来性は?
目次
第1章 エグゼクティブサマリー
第2章 市場概要
- 市場範囲/ 分類
- 市場の定義/ 範囲/ 制限
第3章 市場背景
- 市場力学
- シナリオ予測
- 機会マップ分析
- 投資実現可能性マトリックス
- PESTLEとポーター分析
- 規制状況
- 地域別親市場見通し
第4章 世界のグルコース管理サプリメント市場分析
- 過去の市場規模分析(2019年~2023年)
- 現在および将来の市場規模予測(2024年~2033年)
- 前年比成長動向分析
- 絶対額の機会分析
第5章 世界のグルコース管理サプリメント市場分析:タイプ別
- イントロダクション/主な調査結果
- 過去の市場規模分析:タイプ別(2019年~2023年)
- 現在および将来の市場規模分析と予測:タイプ別(2024年~2033年)
- アルファリポ酸
- 鉱物
- ビタミン
- その他
- タイプ別の前年比成長動向分析(2019年~2023年)
- タイプ別の絶対額の機会分析(2024年~2033年)
第6章 世界のグルコース管理サプリメント市場分析:形態別
- イントロダクション/主な調査結果
- 過去の市場規模分析:形態別(2019年~2023年)
- 現在および将来の市場規模分析と予測:形態別(2024年~2033年)
- カプセル
- ソフトジェル
- タブレット
- 形態別の前年比成長動向分析(2019年~2023年)
- 形態別の絶対額の機会分析(2024年~2033年)
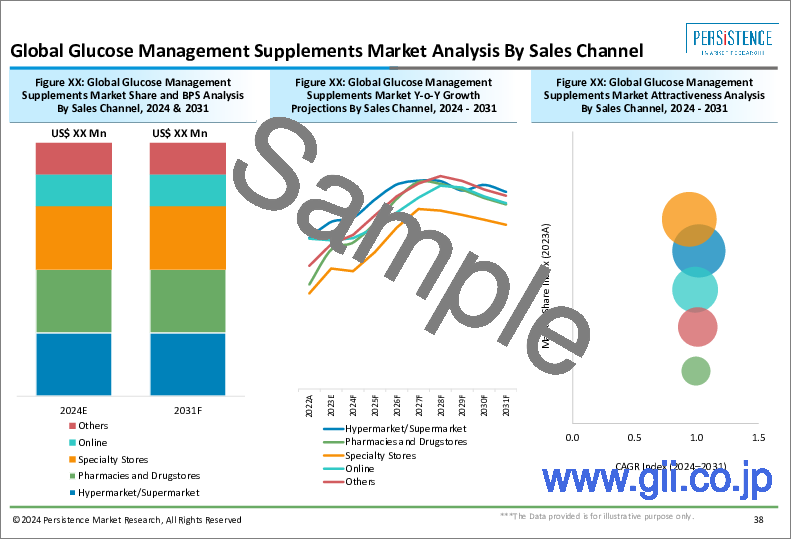
第7章 世界のグルコース管理サプリメント市場分析:販売チャネル別
- イントロダクション/主な調査結果
- 過去の市場規模分析:販売チャネル別(2019年~2023年)
- 現在および将来の市場規模分析と予測:販売チャネル別(2024年~2033年)
- オンライン販売
- 小売売上高
- 販売チャネル別の前年比成長動向分析(2019年~2023年)
- 販売チャネル別の絶対額の機会分析(2024年~2033年)
第8章 世界のグルコース管理サプリメント市場分析:地域別
- イントロダクション
- 過去の市場規模分析:地域別(2019年~2023年)
- 現在の市場規模分析と予測:地域別(2024年~2033年)
- 北米
- ラテンアメリカ
- 欧州
- アジア太平洋地域
- 中東・アフリカ
- 地域別の市場の魅力分析
第9章 北米のグルコース管理サプリメント市場分析(国別)
第10章 ラテンアメリカのグルコース管理サプリメント市場分析(国別)
第11章 欧州のグルコース管理サプリメント市場分析(国別)
第12章 アジア太平洋地域のグルコース管理サプリメント市場分析(国別)
第13章 中東・アフリカのグルコース管理サプリメント市場分析(国別)
第14章 主要国のグルコース管理サプリメント市場分析
- 米国
- カナダ
- ブラジル
- メキシコ
- ドイツ
- 英国
- フランス
- スペイン
- イタリア
- 中国
- 日本
- 韓国
- シンガポール
- タイ
- インドネシア
- オーストラリア
- ニュージーランド
- GCC諸国
- 南アフリカ
- イスラエル
第15章 市場構造分析
- 競合ダッシュボード
- 競合ベンチマーク
- 主要企業の市場シェア分析
第16章 競合分析
- 競合の詳細
- NOW Foods
- Life Extension
- GNC
- Natrol
- Nature Made
- Nature's Bounty
- Zenith Labs
- Blackmores
- Pure Encapsulations
- Doctor's Best
- Best Naturals
- Thorne
- Solgar
- Nutricost
第17章 前提と頭字語
第18章 調査手法
Persistence Market Research has recently released a comprehensive report on the worldwide market for glucose management supplements. The report offers a thorough assessment of crucial market dynamics, including drivers, trends, opportunities, and challenges, providing detailed insights into the market structure.
Key Insights:
- Glucose Management Supplements Market Size (2024E): USD 9.7 Billion
- Projected Market Value (2033F): USD 16 Billion
- Global Market Growth Rate (CAGR 2024 to 2033): 6.4%
Glucose Management Supplements Market - Report Scope:
Glucose management supplements play a crucial role in aiding individuals to regulate their blood sugar levels, thereby preventing or managing diabetes and related conditions. These supplements often include natural ingredients known for their glucose-lowering properties, such as berberine, cinnamon extract, chromium, and alpha-lipoic acid. The glucose management supplements market caters to a broad range of consumers, including those with prediabetes, type 2 diabetes, and those seeking preventive health measures.
Market Growth Drivers:
The global glucose management supplements market is propelled by several key factors, including increasing awareness about the importance of blood sugar regulation and the rising prevalence of diabetes worldwide. The growing adoption of preventive healthcare measures and the increasing availability of information about natural and dietary supplements also drive market expansion. Additionally, the aging population, which is more susceptible to glucose management issues, and lifestyle changes leading to higher incidences of metabolic disorders, further stimulate market growth.
Market Restraints:
Despite promising growth prospects, the glucose management supplements market faces challenges related to regulatory compliance, scientific validation, and consumer skepticism about the efficacy of supplements. Stringent regulations governing the marketing and use of dietary supplements impose compliance burdens on manufacturers, affecting market entry barriers and operational costs. Furthermore, the lack of comprehensive clinical evidence supporting the benefits of some supplements and the high cost of high-quality products pose challenges for market penetration, particularly in emerging economies with constrained healthcare budgets.
Market Opportunities:
The glucose management supplements market presents significant growth opportunities driven by technological innovations, increasing healthcare awareness, and the expansion of online retail platforms. The integration of digital health technologies, such as mobile health apps for monitoring blood sugar levels and personalized supplement recommendations, enhances consumer engagement and adherence. Furthermore, strategic partnerships, investment in research and development, and the introduction of user-friendly, cost-effective supplement formulations are essential to capitalize on emerging opportunities and sustain market leadership in the dynamic glucose management landscape.
Key Questions Answered in the Report:
- What are the primary factors driving the growth of the glucose management supplements market globally?
- Which supplement types and ingredients are driving adoption across different consumer demographics?
- How are technological advancements reshaping the competitive landscape of the glucose management supplements market?
- Who are the key players contributing to the glucose management supplements market, and what strategies are they employing to maintain market relevance?
- What are the emerging trends and future prospects in the global glucose management supplements market?
Competitive Intelligence and Business Strategy:
Leading players in the global glucose management supplements market, including Nature's Way Products LLC, NOW Foods, and Pure Encapsulations, focus on innovation, product differentiation, and strategic partnerships to gain a competitive edge. These companies invest in R&D to develop advanced supplement formulations that combine multiple glucose-regulating ingredients, catering to diverse consumer needs and preferences. Collaborations with healthcare providers, nutritional experts, and regulatory agencies facilitate market access and promote product acceptance. Moreover, emphasis on clinical research, evidence-based practice, and consumer education fosters market growth and enhances consumer trust in the rapidly evolving glucose management landscape.
Key Companies Profiled:
- NOW Foods
- Life Extension
- GNC
- Natrol
- Nature Made
- Nature's Bounty
- Zenith Labs
- Blackmores
- Pure Encapsulations
- Doctor's Best
- Spring Valley
- Best Naturals
Segmentation of the Global Glucose Management Supplements:
By Form
- Tablet
- Soft gels
- Capsule
By Type
- Alpha Lipoic Acid
- Minerals
- Vitamins
By Sales Channel
- Online Sales
- Retail Sales
By Region
- North America
- Latin America
- Europe
- Asia Pacific
- Middle East and Africa
Table of Contents
1. Executive Summary
- 1.1. Global Market Outlook
- 1.2. Demand-side Trends
- 1.3. Supply-side Trends
- 1.4. Technology Roadmap Analysis
- 1.5. Analysis and Recommendations
2. Market Overview
- 2.1. Market Coverage / Taxonomy
- 2.2. Market Definition / Scope / Limitations
3. Market Background
- 3.1. Market Dynamics
- 3.1.1. Drivers
- 3.1.2. Restraints
- 3.1.3. Opportunity
- 3.1.4. Trends
- 3.2. Scenario Forecast
- 3.2.1. Demand in Optimistic Scenario
- 3.2.2. Demand in Likely Scenario
- 3.2.3. Demand in Conservative Scenario
- 3.3. Opportunity Map Analysis
- 3.4. Investment Feasibility Matrix
- 3.5. PESTLE and Porter's Analysis
- 3.6. Regulatory Landscape
- 3.6.1. By Key Regions
- 3.6.2. By Key Countries
- 3.7. Regional Parent Market Outlook
4. Global Glucose Management Supplements Market Analysis 2019-2023 and Forecast, 2024-2033
- 4.1. Historical Market Size Value (US$ Million) Analysis, 2019-2023
- 4.2. Current and Future Market Size Value (US$ Million) Projections, 2024-2033
- 4.2.1. Y-o-Y Growth Trend Analysis
- 4.2.2. Absolute $ Opportunity Analysis
5. Global Glucose Management Supplements Market Analysis 2019-2023 and Forecast 2024-2033, By Type
- 5.1. Introduction / Key Findings
- 5.2. Historical Market Size Value (US$ Million) Analysis By Type, 2019-2023
- 5.3. Current and Future Market Size Value (US$ Million) Analysis and Forecast By Type, 2024-2033
- 5.3.1. Alpha Lipoic Acid
- 5.3.2. Minerals
- 5.3.3. Vitamins
- 5.3.4. Others
- 5.4. Y-o-Y Growth Trend Analysis By Type, 2019-2023
- 5.5. Absolute $ Opportunity Analysis By Type, 2024-2033
6. Global Glucose Management Supplements Market Analysis 2019-2023 and Forecast 2024-2033, By Form
- 6.1. Introduction / Key Findings
- 6.2. Historical Market Size Value (US$ Million) Analysis By Form, 2019-2023
- 6.3. Current and Future Market Size Value (US$ Million) Analysis and Forecast By Form, 2024-2033
- 6.3.1. Capsules
- 6.3.2. Softgels
- 6.3.3. Tablets
- 6.4. Y-o-Y Growth Trend Analysis By Form, 2019-2023
- 6.5. Absolute $ Opportunity Analysis By Form, 2024-2033
7. Global Glucose Management Supplements Market Analysis 2019-2023 and Forecast 2024-2033, By Sales Channel
- 7.1. Introduction / Key Findings
- 7.2. Historical Market Size Value (US$ Million) Analysis By Sales Channel , 2019-2023
- 7.3. Current and Future Market Size Value (US$ Million) Analysis and Forecast By Sales Channel , 2024-2033
- 7.3.1. Online Sales
- 7.3.2. Retail Sales
- 7.4. Y-o-Y Growth Trend Analysis By Sales Channel , 2019-2023
- 7.5. Absolute $ Opportunity Analysis By Sales Channel , 2024-2033
8. Global Glucose Management Supplements Market Analysis 2019-2023 and Forecast 2024-2033, By Region
- 8.1. Introduction
- 8.2. Historical Market Size Value (US$ Million) Analysis By Region, 2019-2023
- 8.3. Current Market Size Value (US$ Million) Analysis and Forecast By Region, 2024-2033
- 8.3.1. North America
- 8.3.2. Latin America
- 8.3.3. Europe
- 8.3.4. Asia Pacific
- 8.3.5. MEA
- 8.4. Market Attractiveness Analysis By Region
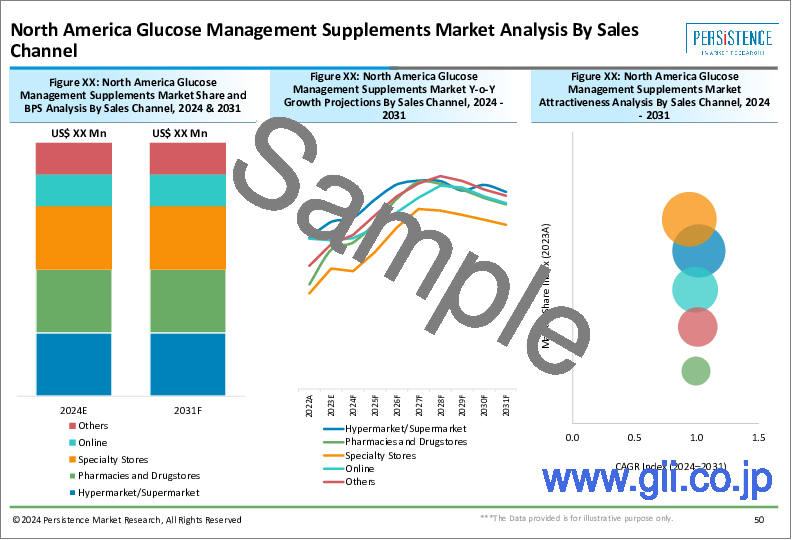
9. North America Glucose Management Supplements Market Analysis 2019-2023 and Forecast 2024-2033, By Country
- 9.1. Historical Market Size Value (US$ Million) Trend Analysis By Market Taxonomy, 2019-2023
- 9.2. Market Size Value (US$ Million) Forecast By Market Taxonomy, 2024-2033
- 9.2.1. By Country
- 9.2.1.1. U.S.
- 9.2.1.2. Canada
- 9.2.2. By Type
- 9.2.3. By Form
- 9.2.4. By Sales Channel
- 9.2.1. By Country
- 9.3. Market Attractiveness Analysis
- 9.3.1. By Country
- 9.3.2. By Type
- 9.3.3. By Form
- 9.3.4. By Sales Channel
- 9.4. Key Takeaways
10. Latin America Glucose Management Supplements Market Analysis 2019-2023 and Forecast 2024-2033, By Country
- 10.1. Historical Market Size Value (US$ Million) Trend Analysis By Market Taxonomy, 2019-2023
- 10.2. Market Size Value (US$ Million) Forecast By Market Taxonomy, 2024-2033
- 10.2.1. By Country
- 10.2.1.1. Brazil
- 10.2.1.2. Mexico
- 10.2.1.3. Rest of Latin America
- 10.2.2. By Type
- 10.2.3. By Form
- 10.2.4. By Sales Channel
- 10.2.1. By Country
- 10.3. Market Attractiveness Analysis
- 10.3.1. By Country
- 10.3.2. By Type
- 10.3.3. By Form
- 10.3.4. By Sales Channel
- 10.4. Key Takeaways
11. Europe Glucose Management Supplements Market Analysis 2019-2023 and Forecast 2024-2033, By Country
- 11.1. Historical Market Size Value (US$ Million) Trend Analysis By Market Taxonomy, 2019-2023
- 11.2. Market Size Value (US$ Million) Forecast By Market Taxonomy, 2024-2033
- 11.2.1. By Country
- 11.2.1.1. Germany
- 11.2.1.2. U.K.
- 11.2.1.3. France
- 11.2.1.4. Spain
- 11.2.1.5. Italy
- 11.2.1.6. Rest of Europe
- 11.2.2. By Type
- 11.2.3. By Form
- 11.2.4. By Sales Channel
- 11.2.1. By Country
- 11.3. Market Attractiveness Analysis
- 11.3.1. By Country
- 11.3.2. By Type
- 11.3.3. By Form
- 11.3.4. By Sales Channel
- 11.4. Key Takeaways
12. Asia Pacific Glucose Management Supplements Market Analysis 2019-2023 and Forecast 2024-2033, By Country
- 12.1. Historical Market Size Value (US$ Million) Trend Analysis By Market Taxonomy, 2019-2023
- 12.2. Market Size Value (US$ Million) Forecast By Market Taxonomy, 2024-2033
- 12.2.1. By Country
- 12.2.1.1. China
- 12.2.1.2. Japan
- 12.2.1.3. South Korea
- 12.2.1.4. Singapore
- 12.2.1.5. Thailand
- 12.2.1.6. Indonesia
- 12.2.1.7. Australia
- 12.2.1.8. New Zealand
- 12.2.1.9. Rest of Asia Pacific
- 12.2.2. By Type
- 12.2.3. By Form
- 12.2.4. By Sales Channel
- 12.2.1. By Country
- 12.3. Market Attractiveness Analysis
- 12.3.1. By Country
- 12.3.2. By Type
- 12.3.3. By Form
- 12.3.4. By Sales Channel
- 12.4. Key Takeaways
13. MEA Glucose Management Supplements Market Analysis 2019-2023 and Forecast 2024-2033, By Country
- 13.1. Historical Market Size Value (US$ Million) Trend Analysis By Market Taxonomy, 2019-2023
- 13.2. Market Size Value (US$ Million) Forecast By Market Taxonomy, 2024-2033
- 13.2.1. By Country
- 13.2.1.1. GCC Countries
- 13.2.1.2. South Africa
- 13.2.1.3. Israel
- 13.2.1.4. Rest of MEA
- 13.2.2. By Type
- 13.2.3. By Form
- 13.2.4. By Sales Channel
- 13.2.1. By Country
- 13.3. Market Attractiveness Analysis
- 13.3.1. By Country
- 13.3.2. By Type
- 13.3.3. By Form
- 13.3.4. By Sales Channel
- 13.4. Key Takeaways
14. Key Countries Glucose Management Supplements Market Analysis
- 14.1. U.S.
- 14.1.1. Pricing Analysis
- 14.1.2. Market Share Analysis, 2024
- 14.1.2.1. By Type
- 14.1.2.2. By Form
- 14.1.2.3. By Sales Channel
- 14.2. Canada
- 14.2.1. Pricing Analysis
- 14.2.2. Market Share Analysis, 2024
- 14.2.2.1. By Type
- 14.2.2.2. By Form
- 14.2.2.3. By Sales Channel
- 14.3. Brazil
- 14.3.1. Pricing Analysis
- 14.3.2. Market Share Analysis, 2024
- 14.3.2.1. By Type
- 14.3.2.2. By Form
- 14.3.2.3. By Sales Channel
- 14.4. Mexico
- 14.4.1. Pricing Analysis
- 14.4.2. Market Share Analysis, 2024
- 14.4.2.1. By Type
- 14.4.2.2. By Form
- 14.4.2.3. By Sales Channel
- 14.5. Germany
- 14.5.1. Pricing Analysis
- 14.5.2. Market Share Analysis, 2024
- 14.5.2.1. By Type
- 14.5.2.2. By Form
- 14.5.2.3. By Sales Channel
- 14.6. U.K.
- 14.6.1. Pricing Analysis
- 14.6.2. Market Share Analysis, 2024
- 14.6.2.1. By Type
- 14.6.2.2. By Form
- 14.6.2.3. By Sales Channel
- 14.7. France
- 14.7.1. Pricing Analysis
- 14.7.2. Market Share Analysis, 2024
- 14.7.2.1. By Type
- 14.7.2.2. By Form
- 14.7.2.3. By Sales Channel
- 14.8. Spain
- 14.8.1. Pricing Analysis
- 14.8.2. Market Share Analysis, 2024
- 14.8.2.1. By Type
- 14.8.2.2. By Form
- 14.8.2.3. By Sales Channel
- 14.9. Italy
- 14.9.1. Pricing Analysis
- 14.9.2. Market Share Analysis, 2024
- 14.9.2.1. By Type
- 14.9.2.2. By Form
- 14.9.2.3. By Sales Channel
- 14.10. China
- 14.10.1. Pricing Analysis
- 14.10.2. Market Share Analysis, 2024
- 14.10.2.1. By Type
- 14.10.2.2. By Form
- 14.10.2.3. By Sales Channel
- 14.11. Japan
- 14.11.1. Pricing Analysis
- 14.11.2. Market Share Analysis, 2024
- 14.11.2.1. By Type
- 14.11.2.2. By Form
- 14.11.2.3. By Sales Channel
- 14.12. South Korea
- 14.12.1. Pricing Analysis
- 14.12.2. Market Share Analysis, 2024
- 14.12.2.1. By Type
- 14.12.2.2. By Form
- 14.12.2.3. By Sales Channel
- 14.13. Singapore
- 14.13.1. Pricing Analysis
- 14.13.2. Market Share Analysis, 2024
- 14.13.2.1. By Type
- 14.13.2.2. By Form
- 14.13.2.3. By Sales Channel
- 14.14. Thailand
- 14.14.1. Pricing Analysis
- 14.14.2. Market Share Analysis, 2024
- 14.14.2.1. By Type
- 14.14.2.2. By Form
- 14.14.2.3. By Sales Channel
- 14.15. Indonesia
- 14.15.1. Pricing Analysis
- 14.15.2. Market Share Analysis, 2024
- 14.15.2.1. By Type
- 14.15.2.2. By Form
- 14.15.2.3. By Sales Channel
- 14.16. Australia
- 14.16.1. Pricing Analysis
- 14.16.2. Market Share Analysis, 2024
- 14.16.2.1. By Type
- 14.16.2.2. By Form
- 14.16.2.3. By Sales Channel
- 14.17. New Zealand
- 14.17.1. Pricing Analysis
- 14.17.2. Market Share Analysis, 2024
- 14.17.2.1. By Type
- 14.17.2.2. By Form
- 14.17.2.3. By Sales Channel
- 14.18. GCC Countries
- 14.18.1. Pricing Analysis
- 14.18.2. Market Share Analysis, 2024
- 14.18.2.1. By Type
- 14.18.2.2. By Form
- 14.18.2.3. By Sales Channel
- 14.19. South Africa
- 14.19.1. Pricing Analysis
- 14.19.2. Market Share Analysis, 2024
- 14.19.2.1. By Type
- 14.19.2.2. By Form
- 14.19.2.3. By Sales Channel
- 14.20. Israel
- 14.20.1. Pricing Analysis
- 14.20.2. Market Share Analysis, 2024
- 14.20.2.1. By Type
- 14.20.2.2. By Form
- 14.20.2.3. By Sales Channel
15. Market Structure Analysis
- 15.1. Competition Dashboard
- 15.2. Competition Benchmarking
- 15.3. Market Share Analysis of Top Players
- 15.3.1. By Regional
- 15.3.2. By Type
- 15.3.3. By Form
- 15.3.4. By Sales Channel
16. Competition Analysis
- 16.1. Competition Deep Dive
- 16.1.1. NOW Foods
- 16.1.1.1. Overview
- 16.1.1.2. Product Portfolio
- 16.1.1.3. Profitability by Market Segments
- 16.1.1.4. Sales Footprint
- 16.1.1.5. Strategy Overview
- 16.1.1.5.1. Marketing Strategy
- 16.1.2. Life Extension
- 16.1.2.1. Overview
- 16.1.2.2. Product Portfolio
- 16.1.2.3. Profitability by Market Segments
- 16.1.2.4. Sales Footprint
- 16.1.2.5. Strategy Overview
- 16.1.2.5.1. Marketing Strategy
- 16.1.3. GNC
- 16.1.3.1. Overview
- 16.1.3.2. Product Portfolio
- 16.1.3.3. Profitability by Market Segments
- 16.1.3.4. Sales Footprint
- 16.1.3.5. Strategy Overview
- 16.1.3.5.1. Marketing Strategy
- 16.1.4. Natrol
- 16.1.4.1. Overview
- 16.1.4.2. Product Portfolio
- 16.1.4.3. Profitability by Market Segments
- 16.1.4.4. Sales Footprint
- 16.1.4.5. Strategy Overview
- 16.1.4.5.1. Marketing Strategy
- 16.1.5. Nature Made
- 16.1.5.1. Overview
- 16.1.5.2. Product Portfolio
- 16.1.5.3. Profitability by Market Segments
- 16.1.5.4. Sales Footprint
- 16.1.5.5. Strategy Overview
- 16.1.5.5.1. Marketing Strategy
- 16.1.6. Nature's Bounty
- 16.1.6.1. Overview
- 16.1.6.2. Product Portfolio
- 16.1.6.3. Profitability by Market Segments
- 16.1.6.4. Sales Footprint
- 16.1.6.5. Strategy Overview
- 16.1.6.5.1. Marketing Strategy
- 16.1.7. Zenith Labs
- 16.1.7.1. Overview
- 16.1.7.2. Product Portfolio
- 16.1.7.3. Profitability by Market Segments
- 16.1.7.4. Sales Footprint
- 16.1.7.5. Strategy Overview
- 16.1.7.5.1. Marketing Strategy
- 16.1.8. Blackmores
- 16.1.8.1. Overview
- 16.1.8.2. Product Portfolio
- 16.1.8.3. Profitability by Market Segments
- 16.1.8.4. Sales Footprint
- 16.1.8.5. Strategy Overview
- 16.1.8.5.1. Marketing Strategy
- 16.1.9. Pure Encapsulations
- 16.1.9.1. Overview
- 16.1.9.2. Product Portfolio
- 16.1.9.3. Profitability by Market Segments
- 16.1.9.4. Sales Footprint
- 16.1.9.5. Strategy Overview
- 16.1.9.5.1. Marketing Strategy
- 16.1.10. Doctor's Best
- 16.1.10.1. Overview
- 16.1.10.2. Product Portfolio
- 16.1.10.3. Profitability by Market Segments
- 16.1.10.4. Sales Footprint
- 16.1.10.5. Strategy Overview
- 16.1.10.5.1. Marketing Strategy
- 16.1.11. Best Naturals
- 16.1.11.1. Overview
- 16.1.11.2. Product Portfolio
- 16.1.11.3. Profitability by Market Segments
- 16.1.11.4. Sales Footprint
- 16.1.11.5. Strategy Overview
- 16.1.11.5.1. Marketing Strategy
- 16.1.12. Thorne
- 16.1.12.1. Overview
- 16.1.12.2. Product Portfolio
- 16.1.12.3. Profitability by Market Segments
- 16.1.12.4. Sales Footprint
- 16.1.12.5. Strategy Overview
- 16.1.12.5.1. Marketing Strategy
- 16.1.13. Solgar
- 16.1.13.1. Overview
- 16.1.13.2. Product Portfolio
- 16.1.13.3. Profitability by Market Segments
- 16.1.13.4. Sales Footprint
- 16.1.13.5. Strategy Overview
- 16.1.13.5.1. Marketing Strategy
- 16.1.14. Nutricost
- 16.1.14.1. Overview
- 16.1.14.2. Product Portfolio
- 16.1.14.3. Profitability by Market Segments
- 16.1.14.4. Sales Footprint
- 16.1.14.5. Strategy Overview
- 16.1.14.5.1. Marketing Strategy
- 16.1.1. NOW Foods
17. Assumptions & Acronyms Used
18. Research Methodology