|
|
市場調査レポート
商品コード
1475899
黄斑変性治療市場:地域(北米、欧州、アジア太平洋、ラテンアメリカ、中東アフリカ)別世界の産業分析、規模、シェア、成長、動向、予測、2024-2032年Macular Degeneration Treatment Market by Geography (North America, Europe, Asia Pacific, Latin America, and the Middle East and Africa): Global Industry Analysis, Size, Share, Growth, Trends, and Forecast, 2024-2032 |
||||||

|
|||||||
カスタマイズ可能
|
|||||||

| 黄斑変性治療市場:地域(北米、欧州、アジア太平洋、ラテンアメリカ、中東アフリカ)別世界の産業分析、規模、シェア、成長、動向、予測、2024-2032年 |
|
出版日: 2024年04月30日
発行: Persistence Market Research
ページ情報: 英文 250 Pages
納期: 2~5営業日
|

全表示
- 概要
- 目次
Persistence Market Research社の黄斑変性治療市場調査レポートでは、2024年から2032年までの市場力学、成長要因、課題、新興動向の包括的な分析を提供しています。黄斑変性治療市場の現状と将来展望に関する洞察を提供します。
世界の黄斑変性治療市場は、2024年の100億米ドルからCAGR(複合年間成長率)7.4%で成長し、2032年には188億米ドルに達すると予測されます。
主な洞察
- 推定市場規模(2024年):100億米ドル
- 予測市場規模(2032年):188億米ドル
- 世界市場成長率(CAGR 2024年~2032年):7.4%
黄斑変性治療市場-レポート範囲:
黄斑変性症は、中心視力に影響を及ぼす慢性的な眼疾患であり、高齢者の視力低下の主な原因となっています。本レポートでは、高齢化、ライフスタイルの変化、診断・治療技術の進歩など、黄斑変性治療の需要を支える主な要因について概説しています。
市場成長の促進要因:
市場の成長はいくつかの要因によって促進されます。まず、高齢化、座りがちなライフスタイル、喫煙、遺伝的素因などの要因により、加齢黄斑変性症(AMD)の有病率が世界的に増加していることが、抗血管内皮増殖因子(抗VEGF)薬、光線力学的療法(PDT)、網膜インプラントなどの黄斑変性治療オプションに対する需要を促進しています。さらに、光干渉断層計(OCT)や眼底自発蛍光(FAF)などの画像診断技術の進歩により、AMD患者の早期発見、正確な診断、個別化された治療計画が可能になり、治療成績と視力維持が向上しています。さらに、新規ドラッグデリバリーシステム、遺伝子治療、再生医療アプローチに焦点を当てた研究開発イニシアティブは、湿性AMD、乾性AMD、地理的萎縮を含む黄斑変性症の様々なサブタイプをターゲットとした革新的な治療への有望な道を提供しています。
市場抑制要因:
見通しは明るいもの、黄斑変性治療市場は一定の課題に直面しています。高額な治療費、限られた保険適用範囲、償還の制約といった要因は、特に新興市場や十分な治療を受けていない人々の黄斑変性治療への患者アクセスに影響を与え、市場のダイナミクスや普及率に影響を及ぼす可能性があります。さらに、硝子体内注射やレーザー光凝固などの侵襲的手技に伴う安全性への懸念、副作用、治療合併症は、黄斑変性治療に対する患者のコンプライアンスと受容を阻害し、市場の成長と浸透に課題をもたらす可能性があります。さらに、規制上のハードル、臨床試験の要件、知的財産の問題は、新規の黄斑変性治療薬の市場参入と製品化を遅らせ、業界における技術革新と投資を妨げる可能性があります。
市場機会:
黄斑変性治療薬市場には、技術革新と市場拡大の大きな機会があります。ヘルスケアプロバイダーや製薬企業は、黄斑変性症の発症に関与する新規経路、分子標的、疾患メカニズムを標的とした次世代治療法の開発に注力することができます。例えば、遺伝子編集、幹細胞治療、神経保護剤などの新たな治療法は、黄斑変性症の疾患修飾、視力回復、長期管理に有望です。さらに、戦略的パートナーシップ、共同研究、技術移転契約は、黄斑変性症の研究開発エコシステムにおける知識交換、リソースの共有、能力構築を促進し、イノベーションのペースと科学的発見の臨床応用への転換を加速します。さらに、患者教育、アドボカシー・イニシアチブ、コミュニティ・アウトリーチ・プログラムへの投資は、認知度を高め、偏見をなくし、黄斑変性症の診断、治療、支援サービスへのアクセスを改善し、患者が十分な情報を得た上で意思決定し、眼科治療に積極的に参加できるようにします。
本レポートで扱う主な質問
- 2024年から2032年までの黄斑変性治療市場の予想CAGRは?
- 黄斑変性治療市場の成長を促進する主な要因は何か?
- 黄斑変性治療市場で最大の市場シェアを占める治療様式は何か?
- 黄斑変性治療の世界市場における主要プレイヤーは?
- 黄斑変性治療市場で競合を維持するために主要企業はどのような戦略を採用しているか?
目次
第1章 エグゼクティブサマリー
第2章 市場概要
- 市場範囲/分類
- 市場の定義/範囲/制限
- 包含・除外
第3章 主要な市場動向
- 市場に影響を与える主な動向
- 製品開発とイノベーションの動向
第4章 重要成功要因
- 製品の採用/使用状況分析
- 最近の製品の発売と承認
- 戦略的プロモーション戦略
- 疾病疫学
- 規制と償還のシナリオ
- 製品パイプライン評価
- ポーター分析
- PESTLE分析
第5章 市場背景
- マクロ経済要因
- 予測要因-関連性と影響
- 市場力学
第6章 COVID-19危機-影響評価
- COVID-19と影響分析
- 医薬品別収益
- 投与経路別収益
- 適応症別収益
- エンドユーザー別収益
- 国別収益
- 2023年の市場シナリオ
第7章 世界の黄斑変性治療市場の需要(金額および規模)分析
- 過去の市場金額(金額)分析、2019-2023年
- 現在および将来の市場金額(金額)予測、2024~2032年
第8章 世界の黄斑変性治療市場分析、薬剤別
- イントロダクション/主な調査結果
- 過去の市場分析(金額)、2019-2023年
- 現在および将来の市場予測(金額)、2024~2032年
- 抗血管内皮増殖因子
- その他
- 医薬品別の市場魅力度分析
第9章 投与経路別世界黄斑変性治療市場分析
- イントロダクション/主な調査結果
- 過去の市場分析(金額)、2019-2023年
- 現在および将来の市場予測(金額)、2024~2032年
- 静脈内投与
- 硝子体内投与
- その他
- 投与経路別の市場魅力度分析
第10章 黄斑変性治療の世界市場分析、適応症別
- イントロダクション/主な調査結果
- 過去の市場分析(金額)、2019-2023年
- 現在および将来の市場予測(金額)、2024~2032年
- ドライ型加齢黄斑変性
- 滲出型加齢黄斑変性
- 適応症別の市場魅力度分析
第11章 世界の黄斑変性治療市場分析、エンドユーザー別
- イントロダクション/主な調査結果
- 過去の市場分析(金額)、2019-2023年
- 現在および将来の市場予測(金額)、2024~2032年
- 病院
- 眼科クリニック
- 外来手術センター
- その他
- エンドユーザー別市場魅力度分析
第12章 世界黄斑変性治療市場分析、地域別
- イントロダクション
- 過去の市場分析(金額)、2019-2023年
- 現在および将来の市場予測(金額)、2024~2032年
- 北米
- ラテンアメリカ
- 欧州
- 東アジア
- 南アジア
- オセアニア
- 中東・アフリカ(MEA)
- 地域別市場魅力度分析
第13章 北米の黄斑変性治療市場分析
第14章 ラテンアメリカの黄斑変性治療市場分析
第15章 欧州の黄斑変性治療市場分析
第16章 南アジアの黄斑変性治療市場分析
第17章 東アジアの黄斑変性治療市場分析
第18章 オセアニアの黄斑変性治療市場
第19章 中東およびアフリカ(MEA)黄斑変性治療市場分析
第20章 市場構造分析
- 企業階層別市場分析
- 主要企業の市場シェア分析(%)
- 市場プレゼンス分析
第21章 競合分析
- 競合ダッシュボード
- 競合ベンチマーク
- 競合の詳細(暫定リスト)
- F. Hoffmann-La Roche Ltd.
- Novartis AG
- Bayer AG
- Pfizer Inc.
- Bausch Health Companies Inc.
- Regeneron Pharmaceuticals Inc.
- Amgen Inc.
- Biogen
- Samsung Bioepis
- Santen Pharmaceutical Co., Ltd.
第22章 使用される前提条件と頭字語
第23章 調査手法
The Macular Degeneration Treatment Market report by Persistence Market Research offers a comprehensive analysis of market dynamics, growth factors, challenges, and emerging trends from the period 2024 to 2032. It provides insights into the current state and future outlook of the Macular Degeneration Treatment Market.
The global macular degeneration treatment market is projected to grow at a compound annual growth rate (CAGR) of 7.4% from USD 10 billion in 2024 to USD 18.8 billion by 2032.
Key Insights:
- Estimated Market Size (2024): USD 10 Billion
- Projected Market Size (2032): USD 18.8 Billion
- Global Market Growth Rate (CAGR 2024 to 2032): 7.4%
Macular Degeneration Treatment Market - Report Scope:
Macular degeneration is a chronic eye disorder affecting the central vision and is a leading cause of vision loss among older adults. The report outlines key drivers behind the demand for macular degeneration treatment, including the aging population, lifestyle changes, and advancements in diagnostic and therapeutic technologies.
Market Growth Drivers:
The market's growth is propelled by several factors. Firstly, the increasing prevalence of age-related macular degeneration (AMD) worldwide, driven by factors such as aging population, sedentary lifestyles, smoking, and genetic predisposition, fuels demand for macular degeneration treatment options such as anti-vascular endothelial growth factor (anti-VEGF) drugs, photodynamic therapy (PDT), and retinal implants. Additionally, advancements in diagnostic imaging techniques such as optical coherence tomography (OCT) and fundus autofluorescence (FAF) enable early detection, accurate diagnosis, and personalized treatment planning for patients with AMD, enhancing treatment outcomes and vision preservation. Moreover, research and development initiatives focusing on novel drug delivery systems, gene therapies, and regenerative medicine approaches offer promising avenues for innovative treatments targeting various subtypes of macular degeneration, including wet AMD, dry AMD, and geographic atrophy.
Market Restraints:
Despite the positive outlook, the Macular Degeneration Treatment Market faces certain challenges. Factors such as high treatment costs, limited insurance coverage, and reimbursement constraints may impact patient access to macular degeneration treatments, particularly in emerging markets and underserved populations, influencing market dynamics and adoption rates. Moreover, safety concerns, adverse effects, and treatment complications associated with invasive procedures such as intravitreal injections and laser photocoagulation may deter patient compliance and acceptance of macular degeneration therapies, posing challenges to market growth and penetration. Additionally, regulatory hurdles, clinical trial requirements, and intellectual property issues may delay market entry and product commercialization for novel macular degeneration treatments, hampering innovation and investment in the industry.
Market Opportunities:
The Macular Degeneration Treatment Market offers significant opportunities for innovation and market expansion. Healthcare providers and pharmaceutical companies can focus on developing next-generation therapies targeting novel pathways, molecular targets, and disease mechanisms implicated in macular degeneration pathogenesis. For instance, emerging treatment modalities such as gene editing, stem cell therapy, and neuroprotective agents hold promise for disease modification, vision restoration, and long-term management of macular degeneration. Moreover, strategic partnerships, collaborations, and technology transfer agreements facilitate knowledge exchange, resource sharing, and capacity building in the macular degeneration research and development ecosystem, accelerating the pace of innovation and translation of scientific discoveries into clinical applications. Furthermore, investments in patient education, advocacy initiatives, and community outreach programs raise awareness, reduce stigma, and improve access to macular degeneration diagnosis, treatment, and support services, empowering patients to make informed decisions and actively participate in their eye care journey.
Key Questions Addressed in the Report:
- What is the Expected CAGR of the Macular Degeneration Treatment Market from 2024 to 2032?
- What are the Key Factors Driving the Growth of the Macular Degeneration Treatment Market?
- Which Treatment Modality Holds the Largest Market Share in the Macular Degeneration Treatment Market?
- Who are the Key Players in the Global Macular Degeneration Treatment Market?
- What Strategies are Adopted by Leading Companies to Stay Competitive in the Macular Degeneration Treatment Market?
Competitive Landscape and Business Strategies:
Key players in the Macular Degeneration Treatment Market include Novartis AG, Roche Holding AG, Regeneron Pharmaceuticals, Inc., Bayer AG, and Allergan plc, among others. These companies focus on product differentiation, market expansion, and strategic collaborations to maintain a competitive edge in the market. For instance, Novartis AG offers Lucentis(R) (ranibizumab) and Beovu(R) (brolucizumab) for the treatment of wet AMD, while Roche Holding AG markets Lucentis(R) in collaboration with Novartis. Market players also invest in patient support programs, disease awareness campaigns, and digital health solutions to enhance patient engagement, adherence, and retention in macular degeneration treatment pathways.
Key Companies Profiled:
- Novartis AG
- Roche Holding AG
- Regeneron Pharmaceuticals, Inc.
- Bayer AG
- Allergan plc
Macular Degeneration Treatment Market Segmentation:
By Drug:
- Anti-vascular Endothelial Growth Factors
- Others
By Indication:
- Dry Age-related Macular Degeneration
- Wet Age-related Macular Degeneration
By Route of Administration:
- Intravenous Route
- Intravitreal Route
- Others
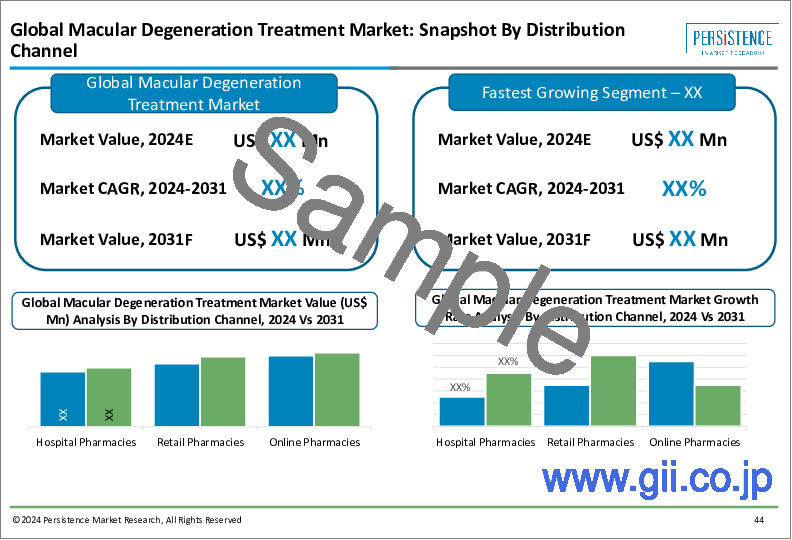
By Distribution Channel:
- Hospitals
- Ophthalmology Clinics
- Ambulatory Surgical Centers
- Others
By Region:
- North America
- Latin America
- Europe Macular
- South Asia
- East Asia
- Oceania
- Middle East & Africa
Table of Contents
1. Executive Summary
- 1.1. Global Market Outlook
- 1.2. Demand Side Trends
- 1.3. Supply Side Trends
- 1.4. Analysis and Recommendations
2. Market Overview
- 2.1. Market Coverage / Taxonomy
- 2.2. Market Definition / Scope / Limitations
- 2.3. Inclusions and Exclusions
3. Key Market Trends
- 3.1. Key Trends Impacting the Market
- 3.2. Product Development and Innovation Trends
4. Key Success Factors
- 4.1. Product Adoption / Usage Analysis
- 4.2. Recent Product Launches and Approvals
- 4.3. Strategic Promotional Strategies
- 4.4. Disease Epidemiology
- 4.5. Regulatory and Reimbursement Scenario
- 4.6. Product Pipeline Assessment
- 4.7. Porters Analysis
- 4.8. PESTLE Analysis
5. Market Background
- 5.1. Macro-Economic Factors
- 5.1.1. Global GDP Growth Outlook
- 5.1.2. Global Healthcare Outlook
- 5.1.3. Per Capita Healthcare Expenditure Outlook
- 5.2. Forecast Factors - Relevance & Impact
- 5.2.1. Alternative Treatment Market Growth
- 5.2.2. Technological Advances
- 5.2.3. Development of Novel Products
- 5.2.4. Regulatory Imposition
- 5.2.5. Product Pipeline
- 5.2.6. Per Patient Spending
- 5.3. Market Dynamics
- 5.3.1. Drivers
- 5.3.2. Restraints
- 5.3.3. Opportunity Analysis
6. COVID-19 Crisis - Impact Assessment
- 6.1. COVID-19 and Impact Analysis
- 6.1.1. Revenue By Drug
- 6.1.2. Revenue By Route of Administration
- 6.1.3. Revenue By Indication
- 6.1.4. Revenue By End User
- 6.1.5. Revenue By Country
- 6.2. 2023 Market Scenario
7. Global Macular Degeneration Treatment Market Demand (in Value or Size in US$ Mn) Analysis 2019-2023 and Forecast, 2024-2032
- 7.1. Historical Market Value (US$ Mn) Analysis, 2019-2023
- 7.2. Current and Future Market Value (US$ Mn) Projections, 2024-2032
- 7.2.1. Y-o-Y Growth Trend Analysis
- 7.2.2. Absolute $ Opportunity Analysis
8. Global Macular Degeneration Treatment Market Analysis 2019-2023 and Forecast 2024-2032, By Drug
- 8.1. Introduction / Key Findings
- 8.2. Historical Market Size (US$ Mn) Analysis By Drug, 2019-2023
- 8.3. Current and Future Market Size (US$ Mn) Analysis and Forecast By Drug, 2024-2032
- 8.3.1. Anti-vascular Endothelial Growth Factor
- 8.3.2. Other
- 8.4. Market Attractiveness Analysis By Drug
9. Global Macular Degeneration Treatment Market Analysis 2019-2023 and Forecast 2024-2032, By Route of Administration
- 9.1. Introduction / Key Findings
- 9.2. Historical Market Size (US$ Mn) Analysis By Route of Administration, 2019-2023
- 9.3. Current and Future Market Size (US$ Mn) Analysis and Forecast By Route of Administration, 2024-2032
- 9.3.1. Intravenous Route
- 9.3.2. Intravitreal Route
- 9.3.3. Others
- 9.4. Market Attractiveness Analysis By Route of Administration
10. Global Macular Degeneration Treatment Market Analysis 2019-2023 and Forecast 2024-2032, By Indication
- 10.1. Introduction / Key Findings
- 10.2. Historical Market Size (US$ Mn) Analysis By Indication, 2019-2023
- 10.3. Current and Future Market Size (US$ Mn) Analysis and Forecast By Indication, 2024-2032
- 10.3.1. Dry Age-related Macular Degeneration
- 10.3.2. Wet Age-related Macular Degeneration
- 10.4. Market Attractiveness Analysis By Indication
11. Global Macular Degeneration Treatment Market Analysis 2019-2023 and Forecast 2024-2032, By End User
- 11.1. Introduction / Key Findings
- 11.2. Historical Market Size (US$ Mn) Analysis By End User, 2019-2023
- 11.3. Current and Future Market Size (US$ Mn) and Forecast By End User, 2024-2032
- 11.3.1. Hospitals
- 11.3.2. Ophthalmology Clinics
- 11.3.3. Ambulatory Surgical Centers
- 11.3.4. Others
- 11.4. Market Attractiveness Analysis By End User
12. Global Macular Degeneration Treatment Market Analysis 2019-2023 and Forecast 2024-2032, by Region
- 12.1. Introduction
- 12.2. Historical Market Size (US$ Mn) Analysis By Region, 2019-2023
- 12.3. Current and Future Market Size (US$ Mn) Analysis and Forecast By Region, 2024-2032
- 12.3.1. North America
- 12.3.2. Latin America
- 12.3.3. Europe
- 12.3.4. East Asia
- 12.3.5. South Asia
- 12.3.6. Oceania
- 12.3.7. The Middle East and Africa (MEA)
- 12.4. Market Attractiveness Analysis By Region
13. North America Macular Degeneration Treatment Market Analysis 2019-2023 and Forecast 2024-2032
- 13.1. Introduction
- 13.2. Historical Market Size (US$ Mn) Trend Analysis By Market Taxonomy, 2019-2023
- 13.3. Current and Future Market Size (US$ Mn) Forecast By Market Taxonomy, 2024-2032
- 13.3.1. By Country
- 13.3.1.1. U.S.
- 13.3.1.2. Canada
- 13.3.2. By Drug
- 13.3.3. By Route of Administration
- 13.3.4. By Indication
- 13.3.5. By End User
- 13.3.1. By Country
- 13.4. Market Attractiveness Analysis
- 13.4.1. By Country
- 13.4.2. By Drug
- 13.4.3. By Route of Administration
- 13.4.4. By Indication
- 13.4.5. By End User
- 13.5. Market Trends
- 13.6. Key Market Participants - Intensity Mapping
- 13.7. Drivers and Restraints - Impact Analysis
- 13.8. Country Level Analysis & Forecast
- 13.8.1. U.S. Macular Degeneration Treatment Market Analysis
- 13.8.1.1. Introduction
- 13.8.1.2. Market Analysis and Forecast by Market Taxonomy
- 13.8.1.2.1. By Drug
- 13.8.1.2.2. By Route of Administration
- 13.8.1.2.3. By Indication
- 13.8.1.2.4. By End User
- 13.8.2. Canada Macular Degeneration Treatment Market Analysis
- 13.8.2.1. Introduction
- 13.8.2.2. Market Analysis and Forecast by Market Taxonomy
- 13.8.2.2.1. By Drug
- 13.8.2.2.2. By Route of Administration
- 13.8.2.2.3. By Indication
- 13.8.2.2.4. By End User
- 13.8.1. U.S. Macular Degeneration Treatment Market Analysis
14. Latin America Macular Degeneration Treatment Market Analysis 2019-2023 and Forecast 2024-2032
- 14.1. Introduction
- 14.2. Historical Market Size (US$ Mn) Trend Analysis By Market Taxonomy, 2019-2023
- 14.3. Current and Future Market Size (US$ Mn) Forecast By Market Taxonomy, 2024-2032
- 14.3.1. By Country
- 14.3.1.1. Brazil
- 14.3.1.2. Mexico
- 14.3.1.3. Argentina
- 14.3.1.4. Rest of Latin America
- 14.3.2. By Drug
- 14.3.3. By Route of Administration
- 14.3.4. By Indication
- 14.3.5. By End User
- 14.3.1. By Country
- 14.4. Market Attractiveness Analysis
- 14.4.1. By Country
- 14.4.2. By Drug
- 14.4.3. By Route of Administration
- 14.4.4. By Indication
- 14.4.5. By End User
- 14.5. Market Trends
- 14.6. Key Market Participants - Intensity Mapping
- 14.7. Drivers and Restraints - Impact Analysis
- 14.8. Country Level Analysis & Forecast
- 14.8.1. Brazil Macular Degeneration Treatment Market Analysis
- 14.8.1.1. Introduction
- 14.8.1.2. Market Analysis and Forecast by Market Taxonomy
- 14.8.1.2.1. By Drug
- 14.8.1.2.2. By Route of Administration
- 14.8.1.2.3. By Indication
- 14.8.1.2.4. By End User
- 14.8.2. Mexico Macular Degeneration Treatment Market Analysis
- 14.8.2.1. Introduction
- 14.8.2.2. Market Analysis and Forecast by Market Taxonomy
- 14.8.2.2.1. By Drug
- 14.8.2.2.2. By Route of Administration
- 14.8.2.2.3. By Indication
- 14.8.2.2.4. By End User
- 14.8.3. Argentina Macular Degeneration Treatment Market Analysis
- 14.8.3.1. Introduction
- 14.8.3.2. Market Analysis and Forecast by Market Taxonomy
- 14.8.3.2.1. By Drug
- 14.8.3.2.2. By Route of Administration
- 14.8.3.2.3. By Indication
- 14.8.3.2.4. By End User
- 14.8.1. Brazil Macular Degeneration Treatment Market Analysis
15. Europe Macular Degeneration Treatment Market Analysis 2019-2023 and Forecast 2024-2032
- 15.1. Introduction
- 15.2. Historical Market Size (US$ Mn) Trend Analysis By Market Taxonomy, 2019-2023
- 15.3. Current and Future Market Size (US$ Mn) Forecast By Market Taxonomy, 2024-2032
- 15.3.1. By Country
- 15.3.1.1. Germany
- 15.3.1.2. Italy
- 15.3.1.3. France
- 15.3.1.4. U.K.
- 15.3.1.5. Spain
- 15.3.1.6. BENELUX
- 15.3.1.7. Russia
- 15.3.1.8. Rest of Europe
- 15.3.2. By Drug
- 15.3.3. By Route of Administration
- 15.3.4. By Indication
- 15.3.5. By End User
- 15.3.1. By Country
- 15.4. Market Attractiveness Analysis
- 15.4.1. By Country
- 15.4.2. By Drug
- 15.4.3. By Route of Administration
- 15.4.4. By Indication
- 15.4.5. By End User
- 15.5. Market Trends
- 15.6. Key Market Participants - Intensity Mapping
- 15.7. Drivers and Restraints - Impact Analysis
- 15.8. Country Level Analysis & Forecast
- 15.8.1. Germany Macular Degeneration Treatment Market Analysis
- 15.8.1.1. Introduction
- 15.8.1.2. Market Analysis and Forecast by Market Taxonomy
- 15.8.1.2.1. By Drug
- 15.8.1.2.2. By Route of Administration
- 15.8.1.2.3. By Indication
- 15.8.1.2.4. By End User
- 15.8.2. Italy Macular Degeneration Treatment Market Analysis
- 15.8.2.1. Introduction
- 15.8.2.2. Market Analysis and Forecast by Market Taxonomy
- 15.8.2.2.1. By Drug
- 15.8.2.2.2. By Route of Administration
- 15.8.2.2.3. By Indication
- 15.8.2.2.4. By End User
- 15.8.3. France Macular Degeneration Treatment Market Analysis
- 15.8.3.1. Introduction
- 15.8.3.2. Market Analysis and Forecast by Market Taxonomy
- 15.8.3.2.1. By Drug
- 15.8.3.2.2. By Route of Administration
- 15.8.3.2.3. By Indication
- 15.8.3.2.4. By End User
- 15.8.4. U.K. Macular Degeneration Treatment Market Analysis
- 15.8.4.1. Introduction
- 15.8.4.2. Market Analysis and Forecast by Market Taxonomy
- 15.8.4.2.1. By Drug
- 15.8.4.2.2. By Route of Administration
- 15.8.4.2.3. By Indication
- 15.8.4.2.4. By End User
- 15.8.5. Spain Macular Degeneration Treatment Market Analysis
- 15.8.5.1. Introduction
- 15.8.5.2. Market Analysis and Forecast by Market Taxonomy
- 15.8.5.2.1. By Drug
- 15.8.5.2.2. By Route of Administration
- 15.8.5.2.3. By Indication
- 15.8.5.2.4. By End User
- 15.8.6. BENELUX Macular Degeneration Treatment Market Analysis
- 15.8.6.1. Introduction
- 15.8.6.2. Market Analysis and Forecast by Market Taxonomy
- 15.8.6.2.1. By Drug
- 15.8.6.2.2. By Route of Administration
- 15.8.6.2.3. By Indication
- 15.8.6.2.4. By End User
- 15.8.7. Russia Macular Degeneration Treatment Market Analysis
- 15.8.7.1. Introduction
- 15.8.7.2. Market Analysis and Forecast by Market Taxonomy
- 15.8.7.2.1. By Drug
- 15.8.7.2.2. By Route of Administration
- 15.8.7.2.3. By Indication
- 15.8.7.2.4. By End User
- 15.8.1. Germany Macular Degeneration Treatment Market Analysis
16. South Asia Macular Degeneration Treatment Market Analysis 2019-2023 and Forecast 2024-2032
- 16.1. Introduction
- 16.2. Historical Market Size (US$ Mn) Trend Analysis By Market Taxonomy, 2019-2023
- 16.3. Current and Future Market Size (US$ Mn) Forecast By Market Taxonomy, 2024-2032
- 16.3.1. By Country
- 16.3.1.1. India
- 16.3.1.2. Indonesia
- 16.3.1.3. Malaysia
- 16.3.1.4. Thailand
- 16.3.1.5. Rest of South Asia
- 16.3.2. By Drug
- 16.3.3. By Route of Administration
- 16.3.4. By Indication
- 16.3.5. By End User
- 16.3.1. By Country
- 16.4. Market Attractiveness Analysis
- 16.4.1. By Country
- 16.4.2. By Drug
- 16.4.3. By Route of Administration
- 16.4.4. By Indication
- 16.4.5. By End User
- 16.5. Market Trends
- 16.6. Key Market Participants - Intensity Mapping
- 16.7. Drivers and Restraints - Impact Analysis
- 16.8. Country Level Analysis & Forecast
- 16.8.1. India Macular Degeneration Treatment Market Analysis
- 16.8.1.1. Introduction
- 16.8.1.2. Market Analysis and Forecast by Market Taxonomy
- 16.8.1.2.1. By Drug
- 16.8.1.2.2. By Route of Administration
- 16.8.1.2.3. By Indication
- 16.8.1.2.4. By End User
- 16.8.2. Indonesia Macular Degeneration Treatment Market Analysis
- 16.8.2.1. Introduction
- 16.8.2.2. Market Analysis and Forecast by Market Taxonomy
- 16.8.2.2.1. By Drug
- 16.8.2.2.2. By Route of Administration
- 16.8.2.2.3. By Indication
- 16.8.2.2.4. By End User
- 16.8.3. Malaysia Macular Degeneration Treatment Market Analysis
- 16.8.3.1. Introduction
- 16.8.3.2. Market Analysis and Forecast by Market Taxonomy
- 16.8.3.2.1. By Drug
- 16.8.3.2.2. By Route of Administration
- 16.8.3.2.3. By Indication
- 16.8.3.2.4. By End User
- 16.8.4. Thailand Macular Degeneration Treatment Market Analysis
- 16.8.4.1. Introduction
- 16.8.4.2. Market Analysis and Forecast by Market Taxonomy
- 16.8.4.2.1. By Drug
- 16.8.4.2.2. By Route of Administration
- 16.8.4.2.3. By Indication
- 16.8.4.2.4. By End User
- 16.8.1. India Macular Degeneration Treatment Market Analysis
17. East Asia Macular Degeneration Treatment Market Analysis 2019-2023 and Forecast 2024-2032
- 17.1. Introduction
- 17.2. Historical Market Size (US$ Mn) Trend Analysis By Market Taxonomy, 2019-2023
- 17.3. Current and Future Market Size (US$ Mn) Forecast By Market Taxonomy, 2024-2032
- 17.3.1. By Country
- 17.3.1.1. China
- 17.3.1.2. Japan
- 17.3.1.3. South Korea
- 17.3.2. By Drug
- 17.3.3. By Route of Administration
- 17.3.4. By Indication
- 17.3.5. By End User
- 17.3.1. By Country
- 17.4. Market Attractiveness Analysis
- 17.4.1. By Country
- 17.4.2. By Drug
- 17.4.3. By Route of Administration
- 17.4.4. By Indication
- 17.4.5. By End User
- 17.5. Market Trends
- 17.6. Key Market Participants - Intensity Mapping
- 17.7. Drivers and Restraints - Impact Analysis
- 17.8. Country Level Analysis & Forecast
- 17.8.1. China Macular Degeneration Treatment Market Analysis
- 17.8.1.1. Introduction
- 17.8.1.2. Market Analysis and Forecast by Market Taxonomy
- 17.8.1.2.1. By Drug
- 17.8.1.2.2. By Route of Administration
- 17.8.1.2.3. By Indication
- 17.8.1.2.4. By End User
- 17.8.2. Japan Macular Degeneration Treatment Market Analysis
- 17.8.2.1. Introduction
- 17.8.2.2. Market Analysis and Forecast by Market Taxonomy
- 17.8.2.2.1. By Drug
- 17.8.2.2.2. By Route of Administration
- 17.8.2.2.3. By Indication
- 17.8.2.2.4. By End User
- 17.8.3. South Korea Macular Degeneration Treatment Market Analysis
- 17.8.3.1. Introduction
- 17.8.3.2. Market Analysis and Forecast by Market Taxonomy
- 17.8.3.2.1. By Drug
- 17.8.3.2.2. By Route of Administration
- 17.8.3.2.3. By Indication
- 17.8.3.2.4. By End User
- 17.8.1. China Macular Degeneration Treatment Market Analysis
18. Oceania Macular Degeneration Treatment Market 2019-2023 and Forecast 2024-2032
- 18.1. Introduction
- 18.2. Historical Market Size (US$ Mn) Trend Analysis By Market Taxonomy, 2019-2023
- 18.3. Current and Future Market Size (US$ Mn) Forecast By Market Taxonomy, 2024-2032
- 18.3.1. By Country
- 18.3.1.1. Australia
- 18.3.1.2. New Zealand
- 18.3.2. By Drug
- 18.3.3. By Route of Administration
- 18.3.4. By Indication
- 18.3.5. By End User
- 18.3.1. By Country
- 18.4. Market Attractiveness Analysis
- 18.4.1. By Country
- 18.4.2. By Drug
- 18.4.3. By Route of Administration
- 18.4.4. By Indication
- 18.4.5. By End User
- 18.5. Market Trends
- 18.6. Key Market Participants - Intensity Mapping
- 18.7. Drivers and Restraints - Impact Analysis
- 18.8. Country Level Analysis & Forecast
- 18.8.1. Australia Macular Degeneration Treatment Market Analysis
- 18.8.1.1. Introduction
- 18.8.1.2. Market Analysis and Forecast by Market Taxonomy
- 18.8.1.2.1. By Drug
- 18.8.1.2.2. By Route of Administration
- 18.8.1.2.3. By Indication
- 18.8.1.2.4. By End User
- 18.8.2. New Zealand Macular Degeneration Treatment Market Analysis
- 18.8.2.1. Introduction
- 18.8.2.2. Market Analysis and Forecast by Market Taxonomy
- 18.8.2.2.1. By Drug
- 18.8.2.2.2. By Route of Administration
- 18.8.2.2.3. By Indication
- 18.8.2.2.4. By End User
- 18.8.1. Australia Macular Degeneration Treatment Market Analysis
19. Middle East and Africa (MEA) Macular Degeneration Treatment Market Analysis 2019-2023 and Forecast 2024-2032
- 19.1. Introduction
- 19.2. Historical Market Size (US$ Mn) Trend Analysis By Market Taxonomy, 2019-2023
- 19.3. Current and Future Market Size (US$ Mn) Forecast By Market Taxonomy, 2024-2032
- 19.3.1. By Country
- 19.3.1.1. Turkey
- 19.3.1.2. GCC Countries
- 19.3.1.3. South Africa
- 19.3.1.4. North Africa
- 19.3.1.5. Rest of Middle East and Africa
- 19.3.2. By Drug
- 19.3.3. By Route of Administration
- 19.3.4. By Indication
- 19.3.5. By End User
- 19.3.1. By Country
- 19.4. Market Attractiveness Analysis
- 19.4.1. By Country
- 19.4.2. By Drug
- 19.4.3. By Route of Administration
- 19.4.4. By Indication
- 19.4.5. By End User
- 19.5. Market Trends
- 19.6. Key Market Participants - Intensity Mapping
- 19.7. Drivers and Restraints - Impact Analysis
- 19.8. Country Level Analysis & Forecast
- 19.8.1. Turkey Macular Degeneration Treatment Market Analysis
- 19.8.1.1. Introduction
- 19.8.1.2. Market Analysis and Forecast by Market Taxonomy
- 19.8.1.2.1. By Drug
- 19.8.1.2.2. By Route of Administration
- 19.8.1.2.3. By Indication
- 19.8.1.2.4. By End User
- 19.8.2. GCC Countries Macular Degeneration Treatment Market Analysis
- 19.8.2.1. Introduction
- 19.8.2.2. Market Analysis and Forecast by Market Taxonomy
- 19.8.2.2.1. By Drug
- 19.8.2.2.2. By Route of Administration
- 19.8.2.2.3. By Indication
- 19.8.2.2.4. By End User
- 19.8.3. South Africa Macular Degeneration Treatment Market Analysis
- 19.8.3.1. Introduction
- 19.8.3.2. Market Analysis and Forecast by Market Taxonomy
- 19.8.3.2.1. By Drug
- 19.8.3.2.2. By Route of Administration
- 19.8.3.2.3. By Indication
- 19.8.3.2.4. By End User
- 19.8.4. North Africa Macular Degeneration Treatment Market Analysis
- 19.8.4.1. Introduction
- 19.8.4.2. Market Analysis and Forecast by Market Taxonomy
- 19.8.4.2.1. By Drug
- 19.8.4.2.2. By Route of Administration
- 19.8.4.2.3. By Indication
- 19.8.4.2.4. By End User
- 19.8.1. Turkey Macular Degeneration Treatment Market Analysis
20. Market Structure Analysis
- 20.1. Market Analysis by Tier of Companies
- 20.2. Market Share Analysis (%) of Top Players
- 20.3. Market Presence Analysis
- 20.3.1. By Regional footprint of Players
- 20.3.2. Product footprint by Players
- 20.3.3. Channel Foot Print by Players
21. Competition Analysis
- 21.1. Competition Dashboard
- 21.2. Competition Benchmarking
- 21.3. Competition Deep Dive (Tentative List)
- 21.3.1. F. Hoffmann-La Roche Ltd.
- 21.3.1.1. Overview
- 21.3.1.2. Product Portfolio
- 21.3.1.3. Key Financials
- 21.3.1.4. Sales Footprint
- 21.3.1.5. SWOT Analysis
- 21.3.1.6. Strategy Overview
- 21.3.2. Novartis AG
- 21.3.2.1. Overview
- 21.3.2.2. Product Portfolio
- 21.3.2.3. Key Financials
- 21.3.2.4. Sales Footprint
- 21.3.2.5. SWOT Analysis
- 21.3.2.6. Strategy Overview
- 21.3.3. Bayer AG
- 21.3.3.1. Overview
- 21.3.3.2. Product Portfolio
- 21.3.3.3. Key Financials
- 21.3.3.4. Sales Footprint
- 21.3.3.5. SWOT Analysis
- 21.3.3.6. Strategy Overview
- 21.3.4. Pfizer Inc.
- 21.3.4.1. Overview
- 21.3.4.2. Product Portfolio
- 21.3.4.3. Key Financials
- 21.3.4.4. Sales Footprint
- 21.3.4.5. SWOT Analysis
- 21.3.4.6. Strategy Overview
- 21.3.5. Bausch Health Companies Inc.
- 21.3.5.1. Overview
- 21.3.5.2. Product Portfolio
- 21.3.5.3. Key Financials
- 21.3.5.4. Sales Footprint
- 21.3.5.5. SWOT Analysis
- 21.3.5.6. Strategy Overview
- 21.3.6. Regeneron Pharmaceuticals Inc.
- 21.3.6.1. Overview
- 21.3.6.2. Product Portfolio
- 21.3.6.3. Key Financials
- 21.3.6.4. Sales Footprint
- 21.3.6.5. SWOT Analysis
- 21.3.6.6. Strategy Overview
- 21.3.7. Amgen Inc.
- 21.3.7.1. Overview
- 21.3.7.2. Product Portfolio
- 21.3.7.3. Key Financials
- 21.3.7.4. Sales Footprint
- 21.3.7.5. SWOT Analysis
- 21.3.7.6. Strategy Overview
- 21.3.8. Biogen
- 21.3.8.1. Overview
- 21.3.8.2. Product Portfolio
- 21.3.8.3. Key Financials
- 21.3.8.4. Sales Footprint
- 21.3.8.5. SWOT Analysis
- 21.3.8.6. Strategy Overview
- 21.3.9. Samsung Bioepis
- 21.3.9.1. Overview
- 21.3.9.2. Product Portfolio
- 21.3.9.3. Key Financials
- 21.3.9.4. Sales Footprint
- 21.3.9.5. SWOT Analysis
- 21.3.9.6. Strategy Overview
- 21.3.10. Santen Pharmaceutical Co., Ltd.
- 21.3.10.1. Overview
- 21.3.10.2. Product Portfolio
- 21.3.10.3. Key Financials
- 21.3.10.4. Sales Footprint
- 21.3.10.5. SWOT Analysis
- 21.3.10.6. Strategy Overview
- 21.3.1. F. Hoffmann-La Roche Ltd.

