表紙:バニリンの市場調査:製品販売の90%以上を占める合成バニリン
市場調査レポート
商品コード
1350678

バニリンの市場調査:製品販売の90%以上を占める合成バニリン

Market Study on Vanillin: Over 90% of Product Sales Accounted for by Synthetic Vanillin

出版日: | 発行: Persistence Market Research | ページ情報: 英文 370 Pages | 納期: 2~5営業日

● お客様のご希望に応じて、既存データの加工や未掲載情報(例:国別セグメント)の追加などの対応が可能です。  詳細はお問い合わせください。

価格
価格表記: USDを日本円(税抜)に換算
本日の銀行送金レート: 1USD=157.14円
バニリンの市場調査:製品販売の90%以上を占める合成バニリン
出版日: 2023年08月14日
発行: Persistence Market Research
ページ情報: 英文 370 Pages
納期: 2~5営業日
  • 全表示
  • 概要
  • 図表
  • 目次
概要

調査範囲

この調査レポートは世界のバニリン市場を分析・予測し、2023年から2033年までの市場機会や現在の市場シナリオを分析・予測します。主要な市場力学の詳細な評価と市場構造に関する包括的な情報を提供しています。この調査には、2023年から2033年の予測期間中に市場がどのように成長すると予測されるかについての詳細な洞察が含まれています。

当レポートの主な目的は、バニリンに関連する世界のビジネスの変革を支えている市場の機会に関する洞察を提供することです。常に揺れ動く経済において、読者が市場の分析と評価をよりよく理解し、この分野における有利な機会を発見できるように、全体的な推計・予測について、CAGRに加え、推定(Y-Y)前年比成長率も提供していることを考慮することは非常に重要です。

本レポートはまた、市場規模の推計と、それに対応する収益予測を絶対額で提供しています。また、市場の将来動向に基づいた実用的な洞察も提供しています。さらに、世界のバニリン市場における新規参入企業や新興企業は、効果的なビジネス上の意思決定のために本調査で提示された情報を活用することができ、世界市場だけでなく、自社のビジネスにも勢いを与えることができます。

この調査レポートは、バニリン市場のメーカー、サプライヤー、販売業者、投資家に関連するものです。すべての利害関係者、業界専門家、調査、ジャーナリスト、ビジネス研究者は、本レポートに記載されている情報やデータを活用することができます。

目次

第1章 エグゼクティブサマリー

第2章 市場概要

  • 市場カバレッジ/分類法
  • 市場の定義/範囲/制限

第3章 市場に影響を与える主要な動向

  • 研究開発・技術における戦略的な取り組み
  • 変化する食品業界情勢

第4章 主要な成功要因

  • 製品イノベーション/開発動向
  • 世界の飲食品業界におけるチャンス

第5章 世界のバニリン市場の需要

  • 市場数量分析、2018~2022年
  • 市場数量予測、2023~2033年

第6章 世界のバニリン市場- 価格分析

  • 地域別の価格動向分析
  • 世界平均価格分析ベンチマーク

第7章 世界のバニリン市場の需要

  • 市場金額分析、2018~2022年
  • 市場金額予測、2023~2033年
    • 前年比成長動向分析
    • 絶対的収益機会分析

第8章 市場の背景

  • マクロ経済的要因
  • 世界の食品および飲料業界の見通し
  • 加工食品業界の展望
  • 世界の化粧品の展望
  • 世界の動物飼料の見通し
  • ソース-バニラフレーバー
  • さまざまな供給源からのバニリン生産
  • エンドユーザー業界の需要分析
  • 業界の金額とサプライチェーンの分析
  • 主要な認証/クレーム
  • 主要な規制
  • 市場力学
  • 予測要因- 関連性と影響

第9章 由来別:世界のバニリン市場

  • イントロダクション/主な調査結果
  • 市場規模と数量分析、2018~2022年
  • 市場規模と数量分析・予測、2023~2033年
    • 自然
    • 合成
      • エチルバニリン
      • メチルバニリン
  • 由来別市場の魅力分析

第10章 用途別:世界のバニリン市場

  • イントロダクション/主な調査結果
  • 市場規模と数量分析、2018~2022年
  • 市場規模と数量分析・予測、2023~2033年
    • 食品および飲料
      • 飲料
      • 乳製品
      • ベーカリー・菓子類
    • 医薬品
    • 動物の飼料
    • タバコ香料
  • 用途別の市場魅力分析

第11章 地域別:世界のバニリン市場

  • イントロダクション
  • 市場規模と数量分析、2018~2022年
  • 市場規模と数量分析・予測、2023~2033年
    • 北米
    • ラテンアメリカ
    • 欧州
    • 東アジア
    • 南アジア
    • オセアニア
    • 中東およびアフリカ(MEA)
  • 地域別市場魅力分析

第12章 北米のバニリン市場

第13章 ラテンアメリカのバニリン市場

第14章 欧州のバニリン市場

第15章 南アジアのバニリン市場

第16章 東アジアのバニリン市場

第17章 オセアニアのバニリン市場

第18章 中東およびアフリカのバニリン市場

第19章 国別のバニリン市場分析、2022年

  • イントロダクション
  • 米国
  • カナダ
  • メキシコ
  • ブラジル
  • ドイツ
  • イタリア
  • フランス
  • 英国
  • スペイン
  • ベルギー
  • オランダ
  • ロシア
  • ポーランド
  • 中国
  • 日本
  • 韓国
  • インド
  • タイ
  • インドネシア
  • マレーシア
  • オーストラリア
  • ニュージーランド
  • アルジェリア
  • トルキエ
  • 南アフリカ

第20章 市場構造分析

  • 企業階層別の市場分析
  • 市場の集中
  • 市場プレゼンス分析

第21章 競合分析

  • 競合ダッシュボード
  • 競合の詳細
    • Apple Flavor &Fragrance Group Co., Ltd.
    • Axxence Aromatic GmbH
    • Borregaard
    • Conagen, Inc.
    • Comax MFG Corp.
    • De Monchy Aromatics
    • Ennloys
    • Evolva Holding SA
    • Factoria-Kiev Ltd
    • Jiaxing Zhonghua Chemical Co., Ltd.
    • Liaoning Shixing Pharmaceutical &Chemical Co. Ltd.
    • MOELLHAUSEN SPA
    • Omega Ingredients Ltd.
    • Prinova Group LLC.
    • Solvay SA
    • Others(on Additional Request)

第22章 使用される前提条件と略語

第23章 調査手法

図表

List of Tables

  • Table 01: Global Vanillin Market Value (US$ Mn) Analysis and Forecast by Nature, 2018-2033
  • Table 02: Global Vanillin Market Volume (Tons) Analysis and Forecast by Nature, 2018-2033
  • Table 03: Global Vanillin Market Value (US$ Mn) Analysis and Forecast by Synthetic, 2018-2033
  • Table 04: Global Vanillin Market Volume (Tons) Analysis and Forecast by Synthetic, 2018-2033
  • Table 05: Global Vanillin Market Value (US$ Mn) Analysis and Forecast by Application, 2018-2033
  • Table 06: Global Vanillin Market Volume (Tons) Analysis and Forecast by Application, 2018-2033
  • Table 07: Global Vanillin Market Value (US$ Mn) Analysis and Forecast by Food and Beverage, 2018-2033
  • Table 08: Global Vanillin Market Volume (Tons) Analysis and Forecast by Food and Beverage, 2018-2033
  • Table 09: Global Vanillin Market Value (US$ Mn) Analysis and Forecast by Region, 2018-2033
  • Table 10: Global Vanillin Market Volume (Tons) Analysis and Forecast by Region, 2018-2033
  • Table 11: North America Vanillin Market Value (US$ Mn) Analysis and Forecast by Nature, 2018-2033
  • Table 12: North America Vanillin Market Volume (Tons) Analysis and Forecast by Nature, 2018-2033
  • Table 13: North America Vanillin Market Value (US$ Mn) Analysis and Forecast by Synthetic, 2018-2033
  • Table 14: North America Vanillin Market Volume (Tons) Analysis and Forecast by Synthetic, 2018-2033
  • Table 15: North America Vanillin Market Value (US$ Mn) Analysis and Forecast by Application, 2018-2033
  • Table 16: North America Vanillin Market Volume (Tons) Analysis and Forecast by Application, 2018-2033
  • Table 17: North America Vanillin Market Value (US$ Mn) Analysis and Forecast by Food and Beverage, 2018-2033
  • Table 18: North America Vanillin Market Volume (Tons) Analysis and Forecast by Food and Beverage, 2018-2033
  • Table 19: North America Vanillin Market Value (US$ Mn) Analysis and Forecast by Country, 2018-2033
  • Table 20: North America Vanillin Market Volume (Tons) Analysis and Forecast by Country, 2018-2033
  • Table 21: Latin America Vanillin Market Value (US$ Mn) Analysis and Forecast by Nature, 2018-2033
  • Table 22: Latin America Vanillin Market Volume (Tons) Analysis and Forecast by Nature, 2018-2033
  • Table 23: Latin America Vanillin Market Value (US$ Mn) Analysis and Forecast by Synthetic, 2018-2033
  • Table 24: Latin America Vanillin Market Volume (Tons) Analysis and Forecast by Synthetic, 2018-2033
  • Table 25: Latin Vanillin Market Value (US$ Mn) Analysis and Forecast by Application, 2018-2033
  • Table 26: Latin America Vanillin Market Volume (Tons) Analysis and Forecast by Application, 2018-2033
  • Table 27: Latin America Vanillin Market Value (US$ Mn) Analysis and Forecast by Food and Beverage, 2018-2033
  • Table 28: Latin America Vanillin Market Volume (Tons) Analysis and Forecast by Food and Beverage, 2018-2033
  • Table 29: Latin America Vanillin Market Value (US$ Mn) Analysis and Forecast by Country, 2018-2033
  • Table 30: Latin America Vanillin Market Volume (Tons) Analysis and Forecast by Country, 2018-2033
  • Table 31: North America Vanillin Market Value (US$ Mn) Analysis and Forecast by Nature, 2018-2033
  • Table 32: Europe Vanillin Market Volume (Tons) Analysis and Forecast by Nature, 2018-2033
  • Table 33: North America Vanillin Market Value (US$ Mn) Analysis and Forecast by Synthetic, 2018-2033
  • Table 34: Europe Vanillin Market Volume (Tons) Analysis and Forecast by Synthetic, 2018-2033
  • Table 35: Europe Vanillin Market Value (US$ Mn) Analysis and Forecast by Application, 2018-2033
  • Table 36: Europe Vanillin Market Volume (Tons) Analysis and Forecast by Application, 2018-2033
  • Table 37: Europe Vanillin Market Value (US$ Mn) Analysis and Forecast by Food and Beverage, 2018-2033
  • Table 38: Europe Vanillin Market Volume (Tons) Analysis and Forecast by Food and Beverage, 2018-2033
  • Table 39: Europe Vanillin Market Value (US$ Mn) Analysis and Forecast by Country, 2018-2033
  • Table 40: Europe Vanillin Market Volume (Tons) Analysis and Forecast by Country, 2018-2033
  • Table 41: South Asia Vanillin Market Value (US$ Mn) Analysis and Forecast by Nature, 2018-2033
  • Table 42: South Asia Vanillin Market Volume (Tons) Analysis and Forecast by Nature, 2018-2033
  • Table 43: South Asia Vanillin Market Value (US$ Mn) Analysis and Forecast by Synthetic, 2018-2033
  • Table 44: South Asia Vanillin Market Volume (Tons) Analysis and Forecast by Synthetic, 2018-2033
  • Table 45: South Asia Vanillin Market Value (US$ Mn) Analysis and Forecast by Application, 2018-2033
  • Table 46: South Asia Vanillin Market Volume (Tons) Analysis and Forecast by Application, 2018-2033
  • Table 47: South Asia Vanillin Market Value (US$ Mn) Analysis and Forecast by Food and Beverage, 2018-2033
  • Table 48: South Asia Vanillin Market Volume (Tons) Analysis and Forecast by Food and Beverage, 2018-2033
  • Table 49: South Asia Vanillin Market Value (US$ Mn) Analysis and Forecast by Country, 2018-2033
  • Table 50: South Asia Vanillin Market Volume (Tons) Analysis and Forecast by Country, 2018-2033
  • Table 51: East Asia Vanillin Market Value (US$ Mn) Analysis and Forecast by Nature, 2018-2033
  • Table 52: East Asia Vanillin Market Volume (Tons) Analysis and Forecast by Nature, 2018-2033
  • Table 53: East Asia Vanillin Market Value (US$ Mn) Analysis and Forecast by Synthetic, 2018-2033
  • Table 54: East Asia Vanillin Market Volume (Tons) Analysis and Forecast by Synthetic, 2018-2033
  • Table 55: East Asia Vanillin Market Value (US$ Mn) Analysis and Forecast by Application, 2018-2033
  • Table 56: East Asia Vanillin Market Volume (Tons) Analysis and Forecast by Application, 2018-2033
  • Table 57: East Asia Vanillin Market Value (US$ Mn) Analysis and Forecast by Food and Beverage, 2018-2033
  • Table 58: East Asia Vanillin Market Volume (Tons) Analysis and Forecast by Food and Beverage, 2018-2033
  • Table 59: East Asia Vanillin Market Value (US$ Mn) Analysis and Forecast by Country, 2018-2033
  • Table 60: East Asia Vanillin Market Volume (Tons) Analysis and Forecast by Country, 2018-2033
  • Table 61: Oceania Vanillin Market Value (US$ Mn) Analysis and Forecast by Nature, 2018-2033
  • Table 62: Oceania Vanillin Market Volume (Tons) Analysis and Forecast by Nature, 2018-2033
  • Table 63: Oceania Vanillin Market Value (US$ Mn) Analysis and Forecast by Synthetic, 2018-2033
  • Table 64: Oceania Vanillin Market Volume (Tons) Analysis and Forecast by Synthetic, 2018-2033
  • Table 65: Oceania Vanillin Market Value (US$ Mn) Analysis and Forecast by Application, 2018-2033
  • Table 66: Oceania Vanillin Market Volume (Tons) Analysis and Forecast by Application, 2018-2033
  • Table 67: Oceania Vanillin Market Value (US$ Mn) Analysis and Forecast by Food and Beverage, 2018-2033
  • Table 68: Oceania Vanillin Market Volume (Tons) Analysis and Forecast by Food and Beverage, 2018-2033
  • Table 69: Oceania Vanillin Market Value (US$ Mn) Analysis and Forecast by Country, 2018-2033
  • Table 70: Oceania Vanillin Market Volume (Tons) Analysis and Forecast by Country, 2018-2033
  • Table 71: Middle East & Africa Vanillin Market Value (US$ Mn) Analysis and Forecast by Nature, 2018-2033
  • Table 72: Middle East & Africa Vanillin Market Volume (Tons) Analysis and Forecast by Nature, 2018-2033
  • Table 73: Middle East & Africa Vanillin Market Value (US$ Mn) Analysis and Forecast by Synthetic, 2018-2033
  • Table 74: Middle East & Africa Vanillin Market Volume (Tons) Analysis and Forecast by Synthetic, 2018-2033
  • Table 75: Middle East & Africa Vanillin Market Value (US$ Mn) Analysis and Forecast by Application, 2018-2033
  • Table 76: Middle East & Africa Vanillin Market Volume (Tons) Analysis and Forecast by Application, 2018-2033
  • Table 77: Middle East & Africa Vanillin Market Value (US$ Mn) Analysis and Forecast by Food and Beverage, 2018-2033
  • Table 78: Middle East & Africa Vanillin Market Volume (Tons) Analysis and Forecast by Food and Beverage, 2018-2033
  • Table 79: Middle East & Africa Vanillin Market Value (US$ Mn) Analysis and Forecast by Country, 2018-2033
  • Table 80: Middle East & Africa Vanillin Market Volume (Tons) Analysis and Forecast by Country, 2018-2033
  • Table 81: U.S. Vanillin Market Analysis by Value (US$) & Volume (Tons) Analysis, By Nature, 2022
  • Table 82: U.S. Vanillin Market Analysis by Value (US$) & Volume (Tons) Analysis, By Application, 2022
  • Table 83: Canada Vanillin Market Analysis by Value (US$) & Volume (Tons) Analysis, By Nature, 2022
  • Table 84: Canada Vanillin Market Analysis by Value (US$) & Volume (Tons) Analysis, By Application, 2022
  • Table 85: Brazil Vanillin Market Analysis by Value (US$) & Volume (Tons) Analysis, By Nature, 2022
  • Table 86: Brazil Vanillin Market Analysis by Value (US$) & Volume (Tons) Analysis, By Application, 2022
  • Table 87: Mexico Vanillin Market Analysis by Value (US$) & Volume (Tons) Analysis, By Nature, 2022
  • Table 88: Mexico Vanillin Market Analysis by Value (US$) & Volume (Tons) Analysis, By Application, 2022
  • Table 89: Argentina Vanillin Market Analysis by Value (US$) & Volume (Tons) Analysis, By Nature, 2022
  • Table 90: Argentina Vanillin Market Analysis by Value (US$) & Volume (Tons) Analysis, By Application, 2022
  • Table 91: Germany Vanillin Market Analysis by Value (US$) & Volume (Tons) Analysis, By Nature, 2022
  • Table 92: Germany Vanillin Market Analysis by Value (US$) & Volume (Tons) Analysis, By Application, 2022
  • Table 93: Italy Vanillin Market Analysis by Value (US$) & Volume (Tons) Analysis, By Nature, 2022
  • Table 94: Italy Vanillin Market Analysis by Value (US$) & Volume (Tons) Analysis, By Application, 2022
  • Table 95: France Vanillin Market Analysis by Value (US$) & Volume (Tons) Analysis, By Nature, 2022
  • Table 96: France Vanillin Market Analysis by Value (US$) & Volume (Tons) Analysis, By Application, 2022
  • Table 97: U.K. Vanillin Market Analysis by Value (US$) & Volume (Tons) Analysis, By Nature, 2022
  • Table 98: U.K. Vanillin Market Analysis by Value (US$) & Volume (Tons) Analysis, By Application, 2022
  • Table 99: Spain Vanillin Market Analysis by Value (US$) & Volume (Tons) Analysis, By Nature, 2022
  • Table 100: Spain Vanillin Market Analysis by Value (US$) & Volume (Tons) Analysis, By Application, 2022
  • Table 101: Belgium Vanillin Market Analysis by Value (US$) & Volume (Tons) Analysis, By Nature, 2022
  • Table 102: Belgium Vanillin Market Analysis by Value (US$) & Volume (Tons) Analysis, By Application, 2022
  • Table 103: Holland Vanillin Market Analysis by Value (US$) & Volume (Tons) Analysis, By Nature, 2022
  • Table 104: Holland Vanillin Market Analysis by Value (US$) & Volume (Tons) Analysis, By Application, 2022
  • Table 105: Russia Vanillin Market Analysis by Value (US$) & Volume (Tons) Analysis, By Nature, 2022
  • Table 106: Russia Vanillin Market Analysis by Value (US$) & Volume (Tons) Analysis, By Application, 2022
  • Table 107: Poland Vanillin Market Analysis by Value (US$) & Volume (Tons) Analysis, By Nature, 2022
  • Table 108: Poland Vanillin Market Analysis by Value (US$) & Volume (Tons) Analysis, By Application, 2022
  • Table 109: India Vanillin Market Analysis by Value (US$) & Volume (Tons) Analysis, By Nature, 2022
  • Table 110: India Vanillin Market Analysis by Value (US$) & Volume (Tons) Analysis, By Application, 2022
  • Table 111: Thailand Vanillin Market Analysis by Value (US$) & Volume (Tons) Analysis, By Nature, 2022
  • Table 112: Thailand Vanillin Market Analysis by Value (US$) & Volume (Tons) Analysis, By Application, 2022
  • Table 113: Indonesia Vanillin Market Analysis by Value (US$) & Volume (Tons) Analysis, By Nature, 2022
  • Table 114: Indonesia Vanillin Market Analysis by Value (US$) & Volume (Tons) Analysis, By Application, 2022
  • Table 115: Malaysia Vanillin Market Analysis by Value (US$) & Volume (Tons) Analysis, By Nature, 2022
  • Table 116: Malaysia Vanillin Market Analysis by Value (US$) & Volume (Tons) Analysis, By Application, 2022
  • Table 117: China Vanillin Market Analysis by Value (US$) & Volume (Tons) Analysis, By Nature, 2022
  • Table 118: China Vanillin Market Analysis by Value (US$) & Volume (Tons) Analysis, By Application, 2022
  • Table 119: Japan Vanillin Market Analysis by Value (US$) & Volume (Tons) Analysis, By Nature, 2022
  • Table 120: Japan Vanillin Market Analysis by Value (US$) & Volume (Tons) Analysis, By Application, 2022
  • Table 121: South Korea Vanillin Market Analysis by Value (US$) & Volume (Tons) Analysis, By Nature, 2022
  • Table 122: South Korea Vanillin Market Analysis by Value (US$) & Volume (Tons) Analysis, By Application, 2022
  • Table 123: Australia Vanillin Market Analysis by Value (US$) & Volume (Tons) Analysis, By Nature, 2022
  • Table 124: Australia Vanillin Market Analysis by Value (US$) & Volume (Tons) Analysis, By Application, 2022
  • Table 125: New Zealand Vanillin Market Analysis by Value (US$) & Volume (Tons) Analysis, By Nature, 2022
  • Table 126: New Zealand Vanillin Market Analysis by Value (US$) & Volume (Tons) Analysis, By Application, 2022
  • Table 127: South Africa Vanillin Market Analysis by Value (US$) & Volume (Tons) Analysis, By Nature, 2022
  • Table 128: South Africa Vanillin Market Analysis by Value (US$) & Volume (Tons) Analysis, By Application, 2022
  • Table 129: Turkiye Vanillin Market Analysis by Value (US$) & Volume (Tons) Analysis, By Nature, 2022
  • Table 130: Turkiye Vanillin Market Analysis by Value (US$) & Volume (Tons) Analysis, By Application, 2022
  • Table 131: Algeria Vanillin Market Analysis by Value (US$) & Volume (Tons) Analysis, By Nature, 2022
  • Table 132: Algeria Vanillin Market Analysis by Value (US$) & Volume (Tons) Analysis, By Application, 2022

List of Figures

  • Figure 01: Global Vanillin Market Value (US$ Mn) Forecast, 2023 -2033
  • Figure 02: Global Vanillin Market Volume (Tons) Forecast, 2023 -2033
  • Figure 03: Global Vanillin Market Value Share Analysis by Nature, 2023 E
  • Figure 04: Global Vanillin Market Y-o-Y Growth Rate by Nature, 2023-2033
  • Figure 05: Global Vanillin Market Value (US$ Mn) Analysis & Forecast by Nature, 2023-2033
  • Figure 06: Global Vanillin Market Volume (Tons) Analysis & Forecast by Nature, 2023-2033
  • Figure 07: Global Vanillin Market Value Share Analysis by Application, 2023 E
  • Figure 08: Global Vanillin Market Y-o-Y Growth Rate by Application, 2023-2033
  • Figure 09: Global Vanillin Market Value (US$ Mn) Analysis & Forecast by Application, 2023-2033
  • Figure 10: Global Vanillin Market Volume (Tons) Analysis & Forecast by Application, 2023-2033
  • Figure 11: Global Vanillin Market Value Share Analysis by Region, 2023 E
  • Figure 12: Global Vanillin Market Y-o-Y Growth Rate by Region, 2023-2033
  • Figure 13: Global Vanillin Market Value (US$ Mn) Analysis & Forecast by Region, 2023-2033
  • Figure 14: Global Vanillin Market Volume (Tons) Analysis & Forecast by Region, 2023-2033
  • Figure 15: Global Vanillin Market Attractiveness Analysis by Application, 2023-2033
  • Figure 16: Global Vanillin Market Attractiveness Analysis by Nature, 2023-2033
  • Figure 17: Global Vanillin Market Attractiveness Analysis by Region, 2023-2033
  • Figure 18: North America Vanillin Market Value (US$ Mn) Analysis & Forecast by Nature, 2023-2033
  • Figure 19: North America Vanillin Market Volume (Tons) Analysis & Forecast by Nature, 2023-2033
  • Figure 20: North America Vanillin Market Value (US$ Mn) Analysis & Forecast by Application, 2023-2033
  • Figure 21: North America Vanillin Market Volume (Tons) Analysis & Forecast by Application, 2023-2033
  • Figure 22: North America Vanillin Market Value (US$ Mn) Analysis & Forecast by Country, 2023-2033
  • Figure 23: North America Vanillin Market Volume (Tons) Analysis & Forecast by Country, 2023-2033
  • Figure 24: North America Vanillin Market Attractiveness Analysis by Application, 2023-2033
  • Figure 25: North America Vanillin Market Attractiveness Analysis by Nature, 2023-2033
  • Figure 26: North America Vanillin Market Attractiveness Analysis by Country, 2023-2033
  • Figure 27: Latin America Vanillin Market Value (US$ Mn) Analysis & Forecast by Nature, 2023-2033
  • Figure 28: Latin America Vanillin Market Volume (Tons) Analysis & Forecast by Nature, 2023-2033
  • Figure 29: Latin America Vanillin Market Value (US$ Mn) Analysis & Forecast by Application, 2023-2033
  • Figure 30: Latin America Vanillin Market Volume (Tons) Analysis & Forecast by Application, 2023-2033
  • Figure 31: Latin America Vanillin Market Value (US$ Mn) Analysis & Forecast by Country, 2023-2033
  • Figure 32: Latin America Vanillin Market Volume (Tons) Analysis & Forecast by Country, 2023-2033
  • Figure 33: Latin America Vanillin Market Attractiveness Analysis by Application, 2023-2033
  • Figure 34: Latin America Vanillin Market Attractiveness Analysis by Nature, 2023-2033
  • Figure 35: Latin America Vanillin Market Attractiveness Analysis by Country, 2023-2033
  • Figure 36: Europe Vanillin Market Value (US$ Mn) Analysis & Forecast by Nature, 2023-2033
  • Figure 37: Europe Vanillin Market Volume (Tons) Analysis & Forecast by Nature, 2023-2033
  • Figure 38: Europe Vanillin Market Value (US$ Mn) Analysis & Forecast by Application, 2023-2033
  • Figure 39: Europe Vanillin Market Volume (Tons) Analysis & Forecast by Application, 2023-2033
  • Figure 40: Europe Vanillin Market Value (US$ Mn) Analysis & Forecast by Country, 2023-2033
  • Figure 41: Europe Vanillin Market Volume (Tons) Analysis & Forecast by Country, 2023-2033
  • Figure 42: Europe Vanillin Market Attractiveness Analysis by Application, 2023-2033
  • Figure 43: Europe Vanillin Market Attractiveness Analysis by Nature, 2023-2033
  • Figure 44: Europe Vanillin Market Attractiveness Analysis by Country, 2023-2033
  • Figure 45: South Asia Vanillin Market Value (US$ Mn) Analysis & Forecast by Nature, 2023-2033
  • Figure 46: South Asia Vanillin Market Volume (Tons) Analysis & Forecast by Nature, 2023-2033
  • Figure 47: South Asia Vanillin Market Value (US$ Mn) Analysis & Forecast by Application, 2023-2033
  • Figure 48: South Asia Vanillin Market Volume (Tons) Analysis & Forecast by Application, 2023-2033
  • Figure 49: South Asia Vanillin Market Value (US$ Mn) Analysis & Forecast by Country, 2023-2033
  • Figure 50: South Asia Vanillin Market Volume (Tons) Analysis & Forecast by Country, 2023-2033
  • Figure 51: South Asia Vanillin Market Attractiveness Analysis by Country, 2023-2033
  • Figure 52: South Asia Vanillin Market Attractiveness Analysis by Nature, 2023-2033
  • Figure 53: South Asia Vanillin Market Attractiveness Analysis by Source, 2023-2033
  • Figure 54: East Asia Vanillin Market Value (US$ Mn) Analysis & Forecast by Nature, 2023-2033
  • Figure 55: East Asia Vanillin Market Volume (Tons) Analysis & Forecast by Nature, 2023-2033
  • Figure 56: East Asia Vanillin Market Value (US$ Mn) Analysis & Forecast by Application, 2023-2033
  • Figure 57: East Asia Vanillin Market Volume (Tons) Analysis & Forecast by Application, 2023-2033
  • Figure 58: East Asia Vanillin Market Value (US$ Mn) Analysis & Forecast by Country, 2023-2033
  • Figure 59: East Asia Vanillin Market Volume (Tons) Analysis & Forecast by Country, 2023-2033
  • Figure 60: East Asia Vanillin Market Attractiveness Analysis by Application, 2023-2033
  • Figure 61: East Asia Vanillin Market Attractiveness Analysis by Nature, 2023-2033
  • Figure 62: East Asia Vanillin Market Attractiveness Analysis by Country, 2023-2033
  • Figure 63: Oceania Vanillin Market Value (US$ Mn) Analysis & Forecast by Nature, 2023-2033
  • Figure 64: Oceania Vanillin Market Volume (Tons) Analysis & Forecast by Nature, 2023-2033
  • Figure 65: Oceania Vanillin Market Value (US$ Mn) Analysis & Forecast by Application, 2023-2033
  • Figure 66: Oceania Vanillin Market Volume (Tons) Analysis & Forecast by Application, 2023-2033
  • Figure 67: Oceania Vanillin Market Value (US$ Mn) Analysis & Forecast by Country, 2023-2033
  • Figure 68: Oceania Vanillin Market Volume (Tons) Analysis & Forecast by Country, 2023-2033
  • Figure 69: Oceania Vanillin Market Attractiveness Analysis by Application, 2023-2033
  • Figure 70: Oceania Vanillin Market Attractiveness Analysis by Nature, 2023-2033
  • Figure 71: Oceania Vanillin Market Attractiveness Analysis by Country, 2023-2033
  • Figure 72: Middle East & Africa Vanillin Market Value (US$ Mn) Analysis & Forecast by Nature, 2023-2033
  • Figure 73: Middle East & Africa Vanillin Market Volume (Tons) Analysis & Forecast by Nature, 2023-2033
  • Figure 74: Middle East & Africa Vanillin Market Value (US$ Mn) Analysis & Forecast by Application, 2023-2033
  • Figure 75: Middle East & Africa Vanillin Market Volume (Tons) Analysis & Forecast by Application, 2023-2033
  • Figure 76: Middle East & Africa Vanillin Market Value (US$ Mn) Analysis & Forecast by Country, 2023-2033
  • Figure 77: Middle East & Africa Vanillin Market Volume (Tons) Analysis & Forecast by Country, 2023-2033
  • Figure 78: Middle East & Africa Vanillin Market Attractiveness Analysis by Application, 2023-2033
  • Figure 79: Middle East & Africa Vanillin Market Attractiveness Analysis by Nature, 2023-2033
  • Figure 80: Middle East & Africa Vanillin Market Attractiveness Analysis by Country, 2023-2033
目次
Product Code: PMRREP33536

Report Scope

A latest market report by Persistence Market Research on the global vanillin market evaluates the opportunities and current market scenario, providing insights and updates about corresponding segments involved in the market for the forecast period of 2023 to 2033. The report provides a detailed assessment of key market dynamics and comprehensive information about the structure of the market. This study contains detailed insights into how the market is anticipated to grow during the forecast period of 2023-2033.

The primary objective of the report is to provide insights regarding opportunities in the market that are supporting the transformation of global businesses associated with vanillin. It is very important to consider that, in an ever-wavering economy, we provide estimated (Y-o-Y) year-on-year growth rate in addition to the compound annual growth rate (CAGR) for overall forecasts, to enable readers had better understand the analysis and evaluation of the market, and to discover lucrative opportunities in this space.

This report also provides an estimate of market size and corresponding revenue forecasts carried out in terms of absolute $ opportunity. It also offers actionable insights based on the future trends in the market. Furthermore, new and emerging players in the global vanillin market can make use of the information presented in the study for effective business decisions, which will provide momentum to their businesses as well as the global market.

The study is relevant for manufacturers, suppliers, distributors, and investors in the vanillin market. All stakeholders, as well as industry experts, researchers, journalists, and business researchers, can leverage the information and data represented in the report.

Key Market Segments

Persistence Market Research's report on the global vanillin market offers information divided into three segments - nature, application, and region.

Attribute Details

Nature

  • Natural
  • Synthetic
    • Ethyl Vanillin
    • Methyl Vanillin

Application

  • Food & Beverages
    • Beverages
    • Dairy
    • Bakery & Confectionery
  • Pharmaceuticals
  • Animal Feed
  • Tobacco Flavoring

Region

  • North America
  • Latin America
  • Europe
  • East Asia
  • South Asia
  • Oceania
  • Middle East & Africa

Key Questions Answered in Study:

  • Which region will hold the highest market share over the forecast period?
  • Which regional market is experiencing the highest growth (CAGR)?
  • Which factors are impacting the global vanillin market?
  • What are the global trends impacting the market?
  • What strategies must emerge players adopt to capture opportunities in various regions in the market?
  • What is the structure of the global vanillin market?

Research Methodology

Persistence Market Research is committed to providing unbiased market research solutions to its clients. The company follows a robust methodology for the deduction of data included in this report. A unique research methodology is utilized to conduct extensive research on the global vanillin market, and reach conclusions about the future growth factors of the market. The research methodology comprises primary research methods coupled with secondary research methods, which ensures the accuracy and reliability of the conclusions in this report.

A demand-side approach is followed to estimate the sales of target products, followed by an in-depth supply-side assessment of value generated, key trends, and events over a predefined period. This methodology is based on standard market structures, methods, and definitions that are based on inputs from local sources in over seven regions - North America, Latin America, Europe, East Asia, South Asia, Oceania, and Middle East & Africa, which Persistence Market Research considers for segmenting the global market. Statistics, characteristics, and variances are collected at a regional level, aggregated at the same level, and then synthesized at a worldwide level, to create global market measurements.

Our main sources of research include:

  • Primary Research
  • Secondary Research
  • Trade Research
  • Social Media Research

Table of Contents

1. Executive Summary

  • 1.1. Global Market Outlook
  • 1.2. Demand Side Trends
  • 1.3. Supply Side Trends
  • 1.4. Analysis and Recommendations

2. Market Overview

  • 2.1. Market Coverage / Taxonomy
  • 2.2. Market Definition / Scope / Limitations

3. Key Trends Impacting the Market

  • 3.1. Strategic initiatives in R&D and technology
  • 3.2. Shifting Food industry landscape

4. Key Success Factors

  • 4.1. Product Innovation / Development Trends
  • 4.2. Opportunities in Global Food & Beverage Industry

5. Global Vanillin Market Demand Analysis 2018-2022 and Forecast, 2023-2033

  • 5.1. Historical Market Volume (Tons) Analysis, 2018-2022
  • 5.2. Current and Future Market Volume (Tons) Projections, 2023-2033

6. Global Vanillin Market - Pricing Analysis

  • 6.1. Regional Pricing Trend Analysis
  • 6.2. Global Average Pricing Analysis Benchmark

7. Global Vanillin Market Demand (in Value or Size in US$ Mn) Analysis 2018-2022 and Forecast, 2023-2033

  • 7.1. Historical Market Value (US$ Mn) Analysis, 2018-2022
  • 7.2. Current and Future Market Value (US$ Mn) Projections, 2023-2033
    • 7.2.1. Y-o-Y Growth Trend Analysis
    • 7.2.2. Absolute $ Opportunity Analysis

8. Market Background

  • 8.1. Macro-Economic Factors
    • 8.1.1. Global GDP Growth Outlook
    • 8.1.2. Global Industry Value Added
    • 8.1.3. Global Urbanization Growth Outlook
    • 8.1.4. Global Food Security Index Outlook
    • 8.1.5. Global Rank - Ease of Doing Business
    • 8.1.6. Global Rank - Trading Across Borders
  • 8.2. Global Food and Beverage Industry Outlook
  • 8.3. Processed Food Industry Outlook
  • 8.4. Global Cosmetic Outlook
  • 8.5. Global Animal Feed Outlook
  • 8.6. Sources- Vanilla Flavors
  • 8.7. Vanillin Production from Different Sources
  • 8.8. End User Industry Demand Analysis
  • 8.9. Industry Value and Supply Chain Analysis
    • 8.9.1. Profit Margin Analysis at each point of sales
    • 8.9.2. Distributors/Suppliers/Wholesalers
    • 8.9.3. Traders/Retailers
    • 8.9.4. End-Users
  • 8.10. Key Certifications/Claims
  • 8.11. Key Regulations
  • 8.12. Market Dynamics
    • 8.12.1. Drivers
    • 8.12.2. Restraints
    • 8.12.3. Opportunity Analysis
  • 8.13. Forecast Factors - Relevance & Impact

9. Global Vanillin Market Analysis 2018-2022 and Forecast 2023-2033, By Nature

  • 9.1. Introduction / Key Findings
  • 9.2. Historical Market Size (US$ Mn) and Volume (Tons) Analysis By Nature, 2018-2022
  • 9.3. Current and Future Market Size (US$ Mn) and Volume (Tons) Analysis and Forecast By Nature, 2023-2033
    • 9.3.1. Natural
    • 9.3.2. Synthetic
      • 9.3.2.1. Ethyl Vanillin
      • 9.3.2.2. Methyl Vanillin
  • 9.4. Market Attractiveness Analysis By Nature

10. Global Vanillin Market Analysis 2018-2022 and Forecast 2023-2033, By Application

  • 10.1. Introduction / Key Findings
  • 10.2. Historical Market Size (US$ Mn) and Volume (Tons) Analysis By Application, 2018-2022
  • 10.3. Current and Future Market Size (US$ Mn) and Volume (Tons) Analysis and Forecast By Application, 2023-2033
    • 10.3.1. Food and Beverage
      • 10.3.1.1. Beverage
      • 10.3.1.2. Dairy
      • 10.3.1.3. Bakery & Confectionery
    • 10.3.2. Pharmaceutical
    • 10.3.3. Animal Feed
    • 10.3.4. Tobacco Flavoring
  • 10.4. Market Attractiveness Analysis By Application

11. Global Vanillin Market Analysis 2018-2022 and Forecast 2023-2033, by Region

  • 11.1. Introduction
  • 11.2. Historical Market Size (US$ Mn) and Volume (Tons) Analysis By Region, 2018-2022
  • 11.3. Current Market Size (US$ Mn) and Volume (Tons) Analysis and Forecast By Region, 2023-2033
    • 11.3.1. North America
    • 11.3.2. Latin America
    • 11.3.3. Europe
    • 11.3.4. East Asia
    • 11.3.5. South Asia
    • 11.3.6. Oceania
    • 11.3.7. Middle East and Africa (MEA)
  • 11.4. Market Attractiveness Analysis By Region

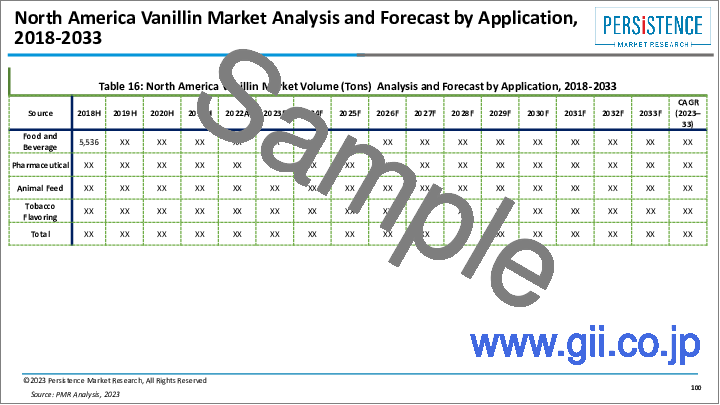
12. North America Vanillin Market Analysis 2018-2022 and Forecast 2023-2033

  • 12.1. Introduction
  • 12.2. Historical Market Size (US$ Mn) and Volume (Tons) Trend Analysis By Market Taxonomy, 2018-2022
  • 12.3. Market Size (US$ Mn) and Volume (Tons) Forecast By Market Taxonomy, 2023-2033
    • 12.3.1. By Country
      • 12.3.1.1. U.S.
      • 12.3.1.2. Canada
    • 12.3.2. By Nature
    • 12.3.3. By Application
  • 12.4. Market Attractiveness Analysis
    • 12.4.1. By Country
    • 12.4.2. By Nature
    • 12.4.3. By Application
  • 12.5. Drivers and Restraints - Impact Analysis

13. Latin America Vanillin Market Analysis 2018-2022 and Forecast 2023-2033

  • 13.1. Introduction
  • 13.2. Historical Market Size (US$ Mn) and Volume (Tons) Trend Analysis By Market Taxonomy, 2018-2022
  • 13.3. Market Size (US$ Mn) and Volume (Tons) Forecast By Market Taxonomy, 2023-2033
    • 13.3.1. By Country
      • 13.3.1.1. Brazil
      • 13.3.1.2. Mexico
      • 13.3.1.3. Argentina
      • 13.3.1.4. Rest of Latin America
    • 13.3.2. By Nature
    • 13.3.3. By Application
  • 13.4. Market Attractiveness Analysis
    • 13.4.1. By Country
    • 13.4.2. By Nature
    • 13.4.3. By Application
  • 13.5. Drivers and Restraints - Impact Analysis

14. Europe Vanillin Market Analysis 2018-2022 and Forecast 2023-2033

  • 14.1. Introduction
  • 14.2. Historical Market Size (US$ Mn) and Volume (Tons) Trend Analysis By Market Taxonomy, 2018-2022
  • 14.3. Market Size (US$ Mn) and Volume (Tons) Forecast By Market Taxonomy, 2023-2033
    • 14.3.1. By Country
      • 14.3.1.1. Germany
      • 14.3.1.2. Italy
      • 14.3.1.3. France
      • 14.3.1.4. U.K.
      • 14.3.1.5. Spain
      • 14.3.1.6. Belgium
      • 14.3.1.7. Holland
      • 14.3.1.8. Russia
      • 14.3.1.9. Poland
      • 14.3.1.10. Rest of Europe
    • 14.3.2. By Nature
    • 14.3.3. By Application
  • 14.4. Market Attractiveness Analysis
    • 14.4.1. By Country
    • 14.4.2. By Nature
    • 14.4.3. By Application
  • 14.5. Drivers and Restraints - Impact Analysis

15. South Asia Vanillin Market Analysis 2018-2022 and Forecast 2023-2033

  • 15.1. Introduction
  • 15.2. Historical Market Size (US$ Mn) and Volume (Tons) Trend Analysis By Market Taxonomy, 2018-2022
  • 15.3. Market Size (US$ Mn) and Volume (Tons) Forecast By Market Taxonomy, 2023-2033
    • 15.3.1. By Country
      • 15.3.1.1. India
      • 15.3.1.2. Thailand
      • 15.3.1.3. Indonesia
      • 15.3.1.4. Malaysia
      • 15.3.1.5. Rest of South Asia
    • 15.3.2. By Nature
    • 15.3.3. By Application
  • 15.4. Market Attractiveness Analysis
    • 15.4.1. By Country
    • 15.4.2. By Nature
    • 15.4.3. By Application
  • 15.5. Drivers and Restraints - Impact Analysis

16. East Asia Vanillin Market Analysis 2018-2022 and Forecast 2023-2033

  • 16.1. Introduction
  • 16.2. Historical Market Size (US$ Mn) and Volume (Tons) Trend Analysis By Market Taxonomy, 2018-2022
  • 16.3. Market Size (US$ Mn) and Volume (Tons) Forecast By Market Taxonomy, 2023-2033
    • 16.3.1. By Country
      • 16.3.1.1. China
      • 16.3.1.2. Japan
      • 16.3.1.3. South Korea
    • 16.3.2. By Nature
    • 16.3.3. By Application
  • 16.4. Market Attractiveness Analysis
    • 16.4.1. By Country
    • 16.4.2. By Nature
    • 16.4.3. By Application
  • 16.5. Drivers and Restraints - Impact Analysis

17. Oceania Vanillin Market Analysis 2018-2022 and Forecast 2023-2033

  • 17.1. Introduction
  • 17.2. Historical Market Size (US$ Mn) and Volume (Tons) Trend Analysis By Market Taxonomy, 2018-2022
  • 17.3. Market Size (US$ Mn) and Volume (Tons) Forecast By Market Taxonomy, 2023-2033
    • 17.3.1. By Country
      • 17.3.1.1. Australia
      • 17.3.1.2. New Zealand
    • 17.3.2. By Nature
    • 17.3.3. By Application
  • 17.4. Market Attractiveness Analysis
    • 17.4.1. By Country
    • 17.4.2. By Nature
    • 17.4.3. By Application
  • 17.5. Drivers and Restraints - Impact Analysis

18. Middle East and Africa Vanillin Market Analysis 2018-2022 and Forecast 2023-2033

  • 18.1. Introduction
  • 18.2. Historical Market Size (US$ Mn) and Volume (Tons) Trend Analysis By Market Taxonomy, 2018-2022
  • 18.3. Market Size (US$ Mn) and Volume (Tons) Forecast By Market Taxonomy, 2023-2033
    • 18.3.1. By Country
      • 18.3.1.1. GCC Countries
      • 18.3.1.2. Turkiye
      • 18.3.1.3. Algeria
      • 18.3.1.4. South Africa
      • 18.3.1.5. Rest of Middle East and Africa
    • 18.3.2. By Nature
    • 18.3.3. By Application
  • 18.4. Market Attractiveness Analysis
    • 18.4.1. By Country
    • 18.4.2. By Nature
    • 18.4.3. By Application
  • 18.5. Drivers and Restraints - Impact Analysis

19. Country Wise Vanillin Market Analysis, 2022

  • 19.1. Introduction
    • 19.1.1. Market Value Proportion Analysis, By Key Countries
    • 19.1.2. Global Vs. Country Growth Comparison
  • 19.2. U.S. Vanillin Market Analysis
    • 19.2.1. By Nature
    • 19.2.2. By Application
  • 19.3. Canada Vanillin Market Analysis
    • 19.3.1. By Nature
    • 19.3.2. By Application
  • 19.4. Mexico Vanillin Market Analysis
    • 19.4.1. By Nature
    • 19.4.2. By Application
  • 19.5. Brazil Vanillin Market Analysis
    • 19.5.1. By Nature
    • 19.5.2. By Application
  • 19.6. Germany Vanillin Market Analysis
    • 19.6.1. By Nature
    • 19.6.2. By Application
  • 19.7. Italy Vanillin Market Analysis
    • 19.7.1. By Nature
    • 19.7.2. By Application
  • 19.8. France Vanillin Market Analysis
    • 19.8.1. By Nature
    • 19.8.2. By Application
  • 19.9. U.K. Vanillin Market Analysis
    • 19.9.1. By Nature
    • 19.9.2. By Application
  • 19.10. Spain Vanillin Market Analysis
    • 19.10.1. By Nature
    • 19.10.2. By Application
  • 19.11. Belgium Vanillin Market Analysis
    • 19.11.1. By Nature
    • 19.11.2. By Application
  • 19.12. Holland Vanillin Market Analysis
    • 19.12.1. By Nature
    • 19.12.2. By Application
  • 19.13. Russia Vanillin Market Analysis
    • 19.13.1. By Nature
    • 19.13.2. By Application
  • 19.14. Poland Vanillin Market Analysis
    • 19.14.1. By Nature
    • 19.14.2. By Application
  • 19.15. China Vanillin Market Analysis
    • 19.15.1. By Nature
    • 19.15.2. By Application
  • 19.16. Japan Vanillin Market Analysis
    • 19.16.1. By Nature
    • 19.16.2. By Application
  • 19.17. South Korea Vanillin Market Analysis
    • 19.17.1. By Nature
    • 19.17.2. By Application
  • 19.18. India Vanillin Market Analysis
    • 19.18.1. By Nature
    • 19.18.2. By Application
  • 19.19. Thailand Vanillin Market Analysis
    • 19.19.1. By Nature
    • 19.19.2. By Application
  • 19.20. Indonesia Vanillin Market Analysis
    • 19.20.1. By Nature
    • 19.20.2. By Application
  • 19.21. Malaysia Vanillin Market Analysis
    • 19.21.1. By Nature
    • 19.21.2. By Application
  • 19.22. Australia Vanillin Market Analysis
    • 19.22.1. By Nature
    • 19.22.2. By Application
  • 19.23. New Zealand Vanillin Market Analysis
    • 19.23.1. By Nature
    • 19.23.2. By Application
  • 19.24. Algeria Vanillin Market Analysis
    • 19.24.1. By Nature
    • 19.24.2. By Application
  • 19.25. Turkiye Vanillin Market Analysis
    • 19.25.1. By Nature
    • 19.25.2. By Application
  • 19.26. South Africa Vanillin Market Analysis
    • 19.26.1. By Nature
    • 19.26.2. By Application

20. Market Structure Analysis

  • 20.1. Market Analysis by Tier of Companies
  • 20.2. Market Concentration
  • 20.3. Market Presence Analysis

21. Competition Analysis

  • 21.1. Competition Dashboard
  • 21.2. Competition Deep Dive
    • 21.2.1. Apple Flavor & Fragrance Group Co., Ltd.
      • 21.2.1.1. Overview
      • 21.2.1.2. Product Portfolio
      • 21.2.1.3. Sales Footprint
      • 21.2.1.4. Key Developments
      • 21.2.1.5. Strategy Overview
    • 21.2.2. Axxence Aromatic GmbH
      • 21.2.2.1. Overview
      • 21.2.2.2. Product Portfolio
      • 21.2.2.3. Sales Footprint
      • 21.2.2.4. Key Developments
      • 21.2.2.5. Strategy Overview
    • 21.2.3. Borregaard
      • 21.2.3.1. Overview
      • 21.2.3.2. Product Portfolio
      • 21.2.3.3. Sales Footprint
      • 21.2.3.4. Key Developments
      • 21.2.3.5. Strategy Overview
    • 21.2.4. Conagen, Inc.
      • 21.2.4.1. Overview
      • 21.2.4.2. Product Portfolio
      • 21.2.4.3. Sales Footprint
      • 21.2.4.4. Key Developments
      • 21.2.4.5. Strategy Overview
    • 21.2.5. Comax MFG Corp.
      • 21.2.5.1. Overview
      • 21.2.5.2. Product Portfolio
      • 21.2.5.3. Sales Footprint
      • 21.2.5.4. Key Developments
      • 21.2.5.5. Strategy Overview
    • 21.2.6. De Monchy Aromatics
      • 21.2.6.1. Overview
      • 21.2.6.2. Product Portfolio
      • 21.2.6.3. Sales Footprint
      • 21.2.6.4. Key Developments
      • 21.2.6.5. Strategy Overview
    • 21.2.7. Ennloys
      • 21.2.7.1. Overview
      • 21.2.7.2. Product Portfolio
      • 21.2.7.3. Sales Footprint
      • 21.2.7.4. Key Developments
      • 21.2.7.5. Strategy Overview
    • 21.2.8. Evolva Holding SA
      • 21.2.8.1. Overview
      • 21.2.8.2. Product Portfolio
      • 21.2.8.3. Sales Footprint
      • 21.2.8.4. Key Developments
      • 21.2.8.5. Strategy Overview
    • 21.2.9. Factoria-Kiev Ltd
      • 21.2.9.1. Overview
      • 21.2.9.2. Product Portfolio
      • 21.2.9.3. Sales Footprint
      • 21.2.9.4. Key Developments
      • 21.2.9.5. Strategy Overview
    • 21.2.10. Jiaxing Zhonghua Chemical Co., Ltd.
      • 21.2.10.1. Overview
      • 21.2.10.2. Product Portfolio
      • 21.2.10.3. Sales Footprint
      • 21.2.10.4. Key Developments
      • 21.2.10.5. Strategy Overview
    • 21.2.11. Liaoning Shixing Pharmaceutical & Chemical Co. Ltd.
      • 21.2.11.1. Overview
      • 21.2.11.2. Product Portfolio
      • 21.2.11.3. Sales Footprint
      • 21.2.11.4. Key Developments
      • 21.2.11.5. Strategy Overview
    • 21.2.12. MOELLHAUSEN S.P.A.
      • 21.2.12.1. Overview
      • 21.2.12.2. Product Portfolio
      • 21.2.12.3. Sales Footprint
      • 21.2.12.4. Key Developments
      • 21.2.12.5. Strategy Overview
    • 21.2.13. Omega Ingredients Ltd.
      • 21.2.13.1. Overview
      • 21.2.13.2. Product Portfolio
      • 21.2.13.3. Sales Footprint
      • 21.2.13.4. Key Developments
      • 21.2.13.5. Strategy Overview
    • 21.2.14. Prinova Group LLC.
      • 21.2.14.1. Overview
      • 21.2.14.2. Product Portfolio
      • 21.2.14.3. Sales Footprint
      • 21.2.14.4. Key Developments
      • 21.2.14.5. Strategy Overview
    • 21.2.15. Solvay SA
      • 21.2.15.1. Overview
      • 21.2.15.2. Product Portfolio
      • 21.2.15.3. Sales Footprint
      • 21.2.15.4. Key Developments
      • 21.2.15.5. Strategy Overview
    • 21.2.16. Others (on Additional Request)
      • 21.2.16.1. Overview
      • 21.2.16.2. Product Portfolio
      • 21.2.16.3. Sales Footprint
      • 21.2.16.4. Key Developments
      • 21.2.16.5. Strategy Overview

22. Assumptions and Acronyms Used

23. Research Methodology