|
|
市場調査レポート
商品コード
1744437
融資向け生成AIの世界市場の評価:展開方式別、タイプ別、エンドユーザー別、地域別、機会、予測(2018年~2032年)Global Generative AI in Lending Market Assessment, By Deployment Mode, By Type, By End-user, By Region, Opportunities and Forecast, 2018-2032F |
||||||
|
|||||||
カスタマイズ可能
|
|||||||

| 融資向け生成AIの世界市場の評価:展開方式別、タイプ別、エンドユーザー別、地域別、機会、予測(2018年~2032年) |
|
出版日: 2025年06月10日
発行: Markets & Data
ページ情報: 英文 222 Pages
納期: 3~5営業日
|

全表示
- 概要
- 図表
- 目次
世界の融資向け生成AIの市場規模は、複数の要因による革命的な拡大により、2024年の25億8,000万米ドルから2032年に82億7,000万米ドルに達すると予測され、2025年~2032年の予測期間にCAGRで15.67%の成長が見込まれます。主な促進要因の1つは、キャッシュフローパターン、公共料金の決済、さらには行動指標などの代替データソースをスキャンする精巧なリスク評価モデルによって与信の意思決定を向上させ、従来のスコアリング手法よりも優れた予測を実現する技術の能力です。この技術革新は、金融包摂の文脈において特別な価値を持ち、金融業者はポートフォリオの質を落とすことなく、これまでサービスを受けていなかった借り手にもサービスを提供できるようになります。第二の大きな要因は融資プロセスの自動化で、AIが申込処理、査定、不正検知を最適化することで、承認にかかる時間を数日から数分に短縮し、営業経費を削減します。
新たなガイドラインでは、説明可能なAIとアルゴリズムの透明性が求められており、金融機関は先進の規制に準拠したシステムへの投資を余儀なくされています。オーダーメイドの金融商品に対する消費者の選好も採用を後押ししており、生成AIはローンの動的な価格設定や返済条件のカスタマイズを可能にしています。しかし、データプライバシーの問題、実装コスト、それらを開発する熟練したAI開発者の不足といった脅威が、採用速度を一時的に減速させるとみられます。競合環境は、旧来の銀行、フィンテックスタートアップ、主要ハイテク企業がこぞってこうしたソリューションの展開に乗り出したことで過熱しており、技術が成熟してより明確なROIが示されるにつれて、さらなる爆発的成長が見込まれます。
例えば2025年4月、LendingClub Corporationは、AIを活用した支出インテリジェンスプラットフォームであるCushionの知的財産と選りすぐりの人材の買収を発表しました。CushionのAIを活用した技術は、利用者の銀行取引や購買情報を取り込み、請求書の追跡、決済期日の厳守、サブスクリプションの管理、信用構築、BNPL(Buy Now, Pay Later)ローンのモニタリングなどを支援します。
当レポートでは、世界の融資向け生成AI市場について調査分析し、市場規模と予測、市場力学、主要企業の情勢などを提供しています。
目次
第1章 プロジェクトの範囲と定義
第2章 調査手法
第3章 米国関税の影響
第4章 エグゼクティブサマリー
第5章 顧客の声
- 回答者の人口統計
- 融資向け生成AIの認識と理解
- 採用の促進要因と障壁
- 推奨される展開モデルと用途
第6章 世界の融資向け生成AI市場の見通し(2018年~2032年)
- 市場規模の分析と予測
- 金額
- 市場シェアの分析と予測
- 展開方式別
- クラウド
- オンプレミス
- タイプ別
- 信用スコアリング
- ローン組成
- リスク評価
- 不正行為検出
- カスタマーサービス
- その他
- エンドユーザー別
- 銀行
- 信用組合
- フィンテック企業
- その他
- 地域別
- 北米
- 欧州
- アジア太平洋
- 南米
- 中東・アフリカ
- 展開方式別
- 市場マップ分析(2024年)
- 展開方式別
- タイプ別
- エンドユーザー別
- 地域別
第7章 北米の融資向け生成AI市場の見通し(2018年~2032年)
- 市場規模の分析と予測
- 金額
- 市場シェアの分析と予測
- 展開方式別
- クラウド
- オンプレミス
- タイプ別
- 信用スコアリング
- ローン組成
- リスク評価
- 不正行為検出
- カスタマーサービス
- その他
- エンドユーザー別
- 銀行
- 信用組合
- フィンテック企業
- その他
- シェア:国別
- 米国
- カナダ
- メキシコ
- 展開方式別
- 各国の市場の評価
- 米国の融資向け生成AI市場の見通し(2018年~2032年)
- 市場規模の分析と予測
- 市場シェアの分析と予測
- カナダ
- メキシコ
- 米国の融資向け生成AI市場の見通し(2018年~2032年)
第8章 欧州の融資向け生成AI市場の見通し(2018年~2032年)
- ドイツ
- フランス
- イタリア
- 英国
- ロシア
- オランダ
- スペイン
- トルコ
- ポーランド
第9章 アジア太平洋の融資向け生成AI市場の見通し(2018年~2032年)
- インド
- 中国
- 日本
- オーストラリア
- ベトナム
- 韓国
- インドネシア
- フィリピン
第10章 南米の融資向け生成AI市場の見通し(2018年~2032年)
- ブラジル
- アルゼンチン
第11章 中東・アフリカの融資向け生成AI市場の見通し(2018年~2032年)
- サウジアラビア
- アラブ首長国連邦
- 南アフリカ
第12章 需給分析
第13章 バリューチェーン分析
第14章 ポーターのファイブフォース分析
第15章 PESTLE分析
第16章 市場力学
- 市場促進要因
- 市場の課題
第17章 市場動向と発展
第18章 政策と規制情勢
第19章 ケーススタディ
第20章 競合情勢
- マーケットリーダー上位5社の競合マトリクス
- 上位5社のSWOT分析
- 主要企業上位10社の情勢
- Microsoft Corporation
- IBM Corporation
- Google LLC
- Amazon Web Services, Inc.
- Salesforce, Inc.
- Oracle Corporation
- SAP SE
- Zest AI, Inc.
- Scienaptic Systems Inc.
- SymphonyAI LLC
第21章 戦略的提言
第22章 調査会社について・免責事項
List of Tables
- Table 1. Competition Matrix of Top 5 Market Leaders
- Table 2. Mergers & Acquisitions/ Joint Ventures (If Applicable)
- Table 3. About Us - Regions and Countries Where We Have Executed Client Projects
List of Figures
- Figure 1. Global Generative AI in Lending Market, By Value, In USD Billion, 2018-2032F
- Figure 2. Global Generative AI in Lending Market Share (%), By Deployment Mode, 2018-2032F
- Figure 3. Global Generative AI in Lending Market Share (%), By Type, 2018-2032F
- Figure 4. Global Generative AI in Lending Market Share (%), By End-user, 2018-2032F
- Figure 5. Global Generative AI in Lending Market Share (%), By Region, 2018-2032F
- Figure 6. North America Generative AI in Lending Market, By Value, In USD Billion, 2018-2032F
- Figure 7. North America Generative AI in Lending Market Share (%), By Deployment Mode, 2018-2032F
- Figure 8. North America Generative AI in Lending Market Share (%), By Type, 2018-2032F
- Figure 9. North America Generative AI in Lending Market Share (%), By End-user, 2018-2032F
- Figure 10. North America Generative AI in Lending Market Share (%), By Country, 2018-2032F
- Figure 11. United States Generative AI in Lending Market, By Value, In USD Billion, 2018-2032F
- Figure 12. United States Generative AI in Lending Market Share (%), By Deployment Mode, 2018-2032F
- Figure 13. United States Generative AI in Lending Market Share (%), By Type, 2018-2032F
- Figure 14. United States Generative AI in Lending Market Share (%), By End-user, 2018-2032F
- Figure 15. Canada Generative AI in Lending Market, By Value, In USD Billion, 2018-2032F
- Figure 16. Canada Generative AI in Lending Market Share (%), By Deployment Mode, 2018-2032F
- Figure 17. Canada Generative AI in Lending Market Share (%), By Type, 2018-2032F
- Figure 18. Canada Generative AI in Lending Market Share (%), By End-user, 2018-2032F
- Figure 19. Mexico Generative AI in Lending Market, By Value, In USD Billion, 2018-2032F
- Figure 20. Mexico Generative AI in Lending Market Share (%), By Deployment Mode, 2018-2032F
- Figure 21. Mexico Generative AI in Lending Market Share (%), By Type, 2018-2032F
- Figure 22. Mexico Generative AI in Lending Market Share (%), By End-user, 2018-2032F
- Figure 23. Europe Generative AI in Lending Market, By Value, In USD Billion, 2018-2032F
- Figure 24. Europe Generative AI in Lending Market Share (%), By Deployment Mode, 2018-2032F
- Figure 25. Europe Generative AI in Lending Market Share (%), By Type, 2018-2032F
- Figure 26. Europe Generative AI in Lending Market Share (%), By End-user, 2018-2032F
- Figure 27. Europe Generative AI in Lending Market Share (%), By Country, 2018-2032F
- Figure 28. Germany Generative AI in Lending Market, By Value, In USD Billion, 2018-2032F
- Figure 29. Germany Generative AI in Lending Market Share (%), By Deployment Mode, 2018-2032F
- Figure 30. Germany Generative AI in Lending Market Share (%), By Type, 2018-2032F
- Figure 31. Germany Generative AI in Lending Market Share (%), By End-user, 2018-2032F
- Figure 32. France Generative AI in Lending Market, By Value, In USD Billion, 2018-2032F
- Figure 33. France Generative AI in Lending Market Share (%), By Deployment Mode, 2018-2032F
- Figure 34. France Generative AI in Lending Market Share (%), By Type, 2018-2032F
- Figure 35. France Generative AI in Lending Market Share (%), By End-user, 2018-2032F
- Figure 36. Italy Generative AI in Lending Market, By Value, In USD Billion, 2018-2032F
- Figure 37. Italy Generative AI in Lending Market Share (%), By Deployment Mode, 2018-2032F
- Figure 38. Italy Generative AI in Lending Market Share (%), By Type, 2018-2032F
- Figure 39. Italy Generative AI in Lending Market Share (%), By End-user, 2018-2032F
- Figure 40. United Kingdom Generative AI in Lending Market, By Value, In USD Billion, 2018-2032F
- Figure 41. United Kingdom Generative AI in Lending Market Share (%), By Deployment Mode, 2018-2032F
- Figure 42. United Kingdom Generative AI in Lending Market Share (%), By Type, 2018-2032F
- Figure 43. United Kingdom Generative AI in Lending Market Share (%), By End-user, 2018-2032F
- Figure 44. Russia Generative AI in Lending Market, By Value, In USD Billion, 2018-2032F
- Figure 45. Russia Generative AI in Lending Market Share (%), By Deployment Mode, 2018-2032F
- Figure 46. Russia Generative AI in Lending Market Share (%), By Type, 2018-2032F
- Figure 47. Russia Generative AI in Lending Market Share (%), By End-user, 2018-2032F
- Figure 48. Netherlands Generative AI in Lending Market, By Value, In USD Billion, 2018-2032F
- Figure 49. Netherlands Generative AI in Lending Market Share (%), By Deployment Mode, 2018-2032F
- Figure 50. Netherlands Generative AI in Lending Market Share (%), By Type, 2018-2032F
- Figure 51. Netherlands Generative AI in Lending Market Share (%), By End-user, 2018-2032F
- Figure 52. Spain Generative AI in Lending Market, By Value, In USD Billion, 2018-2032F
- Figure 53. Spain Generative AI in Lending Market Share (%), By Deployment Mode, 2018-2032F
- Figure 54. Spain Generative AI in Lending Market Share (%), By Type, 2018-2032F
- Figure 55. Spain Generative AI in Lending Market Share (%), By End-user, 2018-2032F
- Figure 56. Turkey Generative AI in Lending Market, By Value, In USD Billion, 2018-2032F
- Figure 57. Turkey Generative AI in Lending Market Share (%), By Deployment Mode, 2018-2032F
- Figure 58. Turkey Generative AI in Lending Market Share (%), By Type, 2018-2032F
- Figure 59. Turkey Generative AI in Lending Market Share (%), By End-user, 2018-2032F
- Figure 60. Poland Generative AI in Lending Market, By Value, In USD Billion, 2018-2032F
- Figure 61. Poland Generative AI in Lending Market Share (%), By Deployment Mode, 2018-2032F
- Figure 62. Poland Generative AI in Lending Market Share (%), By Type, 2018-2032F
- Figure 63. Poland Generative AI in Lending Market Share (%), By End-user, 2018-2032F
- Figure 64. South America Generative AI in Lending Market, By Value, In USD Billion, 2018-2032F
- Figure 65. South America Generative AI in Lending Market Share (%), By Deployment Mode, 2018-2032F
- Figure 66. South America Generative AI in Lending Market Share (%), By Type, 2018-2032F
- Figure 67. South America Generative AI in Lending Market Share (%), By End-user, 2018-2032F
- Figure 68. South America Generative AI in Lending Market Share (%), By Country, 2018-2032F
- Figure 69. Brazil Generative AI in Lending Market, By Value, In USD Billion, 2018-2032F
- Figure 70. Brazil Generative AI in Lending Market Share (%), By Deployment Mode, 2018-2032F
- Figure 71. Brazil Generative AI in Lending Market Share (%), By Type, 2018-2032F
- Figure 72. Brazil Generative AI in Lending Market Share (%), By End-user, 2018-2032F
- Figure 73. Argentina Generative AI in Lending Market, By Value, In USD Billion, 2018-2032F
- Figure 74. Argentina Generative AI in Lending Market Share (%), By Deployment Mode, 2018-2032F
- Figure 75. Argentina Generative AI in Lending Market Share (%), By Type, 2018-2032F
- Figure 76. Argentina Generative AI in Lending Market Share (%), By End-user, 2018-2032F
- Figure 77. Asia-Pacific Generative AI in Lending Market, By Value, In USD Billion, 2018-2032F
- Figure 78. Asia-Pacific Generative AI in Lending Market Share (%), By Deployment Mode, 2018-2032F
- Figure 79. Asia-Pacific Generative AI in Lending Market Share (%), By Type, 2018-2032F
- Figure 80. Asia-Pacific Generative AI in Lending Market Share (%), By End-user, 2018-2032F
- Figure 81. Asia-Pacific Generative AI in Lending Market Share (%), By Country, 2018-2032F
- Figure 82. India Generative AI in Lending Market, By Value, In USD Billion, 2018-2032F
- Figure 83. India Generative AI in Lending Market Share (%), By Deployment Mode, 2018-2032F
- Figure 84. India Generative AI in Lending Market Share (%), By Type, 2018-2032F
- Figure 85. India Generative AI in Lending Market Share (%), By End-user, 2018-2032F
- Figure 86. China Generative AI in Lending Market, By Value, In USD Billion, 2018-2032F
- Figure 87. China Generative AI in Lending Market Share (%), By Deployment Mode, 2018-2032F
- Figure 88. China Generative AI in Lending Market Share (%), By Type, 2018-2032F
- Figure 89. China Generative AI in Lending Market Share (%), By End-user, 2018-2032F
- Figure 90. Japan Generative AI in Lending Market, By Value, In USD Billion, 2018-2032F
- Figure 91. Japan Generative AI in Lending Market Share (%), By Deployment Mode, 2018-2032F
- Figure 92. Japan Generative AI in Lending Market Share (%), By Type, 2018-2032F
- Figure 93. Japan Generative AI in Lending Market Share (%), By End-user, 2018-2032F
- Figure 94. Australia Generative AI in Lending Market, By Value, In USD Billion, 2018-2032F
- Figure 95. Australia Generative AI in Lending Market Share (%), By Deployment Mode, 2018-2032F
- Figure 96. Australia Generative AI in Lending Market Share (%), By Type, 2018-2032F
- Figure 97. Australia Generative AI in Lending Market Share (%), By End-user, 2018-2032F
- Figure 98. Vietnam Generative AI in Lending Market, By Value, In USD Billion, 2018-2032F
- Figure 99. Vietnam Generative AI in Lending Market Share (%), By Deployment Mode, 2018-2032F
- Figure 100. Vietnam Generative AI in Lending Market Share (%), By Type, 2018-2032F
- Figure 101. Vietnam Generative AI in Lending Market Share (%), By End-user, 2018-2032F
- Figure 102. South Korea Generative AI in Lending Market, By Value, In USD Billion, 2018-2032F
- Figure 103. South Korea Generative AI in Lending Market Share (%), By Deployment Mode, 2018-2032F
- Figure 104. South Korea Generative AI in Lending Market Share (%), By Type, 2018-2032F
- Figure 105. South Korea Generative AI in Lending Market Share (%), By End-user, 2018-2032F
- Figure 106. Indonesia Generative AI in Lending Market, By Value, In USD Billion, 2018-2032F
- Figure 107. Indonesia Generative AI in Lending Market Share (%), By Deployment Mode, 2018-2032F
- Figure 108. Indonesia Generative AI in Lending Market Share (%), By Type, 2018-2032F
- Figure 109. Indonesia Generative AI in Lending Market Share (%), By End-user, 2018-2032F
- Figure 110. Philippines Generative AI in Lending Market, By Value, In USD Billion, 2018-2032F
- Figure 111. Philippines Generative AI in Lending Market Share (%), By Deployment Mode, 2018-2032F
- Figure 112. Philippines Generative AI in Lending Market Share (%), By Type, 2018-2032F
- Figure 113. Philippines Generative AI in Lending Market Share (%), By End-user, 2018-2032F
- Figure 114. Middle East & Africa Generative AI in Lending Market, By Value, In USD Billion, 2018-2032F
- Figure 115. Middle East & Africa Generative AI in Lending Market Share (%), By Deployment Mode, 2018-2032F
- Figure 116. Middle East & Africa Generative AI in Lending Market Share (%), By Type, 2018-2032F
- Figure 117. Middle East & Africa Generative AI in Lending Market Share (%), By End-user, 2018-2032F
- Figure 118. Middle East & Africa Generative AI in Lending Market Share (%), By Country, 2018-2032F
- Figure 119. Saudi Arabia Generative AI in Lending Market, By Value, In USD Billion, 2018-2032F
- Figure 120. Saudi Arabia Generative AI in Lending Market Share (%), By Deployment Mode, 2018-2032F
- Figure 121. Saudi Arabia Generative AI in Lending Market Share (%), By Type, 2018-2032F
- Figure 122. Saudi Arabia Generative AI in Lending Market Share (%), By End-user, 2018-2032F
- Figure 123. UAE Generative AI in Lending Market, By Value, In USD Billion, 2018-2032F
- Figure 124. UAE Generative AI in Lending Market Share (%), By Deployment Mode, 2018-2032F
- Figure 125. UAE Generative AI in Lending Market Share (%), By Type, 2018-2032F
- Figure 126. UAE Generative AI in Lending Market Share (%), By End-user, 2018-2032F
- Figure 127. South Africa Generative AI in Lending Market, By Value, In USD Billion, 2018-2032F
- Figure 128. South Africa Generative AI in Lending Market Share (%), By Deployment Mode, 2018-2032F
- Figure 129. South Africa Generative AI in Lending Market Share (%), By Type, 2018-2032F
- Figure 130. South Africa Generative AI in Lending Market Share (%), By End-user, 2018-2032F
- Figure 131. By Deployment Mode Map-Market Size (USD Billion) & Growth Rate (%), 2024
- Figure 132. By Type Map-Market Size (USD Billion) & Growth Rate (%), 2024
- Figure 133. By End-user Map-Market Size (USD Billion) & Growth Rate (%), 2024
- Figure 134. By Region Map-Market Size (USD Billion) & Growth Rate (%), 2024
Global generative AI in lending market is projected to witness a CAGR of 15.67% during the forecast period 2025-2032, growing from USD 2.58 billion in 2024 to USD 8.27 billion in 2032F, owing to undergoing revolutionary expansion, driven by some key factors. One of the prime movers is the technology's capacity to improve credit decision-making via sophisticated risk evaluation models that scan alternative data sources such as cash flow patterns, utility payments, and even behavioral metrics, resulting in better forecasts compared to conventional scoring techniques. This innovation is of special value in the context of financial inclusion, enabling lenders to reach previously unserved borrowers without compromising portfolio quality. A second major contributor is lending process automation, where AI optimizes application processing, underwriting, and fraud detection, shortening approval times from days to minutes and lowering operating expenses.
The market is also driven by regulatory change, as emerging guidelines require explainable AI and algorithmic transparency, compelling lenders to invest in more advanced and compliant systems. Consumer preference for bespoke financial products is also driving adoption, with generative AI allowing dynamic pricing of loans and customized repayment terms. Yet threats such as data privacy issues, costs of implementation, and a lack of skilled AI developers to develop them will slow down the rate of adoption temporarily. The competitive environment is heating up as the old banks, fintech startups, and major tech companies all scramble to deploy these solutions, portending further explosive growth as the tech matures and shows more defined ROI.
For instance, in April 2025, LendingClub Corporation announced the acquisition of intellectual property and select talent behind Cushion, an AI-powered spending intelligence platform, providing a natural complement to LendingClub's suite of mobile financial products and experiences. Cushion's AI-powered technology ingests users' bank transactions and purchase information to help them track their bills, make on-time payments, manage subscriptions, build credit, and monitor buy now, pay later (BNPL) loans.
AI-Powered Risk Assessment and Fraud Detection
Generative AI is transforming lending by improving credit risk models above and beyond the conventional FICO scores (Fair Isaac Corporation Score). In contrast to rule-based systems, AI scans different data (such as cash flow patterns, rental payment history, and even social media indicators) to forecast borrower reliability more accurately. This change is beneficial for thin-file borrowers (those with sparse credit histories), allowing for financial inclusion while lowering default risks.
Further, fraud detection has been enhanced with AI capability to mimic synthetic patterns of fraud to enable lenders to detect suspicious applications before approval. For instance, generative models can generate adversarial attack simulations to subject loan systems to test against advancing fraud strategies.
For instance, in February 2025, ZestFinance Inc. (Zest AI), a provider of AI-based lending technology, made its AI-automated underwriting and fraud detection natively integrated into the Temenos Loan Origination solution. This integrated solution equips traditional lending institutions in the U.S. with advanced capabilities to enhance loan approvals while preserving high-quality risk management in a highly competitive environment.
The partnership brings with it two important benefits, Zest AI technology can view thousands of data points much more than classic credit models allowing for more efficient and accurate lending decisions. Also, the Zest Protect system detects fake applications in real time without interrupting customer experience, so institutions can tailor security levels to suit their risk appetite.
Regulatory Push for Ethical AI in Finance
As AI adoption grows, regulators are tightening oversight to prevent algorithmic bias and ensure fairness in lending decisions. The EU AI Act (2024) classifies AI-driven credit scoring as "high-risk," requiring lenders to provide transparent decision-making processes. Similarly, the U.S. Consumer Financial Protection Bureau (CFPB) has issued guidelines mandating explainable AI (XAI) in loan approvals. This regulatory pressure is accelerating demand for AI audit tools that ensure compliance with fair lending laws (e.g., the Equal Credit Opportunity Act). Companies are now investing in bias-detection algorithms and synthetic data generation to train models without historical discrimination risks.
According to a report by PYMNTS.com LLC, 72% of finance leaders report actively using AI in their operations, with its applications ranging from fraud detection (64%) to customer onboarding automation (42%).
Hyper-Personalized Loan Pricing and Dynamic Offerings
Generative AI facilitates real-time loan product customization based on understanding borrower behavior, macroeconomic forces, and even geopolitical factors that could affect repayment capability. In contrast to fixed pricing models, AI-based systems dynamically change interest rates, tenures of loans, and repayment terms. For example, a cash-flow variable income freelancer can be offered a cash-flow cycle-based flexible repayment schedule, while a salaried individual borrower may be offered a reduced APR in view of stable employment statistics. AI also assists lenders in forecasting prepayment risk and maximizing profitability.
For instance, in April 2025, Lake Trust Credit Union, a leading credit union serving 200,000 members and businesses throughout Michigan with over USD 2.5 billion in assets, announced its partnership with Upstart, the leading artificial intelligence (AI) lending marketplace, to offer personal loans to more consumers.
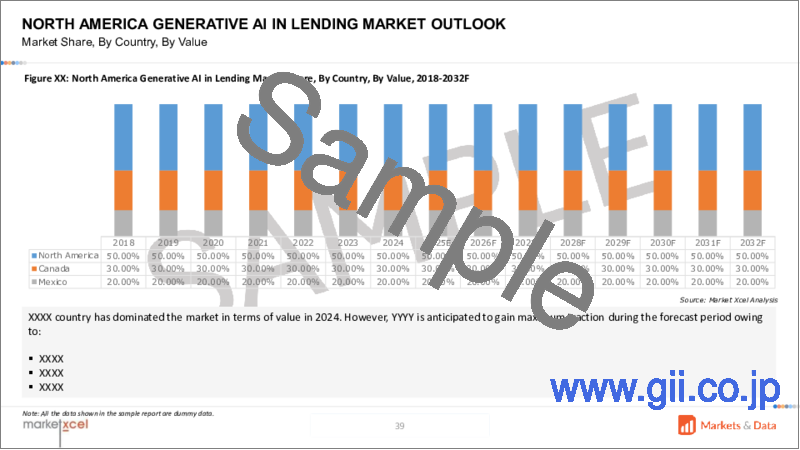
North America Leads Global Generative AI in Lending Market
North America, particularly the United States, has emerged as the global leader in the adoption and innovation of generative AI in lending. This dominance is fueled by a combination of strong venture capital investments, progressive regulatory frameworks, and advanced digital banking infrastructure. The region's fintech ecosystem has seen over USD 12 billion invested in AI-driven lending startups in 2023 alone, with major players like Upstart, LendingClub, and Zest AI securing significant funding to scale their AI underwriting models. Additionally, U.S. regulators have taken a proactive stance by introducing sandbox environments that allow fintech firms to test AI solutions in a controlled setting, accelerating innovation while ensuring compliance with fair lending laws.
For instance, in February 2025, ZestFinance Inc. (Zest AI) announced the launch of LuLu Pulse, the first module of Zest AI's Lending Intelligence Platform powered by generative AI that is now available for all credit unions. By integrating industry public data and institution-specific data for customization, LuLu Pulse serves as a centralized intelligence hub that consolidates multiple data sources into a single, authoritative platform. Credit unions can access intelligence to enhance their lending practices and credit risk management to make better lending decisions.
Impact of the U.S. Tariffs on Global Generative AI in the Lending Market
Most AI lending models are trained on NVIDIA GPUs. With tariffs increasing chip prices, fintech companies might find higher operational costs, and AI model development would take a slower pace. Large lenders leveraging AWS, Azure, or Google Cloud AI solutions might experience increased prices if cloud vendors pass the cost of tariffs to users.
Large banks (e.g., JPMorgan, Goldman Sachs) have the capacity to absorb tariff expenses, but small fintechs and startups can put AI implementation on hold based on budget. If tariffs increase AI infrastructure costs, companies will reduce experimental AI lending models, slowing developments such as real-time credit scoring.
Most AI chips are produced in China. Tariffs might break supply chains, slowing new deployment of AI lending technologies. Switching to alternative non-Chinese suppliers (e.g., Taiwan Semiconductor Manufacturing Co.) will take time, leading to stopgap shortages.
Key Players Landscape and Outlook
The global generative AI lending market is dominated by a mix of established fintech disruptors, traditional credit bureaus, and tech giants, each competing on distinct capabilities. Top players differentiate themselves through algorithmic superiority, regulatory compliance tools, and data network effects. The competitive landscape is intensifying as cloud providers offer AI lending APIs, lowering entry barriers for challenger fintechs. Market conditions favor vertically integrated players combining proprietary data with AI, like LendingClub's small business lending automation, while pure-play AI vendors face margin pressures due to rising GPU costs and talent wars. The outlook remains bullish as three strategic battlegrounds emerge, which include hyper-personalization (real-time loan customization), fraud prevention (generative AI simulating synthetic identity attacks), and embedded finance (API-driven lending in e-commerce/platforms). However, fragmented regulation and resource scarcity could consolidate dominance among well-capitalized incumbents, potentially stifling innovation. Winners will likely be those mastering hybrid AI-human underwriting models that balance automation with regulatory explainability demands.
For instance, in May 2025, Finastra, a global provider of financial services applications, and IBM unveiled their collaboration on an enhanced cloud-based lending managed services offering. Finastra's Lending Cloud Service (LCS) offers comprehensive and cost-effective services for its Corporate Lending solutions, Loan IQ, Trade Innovation and Corporate Channels, and is supported by IBM for Finastra clients in North America and Europe.
Table of Contents
1. Project Scope and Definitions
2. Research Methodology
3. Impact of U.S. Tariffs
4. Executive Summary
5. Voice of Customers
- 5.1. Respondent Demographics
- 5.2. Awareness and Understanding of Generative AI in Lending
- 5.3. Adoption Drivers and Barriers
- 5.4. Preferred Deployment Models and Applications
6. Global Generative AI in Lending Market Outlook, 2018-2032F
- 6.1. Market Size Analysis & Forecast
- 6.1.1. By Value
- 6.2. Market Share Analysis & Forecast
- 6.2.1. By Deployment Mode
- 6.2.1.1. Cloud
- 6.2.1.2. On-Premises
- 6.2.2. By Type
- 6.2.2.1. Credit Scoring
- 6.2.2.2. Loan Origination
- 6.2.2.3. Risk Assessment
- 6.2.2.4. Fraud Detection
- 6.2.2.5. Customer Service
- 6.2.2.6. Others
- 6.2.3. By End-user
- 6.2.3.1. Banks
- 6.2.3.2. Credit Unions
- 6.2.3.3. Fintech Companies
- 6.2.3.4. Others
- 6.2.4. By Region
- 6.2.4.1. North America
- 6.2.4.2. Europe
- 6.2.4.3. Asia-Pacific
- 6.2.4.4. South America
- 6.2.4.5. Middle East and Africa
- 6.2.1. By Deployment Mode
- 6.3. Market Map Analysis, 2024
- 6.3.1. By Deployment Mode
- 6.3.2. By Type
- 6.3.3. By End-user
- 6.3.4. By Region
7. North America Generative AI in Lending Market Outlook, 2018-2032F
- 7.1. Market Size Analysis & Forecast
- 7.1.1. By Value
- 7.2. Market Share Analysis & Forecast
- 7.2.1. By Deployment Mode
- 7.2.1.1. Cloud
- 7.2.1.2. On-Premises
- 7.2.2. By Type
- 7.2.2.1. Credit Scoring
- 7.2.2.2. Loan Origination
- 7.2.2.3. Risk Assessment
- 7.2.2.4. Fraud Detection
- 7.2.2.5. Customer Service
- 7.2.2.6. Others
- 7.2.3. By End-user
- 7.2.3.1. Banks
- 7.2.3.2. Credit Unions
- 7.2.3.3. Fintech Companies
- 7.2.3.4. Others
- 7.2.4. By Country Share
- 7.2.4.1. United States
- 7.2.4.2. Canada
- 7.2.4.3. Mexico
- 7.2.1. By Deployment Mode
- 7.3. Country Market Assessment
- 7.3.1. United States Generative AI in Lending Market Outlook, 2018-2032F*
- 7.3.1.1. Market Size Analysis & Forecast
- 7.3.1.1.1. By Value
- 7.3.1.2. Market Share Analysis & Forecast
- 7.3.1.2.1. By Deployment Mode
- 7.3.1.2.1.1. Cloud
- 7.3.1.2.1.2. On-Premises
- 7.3.1.2.2. By Type
- 7.3.1.2.2.1. Credit Scoring
- 7.3.1.2.2.2. Loan Origination
- 7.3.1.2.2.3. Risk Assessment
- 7.3.1.2.2.4. Fraud Detection
- 7.3.1.2.2.5. Customer Service
- 7.3.1.2.2.6. Others
- 7.3.1.2.3. By End-user
- 7.3.1.2.3.1. Banks
- 7.3.1.2.3.2. Credit Unions
- 7.3.1.2.3.3. Fintech Companies
- 7.3.1.2.3.4. Others
- 7.3.1.2.1. By Deployment Mode
- 7.3.1.1. Market Size Analysis & Forecast
- 7.3.2. Canada
- 7.3.3. Mexico
- 7.3.1. United States Generative AI in Lending Market Outlook, 2018-2032F*
All segments will be provided for all regions and countries covered
8. Europe Generative AI in Lending Market Outlook, 2018-2032F
- 8.1. Germany
- 8.2. France
- 8.3. Italy
- 8.4. United Kingdom
- 8.5. Russia
- 8.6. Netherlands
- 8.7. Spain
- 8.8. Turkey
- 8.9. Poland
9. Asia-Pacific Generative AI in Lending Market Outlook, 2018-2032F
- 9.1. India
- 9.2. China
- 9.3. Japan
- 9.4. Australia
- 9.5. Vietnam
- 9.6. South Korea
- 9.7. Indonesia
- 9.8. Philippines
10. South America Generative AI in Lending Market Outlook, 2018-2032F
- 10.1. Brazil
- 10.2. Argentina
11. Middle East and Africa Generative AI in Lending Market Outlook, 2018-2032F
- 11.1. Saudi Arabia
- 11.2. UAE
- 11.3. South Africa
12. Demand Supply Analysis
13. Value Chain Analysis
14. Porter's Five Forces Analysis
15. PESTLE Analysis
16. Market Dynamics
- 16.1. Market Drivers
- 16.2. Market Challenges
17. Market Trends and Developments
18. Policy and Regulatory Landscape
19. Case Studies
20. Competitive Landscape
- 20.1. Competition Matrix of Top 5 Market Leaders
- 20.2. SWOT Analysis for Top 5 Players
- 20.3. Key Players Landscape for Top 10 Market Players
- 20.3.1. Microsoft Corporation
- 20.3.1.1. Company Details
- 20.3.1.2. Key Management Personnel
- 20.3.1.3. Products and Services
- 20.3.1.4. Financials (As Reported)
- 20.3.1.5. Key Market Focus and Geographical Presence
- 20.3.1.6. Recent Developments/Collaborations/Partnerships/Mergers and Acquisitions
- 20.3.2. IBM Corporation
- 20.3.3. Google LLC
- 20.3.4. Amazon Web Services, Inc.
- 20.3.5. Salesforce, Inc.
- 20.3.6. Oracle Corporation
- 20.3.7. SAP SE
- 20.3.8. Zest AI, Inc.
- 20.3.9. Scienaptic Systems Inc.
- 20.3.10. SymphonyAI LLC
- 20.3.1. Microsoft Corporation
Companies mentioned above DO NOT hold any order as per market share and can be changed as per information available during research work.
