|
|
市場調査レポート
商品コード
1402433
集積受動素子(IPD)の世界市場の評価:タイプ別、集積別、材料別、エンドユーザー別、地域別、機会、予測(2017年~2031年)Integrated Passive Devices Market Assessment, By Type, By Integration, By Material, By End-user, By Region, Opportunities, and Forecast, 2017-2031F |
||||||
|
|||||||
カスタマイズ可能
|
|||||||

| 集積受動素子(IPD)の世界市場の評価:タイプ別、集積別、材料別、エンドユーザー別、地域別、機会、予測(2017年~2031年) |
|
出版日: 2024年01月08日
発行: Markets & Data
ページ情報: 英文 227 Pages
納期: 3~5営業日
|

全表示
- 概要
- 図表
- 目次
世界の集積受動素子(IPD)の市場規模は、2023年に14億1,000万米ドル、2031年に29億8,000万米ドルに達し、2024年~2031年にCAGRで9.8%の成長が見込まれています。
市場は、高い機能性を持つ小型化されたコンパクトな電子機器に対する需要の向上により、大幅な成長を示しています。スマートフォンやコネクテッドデバイスの普及と半導体技術の進歩が、市場をさらに牽引しています。例えば、米国半導体工業会(SIA)が発表した近年の統計によると、2021年の世界の半導体産業の売上は5,559億米ドルで、2022年に5,741億米ドルとなり、年間合計で過去最高を記録しました。2022年の世界半導体産業の前年比成長率は、2021年に対して3.3%でした。さらに、5G技術とIoTアプリケーションの採用が増加しており、これらの部品は高周波通信と小型化されたIoTデバイスを実現する上で重要な役割を果たすため、集積受動素子(IPD)の大幅な需要を生み出しています。
スマートフォンやコネクテッドデバイスの普及が集積受動素子(IPD)市場を牽引
スマートフォンやコネクテッドデバイスの需要の高まりは、集積受動素子(IPD)市場の成長の大きな促進要因となっています。世界の人々が通信、エンターテインメント、生産性向上に向けてスマートフォンやコネクテッドデバイスへの依存を高めるにつれて、より小型で効率的かつ強力な電子部品への需要が急増しています。抵抗器、コンデンサー、インダクターなどの重要な受動部品を1つのチップに集積した集積受動素子(IPD)は、これらの機器の性能、小型化、エネルギー効率を強化する上で重要な役割を果たしています。
スマートフォンには、その多機能性を支える小型で高性能な部品が必要です。集積受動素子(IPD)により、メーカーはスマートフォンやその他のコネクテッドデバイスの機能性と信頼性を向上させながら、全体的なサイズを小さくすることができます。これらの部品は、無線通信技術における信号フィルタリング、電力管理、インピーダンス整合などの機能に不可欠であり、シームレスな接続性と最適な性能を保証しています。
例えば、YouAppi.が近年発表したデータによると、2023年、スマートフォンの普及は前例のないレベルに達し、世界のユーザー数は驚異の68億人となっています。中でも米国は突出しており、ミレニアル世代の94.40%、大卒者の91%がスマートフォンを所有しています。このような普及は日常生活に大きな影響を与えており、米国の人口の半数近くが毎日5~6時間をスマートフォンに費やしています。ティーンエイジャーの72%は、起床後すぐに携帯電話のメッセージや通知をチェックする習慣があります。ノモフォビア(携帯電話がない状態に対する恐怖)は、スマートフォンユーザーの99.2%に影響を及ぼしています。
5G技術の採用拡大が集積受動素子(IPD)市場に影響
5G技術の急速な普及は、集積受動素子(IPD)市場に大きな影響を与えています。世界の5Gネットワークの展開に伴い、通信インフラやモバイルデバイスでは、高性能でコンパクトかつ効率的な受動部品に対する需要が急増しています。5Gネットワークでは、データ速度の高速化とネットワークトラフィックの増加に対応するため、先進のRFコンポーネント、アンテナ、フィルターが必要となります。抵抗器、コンデンサー、インダクターなどのさまざまな受動部品を1つのパッケージにまとめた集積受動素子(IPD)は、5G技術の厳しい要件を満たすために不可欠なソリューションとして浮上しています。
集積受動素子(IPD)は優れた小型化および集積化の能力を提供し、より小型で電力効率の高い5Gデバイスやインフラ装置の設計を可能にします。これらのコンポーネントはRFモジュールの性能を高め、5Gネットワークにおけるシームレスなデータ送受信を可能にします。高速インターネットと低遅延通信の需要が拡大し続ける中、5G用途における集積受動素子(IPD)の必要性は高まっています。さらに、集積受動素子(IPD)は、5Gネットワークの基本であるMIMO技術の展開を可能にする上で重要な役割を果たしています。Massive MIMOは、コンパクトで高性能な受動部品を必要とする先進のアンテナシステムに依存しており、それはまさにIPDが提供するものです。5G技術がユビキタス化するにつれ、通信、IoT、スマートデバイスなどのさまざまな部門で5Gネットワークの進化と導入が進むことで、集積受動素子(IPD)市場はさらに拡大する見込みです。
当レポートでは、世界の集積受動素子(IPD)市場について調査分析し、市場規模と予測、市場力学、主要企業の情勢と見通しなどを提供しています。
目次
第1章 調査手法
第2章 プロジェクトの範囲と定義
第3章 世界の集積受動素子(IPD)市場に対するCOVID-19の影響
第4章 エグゼクティブサマリー
第5章 世界の集積受動素子(IPD)市場の見通し(2017年~2031年)
- 市場規模と予測
- 金額
- タイプ別
- RF IPD
- ESD IPD
- EMI IPD
- その他
- 集積別
- 高
- 低
- 材料別
- 薄膜
- 厚膜
- エンドユーザー別
- コンシューマーエレクトロニクス
- 自動車
- 通信
- 医療
- エネルギー・電力
- その他
- 地域別
- 北米
- 欧州
- 南米
- アジア太平洋
- 中東・アフリカ
- 市場シェア:企業別(2022年)
第6章 世界の集積受動素子(IPD)市場の見通し:地域別(2017年~2031年)
- 北米
- 市場規模と予測
- タイプ別
- 集積別
- 材料別
- エンドユーザー別
- 米国
- カナダ
- メキシコ
- 欧州
- ドイツ
- フランス
- イタリア
- 英国
- ロシア
- オランダ
- スペイン
- トルコ
- ポーランド
- 南米
- ブラジル
- アルゼンチン
- アジア太平洋
- インド
- 中国
- 日本
- オーストラリア
- ベトナム
- 韓国
- インドネシア
- フィリピン
- 中東・アフリカ
- サウジアラビア
- アラブ首長国連邦
- 南アフリカ
第7章 市場マッピング(2023年)
- タイプ別
- 集積別
- 材料別
- エンドユーザー別
第8章 マクロ環境と産業構造
- PESTEL分析
- ポーターのファイブフォース分析
第9章 市場力学
- 成長促進要因
- 成長抑制要因(課題、抑制要因)
第10章 主要企業情勢
- マーケットリーダー上位5社の競合マトリクス
- マーケットリーダー上位5社の市場収益分析(2023年)
- 合併と買収/合弁事業(該当する場合)
- SWOT分析(市場参入企業5社)
- 特許分析(該当する場合)
第11章 価格分析
第12章 ケーススタディ(該当する場合)
第13章 主要企業の見通し
- Jiangsu Changdian Technology Co., Ltd.
- STMicroelectronics N.V.
- Murata Manufacturing Co., Ltd.
- Semiconductor Components Industries, LLC
- Infineon Technologies AG
- Johanson Technology Inc
- Taiwan Semiconductor Manufacturing Company
- Johanson Technology Incorporated
- OnChip Devices, Inc
- Texas Instruments Incorporated
第14章 戦略的推奨事項
第15章 当社について、免責事項
List of Tables
- Table 1. Pricing Analysis of Products from Key Players
- Table 2. Competition Matrix of Top 5 Market Leaders
- Table 3. Mergers & Acquisitions/ Joint Ventures (If Applicable)
- Table 4. About Us - Regions and Countries Where We Have Executed Client Projects
List of Figures
- Figure 1. Global Integrated Passive Devices Market, By Value, In USD Billion, 2017-2031F
- Figure 2. Global Integrated Passive Devices Market, By Volume, In Thousand Units, 2017-2031F
- Figure 3. Global Integrated Passive Devices Market Share (%), By Type, 2017-2031F
- Figure 4. Global Integrated Passive Devices Market Share (%), By Integration, 2017-2031F
- Figure 5. Global Integrated Passive Devices Market Share (%), By Material, 2017-2031F
- Figure 6. Global Integrated Passive Devices Market Share (%), By End-user, 2017-2031F
- Figure 7. Global Integrated Passive Devices Market Share (%), By Region, 2017-2031F
- Figure 8. North America Integrated Passive Devices Market, By Value, In USD Billion, 2017-2031F
- Figure 9. North America Integrated Passive Devices Market, By Volume, In Thousand Units, 2017-2031F
- Figure 10. North America Integrated Passive Devices Market Share (%), By Type, 2017-2031F
- Figure 11. North America Integrated Passive Devices Market Share (%), By Integration, 2017-2031F
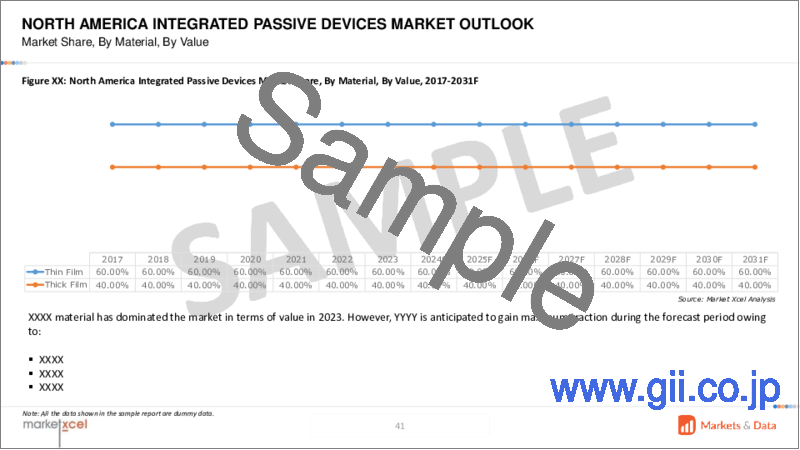
- Figure 12. North America Integrated Passive Devices Market Share (%), By Material, 2017-2031F
- Figure 13. North America Integrated Passive Devices Market Share (%), By End-user, 2017-2031F
- Figure 14. North America Integrated Passive Devices Market Share (%), By Country, 2017-2031F
- Figure 15. United States Integrated Passive Devices Market, By Value, In USD Billion, 2017-2031F
- Figure 16. United States Integrated Passive Devices Market, By Volume, In Thousand Units, 2017-2031F
- Figure 17. United States Integrated Passive Devices Market Share (%), By Type, 2017-2031F
- Figure 18. United States Integrated Passive Devices Market Share (%), By Integration, 2017-2031F
- Figure 19. United States Integrated Passive Devices Market Share (%), By Material, 2017-2031F
- Figure 20. United States Integrated Passive Devices Market Share (%), By End-user, 2017-2031F
- Figure 21. Canada Integrated Passive Devices Market, By Value, In USD Billion, 2017-2031F
- Figure 22. Canada Integrated Passive Devices Market, By Volume, In Thousand Units, 2017-2031F
- Figure 23. Canada Integrated Passive Devices Market Share (%), By Type, 2017-2031F
- Figure 24. Canada Integrated Passive Devices Market Share (%), By Integration, 2017-2031F
- Figure 25. Canada Integrated Passive Devices Market Share (%), By Material, 2017-2031F
- Figure 26. Canada Integrated Passive Devices Market Share (%), By End-user, 2017-2031F
- Figure 27. Mexico Integrated Passive Devices Market, By Value, In USD Billion, 2017-2031F
- Figure 28. Mexico Integrated Passive Devices Market, By Volume, In Thousand Units, 2017-2031F
- Figure 29. Mexico Integrated Passive Devices Market Share (%), By Type, 2017-2031F
- Figure 30. Mexico Integrated Passive Devices Market Share (%), By Integration, 2017-2031F
- Figure 31. Mexico Integrated Passive Devices Market Share (%), By Material, 2017-2031F
- Figure 32. Mexico Integrated Passive Devices Market Share (%), By End-user, 2017-2031F
- Figure 33. Europe Integrated Passive Devices Market, By Value, In USD Billion, 2017-2031F
- Figure 34. Europe Integrated Passive Devices Market, By Volume, In Thousand Units, 2017-2031F
- Figure 35. Europe Integrated Passive Devices Market Share (%), By Type, 2017-2031F
- Figure 36. Europe Integrated Passive Devices Market Share (%), By Integration, 2017-2031F
- Figure 37. Europe Integrated Passive Devices Market Share (%), By Material, 2017-2031F
- Figure 38. Europe Integrated Passive Devices Market Share (%), By End-user, 2017-2031F
- Figure 39. Europe Integrated Passive Devices Market Share (%), By Country, 2017-2031F
- Figure 40. Germany Integrated Passive Devices Market, By Value, In USD Billion, 2017-2031F
- Figure 41. Germany Integrated Passive Devices Market, By Volume, In Thousand Units, 2017-2031F
- Figure 42. Germany Integrated Passive Devices Market Share (%), By Type, 2017-2031F
- Figure 43. Germany Integrated Passive Devices Market Share (%), By Integration, 2017-2031F
- Figure 44. Germany Integrated Passive Devices Market Share (%), By Material, 2017-2031F
- Figure 45. Germany Integrated Passive Devices Market Share (%), By End-user, 2017-2031F
- Figure 46. France Integrated Passive Devices Market, By Value, In USD Billion, 2017-2031F
- Figure 47. France Integrated Passive Devices Market, By Volume, In Thousand Units, 2017-2031F
- Figure 48. France Integrated Passive Devices Market Share (%), By Type, 2017-2031F
- Figure 49. France Integrated Passive Devices Market Share (%), By Integration, 2017-2031F
- Figure 50. France Integrated Passive Devices Market Share (%), By Material, 2017-2031F
- Figure 51. France Integrated Passive Devices Market Share (%), By End-user, 2017-2031F
- Figure 52. Italy Integrated Passive Devices Market, By Value, In USD Billion, 2017-2031F
- Figure 53. Italy Integrated Passive Devices Market, By Volume, In Thousand Units, 2017-2031F
- Figure 54. Italy Integrated Passive Devices Market Share (%), By Type, 2017-2031F
- Figure 55. Italy Integrated Passive Devices Market Share (%), By Integration, 2017-2031F
- Figure 56. Italy Integrated Passive Devices Market Share (%), By Material, 2017-2031F
- Figure 57. Italy Integrated Passive Devices Market Share (%), By End-user, 2017-2031F
- Figure 58. United Kingdom Integrated Passive Devices Market, By Value, In USD Billion, 2017-2031F
- Figure 59. United Kingdom Integrated Passive Devices Market, By Volume, In Thousand Units, 2017-2031F
- Figure 60. United Kingdom Integrated Passive Devices Market Share (%), By Type, 2017-2031F
- Figure 61. United Kingdom Integrated Passive Devices Market Share (%), By Integration, 2017-2031F
- Figure 62. United Kingdom Integrated Passive Devices Market Share (%), By Material, 2017-2031F
- Figure 63. United Kingdom Integrated Passive Devices Market Share (%), By End-user, 2017-2031F
- Figure 64. Russia Integrated Passive Devices Market, By Value, In USD Billion, 2017-2031F
- Figure 65. Russia Integrated Passive Devices Market, By Volume, In Thousand Units, 2017-2031F
- Figure 66. Russia Integrated Passive Devices Market Share (%), By Type, 2017-2031F
- Figure 67. Russia Integrated Passive Devices Market Share (%), By Integration, 2017-2031F
- Figure 68. Russia Integrated Passive Devices Market Share (%), By Material, 2017-2031F
- Figure 69. Russia Integrated Passive Devices Market Share (%), By End-user, 2017-2031F
- Figure 70. Netherlands Integrated Passive Devices Market, By Value, In USD Billion, 2017-2031F
- Figure 71. Netherlands Integrated Passive Devices Market, By Volume, In Thousand Units, 2017-2031F
- Figure 72. Netherlands Integrated Passive Devices Market Share (%), By Type, 2017-2031F
- Figure 73. Netherlands Integrated Passive Devices Market Share (%), By Integration, 2017-2031F
- Figure 74. Netherlands Integrated Passive Devices Market Share (%), By Material, 2017-2031F
- Figure 75. Netherlands Integrated Passive Devices Market Share (%), By End-user, 2017-2031F
- Figure 76. Spain Integrated Passive Devices Market, By Value, In USD Billion, 2017-2031F
- Figure 77. Spain Integrated Passive Devices Market, By Volume, In Thousand Units, 2017-2031F
- Figure 78. Spain Integrated Passive Devices Market Share (%), By Type, 2017-2031F
- Figure 79. Spain Integrated Passive Devices Market Share (%), By Integration, 2017-2031F
- Figure 80. Spain Integrated Passive Devices Market Share (%), By Material, 2017-2031F
- Figure 81. Spain Integrated Passive Devices Market Share (%), By End-user, 2017-2031F
- Figure 82. Turkey Integrated Passive Devices Market, By Value, In USD Billion, 2017-2031F
- Figure 83. Turkey Integrated Passive Devices Market, By Volume, In Thousand Units, 2017-2031F
- Figure 84. Turkey Integrated Passive Devices Market Share (%), By Type, 2017-2031F
- Figure 85. Turkey Integrated Passive Devices Market Share (%), By Integration, 2017-2031F
- Figure 86. Turkey Integrated Passive Devices Market Share (%), By Material, 2017-2031F
- Figure 87. Turkey Integrated Passive Devices Market Share (%), By End-user, 2017-2031F
- Figure 88. Poland Integrated Passive Devices Market, By Value, In USD Billion, 2017-2031F
- Figure 89. Poland Integrated Passive Devices Market, By Volume, In Thousand Units, 2017-2031F
- Figure 90. Poland Integrated Passive Devices Market Share (%), By Type, 2017-2031F
- Figure 91. Poland Integrated Passive Devices Market Share (%), By Integration, 2017-2031F
- Figure 92. Poland Integrated Passive Devices Market Share (%), By Material, 2017-2031F
- Figure 93. Poland Integrated Passive Devices Market Share (%), By End-user, 2017-2031F
- Figure 94. South America Integrated Passive Devices Market, By Value, In USD Billion, 2017-2031F
- Figure 95. South America Integrated Passive Devices Market, By Volume, In Thousand Units, 2017-2031F
- Figure 96. South America Integrated Passive Devices Market Share (%), By Type, 2017-2031F
- Figure 97. South America Integrated Passive Devices Market Share (%), By Integration, 2017-2031F
- Figure 98. South America Integrated Passive Devices Market Share (%), By Material, 2017-2031F
- Figure 99. South America Integrated Passive Devices Market Share (%), By End-user, 2017-2031F
- Figure 100. South America Integrated Passive Devices Market Share (%), By Country, 2017-2031F
- Figure 101. Brazil Integrated Passive Devices Market, By Value, In USD Billion, 2017-2031F
- Figure 102. Brazil Integrated Passive Devices Market, By Volume, In Thousand Units, 2017-2031F
- Figure 103. Brazil Integrated Passive Devices Market Share (%), By Type, 2017-2031F
- Figure 104. Brazil Integrated Passive Devices Market Share (%), By Integration, 2017-2031F
- Figure 105. Brazil Integrated Passive Devices Market Share (%), By Material, 2017-2031F
- Figure 106. Brazil Integrated Passive Devices Market Share (%), By End-user, 2017-2031F
- Figure 107. Argentina Integrated Passive Devices Market, By Value, In USD Billion, 2017-2031F
- Figure 108. Argentina Integrated Passive Devices Market, By Volume, In Thousand Units, 2017-2031F
- Figure 109. Argentina Integrated Passive Devices Market Share (%), By Type, 2017-2031F
- Figure 110. Argentina Integrated Passive Devices Market Share (%), By Integration, 2017-2031F
- Figure 111. Argentina Integrated Passive Devices Market Share (%), By Material, 2017-2031F
- Figure 112. Argentina Integrated Passive Devices Market Share (%), By End-user, 2017-2031F
- Figure 113. Asia-Pacific Integrated Passive Devices Market, By Value, In USD Billion, 2017-2031F
- Figure 114. Asia-Pacific Integrated Passive Devices Market, By Volume, In Thousand Units, 2017-2031F
- Figure 115. Asia-Pacific Integrated Passive Devices Market Share (%), By Type, 2017-2031F
- Figure 116. Asia-Pacific Integrated Passive Devices Market Share (%), By Integration, 2017-2031F
- Figure 117. Asia-Pacific Integrated Passive Devices Market Share (%), By Material, 2017-2031F
- Figure 118. Asia-Pacific Integrated Passive Devices Market Share (%), By End-user, 2017-2031F
- Figure 119. Asia-Pacific Integrated Passive Devices Market Share (%), By Country, 2017-2031F
- Figure 120. India Integrated Passive Devices Market, By Value, In USD Billion, 2017-2031F
- Figure 121. India Integrated Passive Devices Market, By Volume, In Thousand Units, 2017-2031F
- Figure 122. India Integrated Passive Devices Market Share (%), By Type, 2017-2031F
- Figure 123. India Integrated Passive Devices Market Share (%), By Integration, 2017-2031F
- Figure 124. India Integrated Passive Devices Market Share (%), By Material, 2017-2031F
- Figure 125. India Integrated Passive Devices Market Share (%), By End-user, 2017-2031F
- Figure 126. China Integrated Passive Devices Market, By Value, In USD Billion, 2017-2031F
- Figure 127. China Integrated Passive Devices Market, By Volume, In Thousand Units, 2017-2031F
- Figure 128. China Integrated Passive Devices Market Share (%), By Type, 2017-2031F
- Figure 129. China Integrated Passive Devices Market Share (%), By Integration, 2017-2031F
- Figure 130. China Integrated Passive Devices Market Share (%), By Material, 2017-2031F
- Figure 131. China Integrated Passive Devices Market Share (%), By End-user, 2017-2031F
- Figure 132. Japan Integrated Passive Devices Market, By Value, In USD Billion, 2017-2031F
- Figure 133. Japan Integrated Passive Devices Market, By Volume, In Thousand Units, 2017-2031F
- Figure 134. Japan Integrated Passive Devices Market Share (%), By Type, 2017-2031F
- Figure 135. Japan Integrated Passive Devices Market Share (%), By Integration, 2017-2031F
- Figure 136. Japan Integrated Passive Devices Market Share (%), By Material, 2017-2031F
- Figure 137. Japan Integrated Passive Devices Market Share (%), By End-user, 2017-2031F
- Figure 138. Australia Integrated Passive Devices Market, By Value, In USD Billion, 2017-2031F
- Figure 139. Australia Integrated Passive Devices Market, By Volume, In Thousand Units, 2017-2031F
- Figure 140. Australia Integrated Passive Devices Market Share (%), By Type, 2017-2031F
- Figure 141. Australia Integrated Passive Devices Market Share (%), By Integration, 2017-2031F
- Figure 142. Australia Integrated Passive Devices Market Share (%), By Material, 2017-2031F
- Figure 143. Australia Integrated Passive Devices Market Share (%), By End-user, 2017-2031F
- Figure 144. Vietnam Integrated Passive Devices Market, By Value, In USD Billion, 2017-2031F
- Figure 145. Vietnam Integrated Passive Devices Market, By Volume, In Thousand Units, 2017-2031F
- Figure 146. Vietnam Integrated Passive Devices Market Share (%), By Type, 2017-2031F
- Figure 147. Vietnam Integrated Passive Devices Market Share (%), By Integration, 2017-2031F
- Figure 148. Vietnam Integrated Passive Devices Market Share (%), By Material, 2017-2031F
- Figure 149. Vietnam Integrated Passive Devices Market Share (%), By End-user, 2017-2031F
- Figure 150. South Korea Integrated Passive Devices Market, By Value, In USD Billion, 2017-2031F
- Figure 151. South Korea Integrated Passive Devices Market, By Volume, In Thousand Units, 2017-2031F
- Figure 152. South Korea Integrated Passive Devices Market Share (%), By Type, 2017-2031F
- Figure 153. South Korea Integrated Passive Devices Market Share (%), By Integration, 2017-2031F
- Figure 154. South Korea Integrated Passive Devices Market Share (%), By Material, 2017-2031F
- Figure 155. South Korea Integrated Passive Devices Market Share (%), By End-user, 2017-2031F
- Figure 156. Indonesia Integrated Passive Devices Market, By Value, In USD Billion, 2017-2031F
- Figure 157. Indonesia Integrated Passive Devices Market, By Volume, In Thousand Units, 2017-2031F
- Figure 158. Indonesia Integrated Passive Devices Market Share (%), By Type, 2017-2031F
- Figure 159. Indonesia Integrated Passive Devices Market Share (%), By Integration, 2017-2031F
- Figure 160. Indonesia Integrated Passive Devices Market Share (%), By Material, 2017-2031F
- Figure 161. Indonesia Integrated Passive Devices Market Share (%), By End-user, 2017-2031F
- Figure 162. Philippines Integrated Passive Devices Market, By Value, In USD Billion, 2017-2031F
- Figure 163. Philippines Integrated Passive Devices Market, By Volume, In Thousand Units, 2017-2031F
- Figure 164. Philippines Integrated Passive Devices Market Share (%), By Type, 2017-2031F
- Figure 165. Philippines Integrated Passive Devices Market Share (%), By Integration, 2017-2031F
- Figure 166. Philippines Integrated Passive Devices Market Share (%), By Material, 2017-2031F
- Figure 167. Philippines Integrated Passive Devices Market Share (%), By End-user, 2017-2031F
- Figure 168. Middle East & Africa Integrated Passive Devices Market, By Value, In USD Billion, 2017-2031F
- Figure 169. Middle East & Africa Integrated Passive Devices Market, By Volume, In Thousand Units, 2017-2031F
- Figure 170. Middle East & Africa Integrated Passive Devices Market Share (%), By Type, 2017-2031F
- Figure 171. Middle East & Africa Integrated Passive Devices Market Share (%), By Integration, 2017-2031F
- Figure 172. Middle East & Africa Integrated Passive Devices Market Share (%), By Material, 2017-2031F
- Figure 173. Middle East & Africa Integrated Passive Devices Market Share (%), By End-user, 2017-2031F
- Figure 174. Middle East & Africa Integrated Passive Devices Market Share (%), By Country, 2017-2031F
- Figure 175. Saudi Arabia Integrated Passive Devices Market, By Value, In USD Billion, 2017-2031F
- Figure 176. Saudi Arabia Integrated Passive Devices Market, By Volume, In Thousand Units, 2017-2031F
- Figure 177. Saudi Arabia Integrated Passive Devices Market Share (%), By Type, 2017-2031F
- Figure 178. Saudi Arabia Integrated Passive Devices Market Share (%), By Integration, 2017-2031F
- Figure 179. Saudi Arabia Integrated Passive Devices Market Share (%), By Material, 2017-2031F
- Figure 180. Saudi Arabia Integrated Passive Devices Market Share (%), By End-user, 2017-2031F
- Figure 181. UAE Integrated Passive Devices Market, By Value, In USD Billion, 2017-2031F
- Figure 182. UAE Integrated Passive Devices Market, By Volume, In Thousand Units, 2017-2031F
- Figure 183. UAE Integrated Passive Devices Market Share (%), By Type, 2017-2031F
- Figure 184. UAE Integrated Passive Devices Market Share (%), By Integration, 2017-2031F
- Figure 185. UAE Integrated Passive Devices Market Share (%), By Material, 2017-2031F
- Figure 186. UAE Integrated Passive Devices Market Share (%), By End-user, 2017-2031F
- Figure 187. South Africa Integrated Passive Devices Market, By Value, In USD Billion, 2017-2031F
- Figure 188. South Africa Integrated Passive Devices Market, By Volume, In Thousand Units, 2017-2031F
- Figure 189. South Africa Integrated Passive Devices Market Share (%), By Type, 2017-2031F
- Figure 190. South Africa Integrated Passive Devices Market Share (%), By Integration, 2017-2031F
- Figure 191. South Africa Integrated Passive Devices Market Share (%), By Material, 2017-2031F
- Figure 192. South Africa Integrated Passive Devices Market Share (%), By End-user, 2017-2031F
- Figure 193. By Type Map-Market Size (USD Billion) & Growth Rate (%), 2023
- Figure 194. By Integration Map-Market Size (USD Billion) & Growth Rate (%), 2023
- Figure 195. By Material Map-Market Size (USD Billion) & Growth Rate (%), 2023
- Figure 196. By End-user Map-Market Size (USD Billion) & Growth Rate (%), 2023
- Figure 197. By Region Map-Market Size (USD Billion) & Growth Rate (%), 2023
Global integrated passive devices market size was valued USD 1.41 billion in 2023, the market is forecasted to reach a value of USD 2.98 billion by 2031, displaying a CAGR of 9.8% from 2024 to 2031. Integrated passive devices (IPD) refers to a rapidly growing segment within the electronics industry that involves the integration of passive components, such as resistors, capacitors, and inductors, onto a single chip or substrate. These components are essential for various electronic devices, including smartphones, wearables, automotive electronics, and IoT devices. The integrated passive devices offer several advantages, including reduced footprint, enhanced performance, and improved reliability, making them increasingly popular among manufacturers. As a result, the integrated passive devices are ideal for a wide range of end-users such as consumer electronics, automotive, telecom, healthcare, and energy and power.
The market for integrated passive devices is witnessing significant growth due to the rising demand for miniaturized and compact electronic devices with improved functionality. The proliferation of smartphones and connected devices, coupled with advancements in semiconductor technology, is driving the market further. For instance, according to the recent statistics published by the Semiconductor Industry Association (SIA), in 2021, the global semiconductor industry sales were USD 555.9 billion, and in 2022, it was USD 574.1 billion, the highest-ever annual total. In 2022, the year-on-year growth rate of the global semiconductor industry was 3.3% as opposed to 2021. Additionally, the increasing adoption of 5G technology and the Internet of Things (IoT) applications are creating a substantial demand for integrated passive devices, as these components play a crucial role in enabling high-frequency communication and miniaturized IoT devices.
Proliferation of Smart Phones and Connected Devices are Driving Integrated Passive Devices Market
The rise in the demand for smartphones and connected devices is a significant driving force behind the growth of the integrated passive devices (IPD) market. As the global population increasingly relies on smartphones and connected devices for communication, entertainment, and productivity, the demand for smaller, more efficient, and powerful electronic components has surged. Integrated passive devices, which integrate essential passive components like resistors, capacitors, and inductors into a single chip, play a crucial role in enhancing the performance, miniaturization, and energy efficiency of these devices.
Smartphones require compact and high-performance components to support their multifunctional capabilities. Integrated passive devices enable manufacturers to reduce the overall size of smartphones and other connected devices while improving their functionality and reliability. These components are vital for functions like signal filtering, power management, and impedance matching in wireless communication technologies, thereby ensuring seamless connectivity and optimal performance.
For instance, according to recent data published by YouAppi., in 2023, the prevalence of smartphones has reached unprecedented levels, with a staggering 6.8 billion users globally. The United States stands out with 94.40% of millennials and 91% of college graduates owning smartphones. This widespread adoption has significantly impacted daily routines, as almost half of the U.S. population spends 5 to 6 hours on their smartphones every day. 72% of teenagers habitually check their phone messages and notifications immediately upon waking up. Nomophobia, the fear of being without a mobile phone, affects a staggering 99.2% of smartphone users.
Growing Adoption in 5G Technologies Influencing Integrated Passive Devices Market
The rapid adoption of 5G technologies is significantly influencing the integrated passive devices (IPD) market. There is a surging demand for high-performance, compact, and efficient passive components in telecommunications infrastructure and mobile devices with the rollout of 5G networks worldwide. 5G networks require advanced radio frequency (RF) components, antennas, and filters to handle the higher data speeds and increased network traffic. Integrated passive devices, which combine various passive components like resistors, capacitors, and inductors into a single package, have emerged as a vital solution to meet the stringent requirements of 5G technology.
Integrated passive devices (IPDs) offer superior miniaturization and integration capabilities, enabling the design of smaller and more power-efficient 5G devices and infrastructure equipment. These components enhance the performance of RF modules, enabling seamless data transmission and reception in 5G networks. The need for integrated passive devices (IPDs) in 5G applications escalates as the demand for high-speed internet and low latency communication continues to grow. Moreover, integrated passive devices (IPDs) play a crucial role in enabling the deployment of Massive Multiple-Input, Multiple-Output (MIMO) technology, which is fundamental to 5G networks. Massive MIMO relies on advanced antenna systems that require compact and high-performance passive components, precisely what IPDs offer. As 5G technology becomes more ubiquitous, the integrated passive devices market is poised to expand further, driven by the ongoing evolution and implementation of 5G networks across various sectors, including telecommunications, Internet of Things (IoT), and smart devices.
North America Dominates the Integrated Passive Devices Market
North America boasts a thriving consumer electronics market, with a high demand for miniaturized and efficient electronic devices. Integrated passive devices (IPDs), with their ability to offer compact integration of passive components catering perfectly to this demand. The automotive industry, another significant sector in the region, has embraced integrated passive devices (IPDs) in electronic control units, infotainment systems, and advanced driver assistance systems (ADAS). Additionally, the region's early adoption of cutting-edge technologies, such as 5G, IoT, and smart devices, has created a substantial demand for high-performance, compact passive components like integrated passive devices (IPDs). The telecommunications sector, in particular, has witnessed a rapid deployment of 5G networks in North America, thereby driving the need for advanced radio frequency (RF) components, where integrated passive devices (IPDs) play a pivotal role.
Government Initiatives
The governments of various countries are implementing strategic initiatives and policies to boost the revenue advancement of the integrated passive devices (IPDs) market growth. For instance, the European Commission and its member states have taken decisive actions to reinforce Europe's "strategic autonomy" in the semiconductor industry. The European Commission initiatives include earmarking a substantial sum of up to USD 37.8 billion (Euro 35 billion) to bolster advanced semiconductor production capabilities within the European Union (EU). In March 2021, the European Union countries implemented the "2030 Digital Compass Initiative," which explicitly outlines an objective to elevate the EU's global chip manufacturing share to 20% by 2030, a substantial increase from the current share of under 10%.
Likewise, in May 2021, South Korean President Moon Jae-in launched a new national semiconductor industrial policy, known as the "K-Belt Semiconductor Strategy," which focuses on geographic clusters. This strategy encompasses various measures, including significant tax credits for research and development (up to 50%) and manufacturing (16%), substantial long-term loans amounting to USD 886 million, federal R&D investments totaling USD 1.3 billion, regulatory simplifications, and infrastructure upgrades. These efforts come in response to intensified competition from the countries such as the United States and China, both of which are intensifying their focus on bolstering their respective semiconductor industries. The Semiconductor Industry Association (SIA) estimates that these tax incentives for South Korean chip companies could provide incentives totaling approximately USD 55-65 billion over the next three years.
Impact of COVID-19
The COVID-19 pandemic had a notable impact on integrated passive devices market. The semiconductor industry, a major consumer of these components, experienced disruptions due to supply chain challenges, factory closures, and reduced demand caused by lockdowns and economic uncertainty. Production slowdowns and delays in technology upgrades affected the market, causing temporary setbacks. Additionally, travel restrictions impeded collaborations and hindered the timely delivery of materials, impacting project timelines.
However, the pandemic also accelerated certain trends within the market. The increased reliance on digital technologies, remote working, and the surge in demand for electronics, particularly for healthcare equipment and devices, bolstered the need for advanced semiconductors. This demand, coupled with ongoing technological advancements, created opportunities for integrated passive devices market to rebound.
Key Players Landscape and Outlook
The top players operating in the global integrated passive devices market are: STMicroelectronics N.V., Murata Manufacturing Co., Ltd., Semiconductor Components Industries, LLC, Infineon Technologies AG, Johanson Technology Inc, Taiwan Semiconductor Manufacturing Company, Johanson Technology Incorporated, OnChip Devices, Inc, Texas Instruments Incorporated, and Jiangsu Changdian Technology Co., Ltd. The integrated passive devices market is witnessing a swift growth trajectory due to the increasing emphasis placed by companies worldwide on establishing advanced semiconductor industry infrastructure. Furthermore, the market expansion is greatly facilitated by digitalization, along with significant investments made by companies to enhance research and development resources, engage in collaboration projects, bolster marketing efforts, and expand distribution networks. These factors collectively contribute to the rapid expansion of the market.
For instance, TSMC significantly raised its capital expenditure from around USD 15 billion in 2019 to an estimated USD 42-44 billion in 2022. Likewise, Samsung revealed its intention in 2023 to invest USD 230 billion in South Korea over the next two decades to establish new chip production capabilities. It's important to note that these investments require considerable time to come to fruition. Constructing semiconductor plants usually spans three to four years, and it may take an additional three to four years for these facilities to operate at maximum capacity.
In September 2023, X-FAB Silicon Foundries SE has recently announced the addition of new integrated passive device (IPD) fabrication capabilities to its existing offerings. This development reflects the growing significance of integrated passive devices in various industries. Therefore, the continuous expansion and innovation in this sector indicates a promising future for integrated passive devices.
Table of Contents
1. Research Methodology
2. Project Scope & Definitions
3. Impact of COVID-19 on Global Integrated Passive Devices Market
4. Executive Summary
5. Global Integrated Passive Devices Market Outlook, 2017-2031F
- 5.1. Market Size & Forecast
- 5.1.1. By Value
- 5.2. By Type
- 5.2.1. Radiofrequency (RF) IPDs
- 5.2.2. Electrostatic Discharge (ESD) IPDs
- 5.2.3. Electromagnetic Interference (EMI) IPDs
- 5.2.4. Others
- 5.3. By Integration
- 5.3.1. High
- 5.3.2. Low
- 5.4. By Material
- 5.4.1. Thin Film
- 5.4.2. Thick Film
- 5.5. By End-user
- 5.5.1. Consumer Electronics
- 5.5.2. Automotive
- 5.5.3. Telecom
- 5.5.4. Healthcare
- 5.5.5. Energy & Power
- 5.5.6. Others
- 5.6. By Region
- 5.6.1. North America
- 5.6.2. Europe
- 5.6.3. South America
- 5.6.4. Asia-Pacific
- 5.6.5. Middle East and Africa
- 5.7. By Company Market Share (%), 2022
6. Global Integrated Passive Devices Market Outlook, By Region, 2017-2031F
- 6.1. North America*
- 6.1.1. Market Size & Forecast
- 6.1.1.1. By Value
- 6.1.2. By Type
- 6.1.2.1. Radiofrequency (RF) IPDs
- 6.1.2.2. Electrostatic Discharge (ESD) IPDs
- 6.1.2.3. Electromagnetic Interference (EMI) IPDs
- 6.1.2.4. Others
- 6.1.3. By Integration
- 6.1.3.1. High
- 6.1.3.2. Low
- 6.1.4. By Material
- 6.1.4.1. Thin Film
- 6.1.4.2. Thick Film
- 6.1.5. By End-user
- 6.1.5.1. Consumer Electronics
- 6.1.5.2. Automotive
- 6.1.5.3. Telecom
- 6.1.5.4. Healthcare
- 6.1.5.5. Energy & Power
- 6.1.5.6. Others
- 6.1.6. United States*
- 6.1.6.1. Market Size & Forecast
- 6.1.6.1.1. By Value
- 6.1.6.2. By Type
- 6.1.6.2.1. Radiofrequency (RF) IPDs
- 6.1.6.2.2. Electrostatic Discharge (ESD) IPDs
- 6.1.6.2.3. Electromagnetic Interference (EMI) IPDs
- 6.1.6.2.4. Others
- 6.1.6.3. By Integration
- 6.1.6.3.1. High
- 6.1.6.3.2. Low
- 6.1.6.4. By Material
- 6.1.6.4.1. Thin Film
- 6.1.6.4.2. Thick Film
- 6.1.6.5. By End-user
- 6.1.6.5.1. Consumer Electronics
- 6.1.6.5.2. Automotive
- 6.1.6.5.3. Telecom
- 6.1.6.5.4. Healthcare
- 6.1.6.5.5. Energy & Power
- 6.1.6.5.6. Others
- 6.1.1. Market Size & Forecast
All segments will be provided for all regions and countries covered:
- 6.1.7. Canada
- 6.1.8. Mexico
- 6.2. Europe
- 6.2.1. Germany
- 6.2.2. France
- 6.2.3. Italy
- 6.2.4. United Kingdom
- 6.2.5. Russia
- 6.2.6. Netherlands
- 6.2.7. Spain
- 6.2.8. Turkey
- 6.2.9. Poland
- 6.3. South America
- 6.3.1. Brazil
- 6.3.2. Argentina
- 6.4. Asia-Pacific
- 6.4.1. India
- 6.4.2. China
- 6.4.3. Japan
- 6.4.4. Australia
- 6.4.5. Vietnam
- 6.4.6. South Korea
- 6.4.7. Indonesia
- 6.4.8. Philippines
- 6.5. Middle East & Africa
- 6.5.1. Saudi Arabia
- 6.5.2. UAE
- 6.5.3. South Africa
7. Market Mapping, 2023
- 7.1. By Type
- 7.2. By Integration
- 7.3. By Material
- 7.4. By End-user
8. Macro Environment and Industry Structure
- 8.1. PESTEL Analysis
- 8.2. Porter's Five Forces Analysis
9. Market Dynamics
- 9.1. Growth Drivers
- 9.2. Growth Inhibitors (Challenges, Restraints)
10. Key Players Landscape
- 10.1. Competition Matrix of Top Five Market Leaders
- 10.2. Market Revenue Analysis of Top Five Market Leaders (in %, 2023)
- 10.3. Mergers and Acquisitions/Joint Ventures (If Applicable)
- 10.4. SWOT Analysis (For Five Market Players)
- 10.5. Patent Analysis (If Applicable)
11. Pricing Analysis
12. Case Studies (If applicable)
13. Key Players Outlook
- 13.1. Jiangsu Changdian Technology Co., Ltd.
- 13.1.1. Company Details
- 13.1.2. Key Management Personnel
- 13.1.3. Products & Services
- 13.1.4. Financials (As reported)
- 13.1.5. Key Market Focus & Geographical Presence
- 13.1.6. Recent Developments
- 13.2. STMicroelectronics N.V.
- 13.3. Murata Manufacturing Co., Ltd.
- 13.4. Semiconductor Components Industries, LLC
- 13.5. Infineon Technologies AG
- 13.6. Johanson Technology Inc
- 13.7. Taiwan Semiconductor Manufacturing Company
- 13.8. Johanson Technology Incorporated
- 13.9. OnChip Devices, Inc
- 13.10. Texas Instruments Incorporated
Companies mentioned above DO NOT hold any order as per market share and can be changed as per information available during research work.

