|
|
市場調査レポート
商品コード
1402430
受動・相互接続電子部品の世界市場の評価:部品別、用途別、地域別、機会、予測(2017年~2031年)Passive and Interconnecting Electronic Components Market Assessment, By Component, By Application, By Region, Opportunities and Forecast, 2017-2031F |
||||||

|
|||||||
カスタマイズ可能
|
|||||||


| 受動・相互接続電子部品の世界市場の評価:部品別、用途別、地域別、機会、予測(2017年~2031年) |
|
出版日: 2024年01月08日
発行: Markets & Data
ページ情報: 英文 223 Pages
納期: 3~5営業日
|

全表示
- 概要
- 図表
- 目次
世界の受動・相互接続電子部品の市場規模は、2023年に2,015億米ドル、2031年までに2,932億米ドルに達し、2024年~2031年の予測期間にCAGRで4.8%の成長が見込まれています。
市場の成長は、コンシューマーエレクトロニクスへの需要の増加、IoT用途、自動車の進歩によって促進されています。加えて、材料や製造プロセスにおける技術革新、オートメーションやスマート技術の普及が、受動・相互接続電子部品部門の拡大をさらに後押ししています。
さらにIoT用途では、受動・相互接続電子部品がIoTエコシステム内の無数のセンサーやデバイスを接続し電力を供給する上で不可欠な役割を果たすため、その成長が促進されています。これらの部品は、効率的なデータ伝送、電力管理、信号処理を可能にし、IoT技術特有のニーズに対応しています。例えば、2023年5月、Estuaryは、2023年末までに約66%のデバイスがIoTにリンクされ、合計198億台のIoTデバイスが使用されると予測しています。
プリント基板(PCB)の登場が市場成長を先導
プリント基板(PCB)の普及が市場を大きく押し上げています。PCBは受動・相互接続電子部品産業の促進要因となっており、現代の電子機器に不可欠な部品として機能しています。効率的な相互接続を可能にし、電子機器の性能向上に極めて重要な役割を果たしています。さらに、電子機器の小型化・高機能化に対する継続的な需要の高まりが、PCB産業の成長をさらに後押ししており、受動・相互接続電子部品市場の拡大に大きく寄与しています。
軍用レーダー製造の増加が市場を活性化
軍用レーダーシステムの生産の拡大が、世界の受動・相互接続電子部品市場の成功の重要な促進要因となっています。軍用レーダーは防衛や監視の用途に不可欠であり、関連する電子部品に対する高い需要につながっています。受動・相互接続部品メーカーは軍用レーダーシステムに重大な要素を供給する機会をつかみ、業界全体の拡大に寄与しており、需要の急増が市場の成長を後押ししています。
コンシューマーエレクトロニクス部門の進歩が広大な機会をもたらす
コンシューマーエレクトロニクス部門の進歩は、受動・相互接続電子部品産業に広大な機会をもたらしています。コンシューマーエレクトロニクスの需要が伸び続けていることから、抵抗器、コンデンサー、コネクターのような先進の受動・相互接続部品のニーズが高まっています。さらに、これらの部品は最新の電子機器の性能と機能性を高める上で重要な役割を果たしており、この動向はこれらの部品部門のメーカーやサプライヤーに大きな成長見通しをもたらしています。
アジア太平洋が市場成長を総体的に先導
アジア太平洋は、強固な製造エコシステム、費用対効果の高い労働力、技術への多額の投資とそれによる製造ハブ化などの要因によって市場をリードしました。さらに、同地域のコンシューマーエレクトロニクス市場の急成長や、急速な都市化、可処分所得水準の上昇が電子機器への需要を促進しています。さらに、電子産業を支援する政府の政策や取り組みも、市場成長に大きく寄与しています。こうした要因が重なり、アジア太平洋は受動・相互接続電子部品市場においてもっとも支配的な勢力の1つとして位置づけられています。
市場成長を後押しする政府の取り組み
市場では、技術革新を促進し、国の競争力を高め、規制遵守を保証するため、政府の取り組みが不可欠です。受動・相互接続電子部品産業の収益成長を補完する施策として、研究開発資金、業界標準、新興技術の採用を支援する政策があります。さらに、政府の支援は持続可能性を促進し、サプライチェーンの安全性や環境に対する影響といった世界の課題への対応にも役立ちます。また、政府がこの部門に積極的に関与することで、経済成長を促進し、雇用を創出し、技術力を向上させることができます。
当レポートでは、世界の受動・相互接続電子部品市場について調査分析し、市場規模と予測、市場力学、主要企業の情勢と見通しなどを提供しています。
目次
第1章 調査手法
第2章 プロジェクトの範囲と定義
第3章 世界の受動・相互接続電子部品市場に対するCOVID-19の影響
第4章 エグゼクティブサマリー
第5章 顧客の声
- 製品と市場のインテリジェンス
- 情報源
- 購入決定において考慮される要素
- 設置の目的
- 需給のメカニズム
- 安全規制の検討と理解
- 法令遵守の適用
- 既存のユーザーまたは購入予定者
第6章 世界の受動・相互接続電子部品市場の見通し(2017年~2031年)
- 市場規模と予測
- 金額
- 数量
- コンポーネント別
- 受動
- 相互接続
- 用途別
- IT・通信
- コンシューマーエレクトロニクス
- 航空宇宙・防衛
- 自動車
- 工業
- 医療
- 地域別
- 北米
- アジア太平洋
- 欧州
- 南米
- 中東・アフリカ
- 市場シェア:企業別(2023年)
第7章 世界の受動・相互接続電子部品市場の見通し:地域別(2017年~2031年)
- 北米
- 市場規模と予測
- コンポーネント別
- 用途別
- 米国
- カナダ
- メキシコ
- 欧州
- ドイツ
- フランス
- イタリア
- 英国
- ロシア
- オランダ
- スペイン
- トルコ
- ポーランド
- 南米
- ブラジル
- アルゼンチン
- アジア太平洋
- インド
- 中国
- 日本
- オーストラリア
- ベトナム
- 韓国
- インドネシア
- フィリピン
- 中東・アフリカ
- サウジアラビア
- アラブ首長国連邦
- 南アフリカ
第8章 市場マッピング(2023年)
- コンポーネント別
- 用途別
- 地域別
第9章 マクロ環境と産業構造
- 需給分析
- 輸出入の分析
- バリューチェーン分析
- PESTEL分析
- ポーターのファイブフォース分析
第10章 市場力学
- 成長促進要因
- 成長抑制要因(課題、抑制要因)
第11章 主要企業情勢
- マーケットリーダー上位5社の競合マトリクス
- マーケットリーダー上位5社の市場収益分析(2023年)
- 合併と買収/合弁事業(該当する場合)
- SWOT分析(市場参入企業5社)
- 特許分析(該当する場合)
第12章 価格分析
第13章 ケーススタディ
第14章 主要企業の見通し
- Panasonic Corporation
- AVX Corporation
- TDK Corporation
- Hosiden Corporation
- Fenghua (HK) Electronics Ltd.
- Fujitsu Component Limited
- Molex Incorporated
- Yageo Corporation
- TE connectivity
- Nichicon Corporation
第15章 戦略的推奨事項
第16章 当社について、免責事項
List of Tables
- Table 1. Pricing Analysis of Products from Key Players
- Table 2. Competition Matrix of Top 5 Market Leaders
- Table 3. Mergers & Acquisitions/ Joint Ventures (If Applicable)
- Table 4. About Us - Regions and Countries Where We Have Executed Client Projects
List of Figures
- Figure 1. Global Passive and Interconnecting Electronic Components Market, By Value, In USD Billion, 2017-2031F
- Figure 2. Global Passive and Interconnecting Electronic Components Market, By Volume, in Thousand Units, 2017-2031F
- Figure 3. Global Passive and Interconnecting Electronic Components Market Share (%), By Component, 2017-2031F
- Figure 4. Global Passive and Interconnecting Electronic Components Market Share (%), By Application, 2017-2031F
- Figure 5. Global Passive and Interconnecting Electronic Components Market Share (%), By Region, 2017-2031F
- Figure 6. North America Passive and Interconnecting Electronic Components Market, By Value, In USD Billion, 2017-2031F
- Figure 7. North America Passive and Interconnecting Electronic Components Market, By Volume, in Thousand Units, 2017-2031F
- Figure 8. North America Passive and Interconnecting Electronic Components Market Share (%), By Component, 2017-2031F
- Figure 9. North America Passive and Interconnecting Electronic Components Market Share (%), By Application, 2017-2031F
- Figure 10. North America Passive and Interconnecting Electronic Components Market Share (%), By Country, 2017-2031F
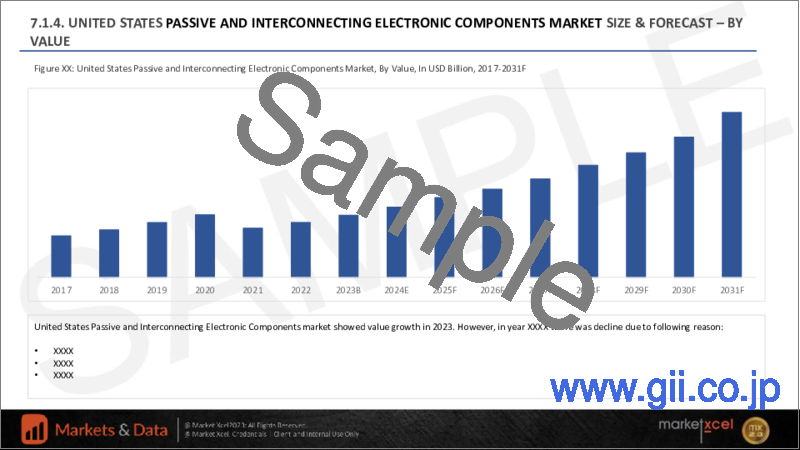
- Figure 11. United States Passive and Interconnecting Electronic Components Market, By Value, In USD Billion, 2017-2031F
- Figure 12. United States Passive and Interconnecting Electronic Components Market, By Volume, in Thousand Units, 2017-2031F
- Figure 13. United States Passive and Interconnecting Electronic Components Market Share (%), By Component, 2017-2031F
- Figure 14. United States Passive and Interconnecting Electronic Components Market Share (%), By Application, 2017-2031F
- Figure 15. Canada Passive and Interconnecting Electronic Components Market, By Value, In USD Billion, 2017-2031F
- Figure 16. Canada Passive and Interconnecting Electronic Components Market, By Volume, in Thousand Units, 2017-2031F
- Figure 17. Canada Passive and Interconnecting Electronic Components Market Share (%), By Component, 2017-2031F
- Figure 18. Canada Passive and Interconnecting Electronic Components Market Share (%), By Application, 2017-2031F
- Figure 19. Mexico Passive and Interconnecting Electronic Components Market, By Value, In USD Billion, 2017-2031F
- Figure 20. Mexico Passive and Interconnecting Electronic Components Market, By Volume, in Thousand Units, 2017-2031F
- Figure 21. Mexico Passive and Interconnecting Electronic Components Market Share (%), By Component, 2017-2031F
- Figure 22. Mexico Passive and Interconnecting Electronic Components Market Share (%), By Application, 2017-2031F
- Figure 23. Europe Passive and Interconnecting Electronic Components Market, By Value, In USD Billion, 2017-2031F
- Figure 24. Europe Passive and Interconnecting Electronic Components Market, By Volume, in Thousand Units, 2017-2031F
- Figure 25. Europe Passive and Interconnecting Electronic Components Market Share (%), By Component, 2017-2031F
- Figure 26. Europe Passive and Interconnecting Electronic Components Market Share (%), By Application, 2017-2031F
- Figure 27. Europe Passive and Interconnecting Electronic Components Market Share (%), By Country, 2017-2031F
- Figure 28. Germany Passive and Interconnecting Electronic Components Market, By Value, In USD Billion, 2017-2031F
- Figure 29. Germany Passive and Interconnecting Electronic Components Market, By Volume, in Thousand Units, 2017-2031F
- Figure 30. Germany Passive and Interconnecting Electronic Components Market Share (%), By Component, 2017-2031F
- Figure 31. Germany Passive and Interconnecting Electronic Components Market Share (%), By Application, 2017-2031F
- Figure 32. France Passive and Interconnecting Electronic Components Market, By Value, In USD Billion, 2017-2031F
- Figure 33. France Passive and Interconnecting Electronic Components Market, By Volume, in Thousand Units, 2017-2031F
- Figure 34. France Passive and Interconnecting Electronic Components Market Share (%), By Component, 2017-2031F
- Figure 35. France Passive and Interconnecting Electronic Components Market Share (%), By Application, 2017-2031F
- Figure 36. Italy Passive and Interconnecting Electronic Components Market, By Value, In USD Billion, 2017-2031F
- Figure 37. Italy Passive and Interconnecting Electronic Components Market, By Volume, in Thousand Units, 2017-2031F
- Figure 38. Italy Passive and Interconnecting Electronic Components Market Share (%), By Component, 2017-2031F
- Figure 39. Italy Passive and Interconnecting Electronic Components Market Share (%), By Application, 2017-2031F
- Figure 40. United Kingdom Passive and Interconnecting Electronic Components Market, By Value, In USD Billion, 2017-2031F
- Figure 41. United Kingdom Passive and Interconnecting Electronic Components Market, By Volume, in Thousand Units, 2017-2031F
- Figure 42. United Kingdom Passive and Interconnecting Electronic Components Market Share (%), By Component, 2017-2031F
- Figure 43. United Kingdom Passive and Interconnecting Electronic Components Market Share (%), By Application, 2017-2031F
- Figure 44. Russia Passive and Interconnecting Electronic Components Market, By Value, In USD Billion, 2017-2031F
- Figure 45. Russia Passive and Interconnecting Electronic Components Market, By Volume, in Thousand Units, 2017-2031F
- Figure 46. Russia Passive and Interconnecting Electronic Components Market Share (%), By Component, 2017-2031F
- Figure 47. Russia Passive and Interconnecting Electronic Components Market Share (%), By Application, 2017-2031F
- Figure 48. Netherlands Passive and Interconnecting Electronic Components Market, By Value, In USD Billion, 2017-2031F
- Figure 49. Netherlands Passive and Interconnecting Electronic Components Market, By Volume, in Thousand Units, 2017-2031F
- Figure 50. Netherlands Passive and Interconnecting Electronic Components Market Share (%), By Component, 2017-2031F
- Figure 51. Netherlands Passive and Interconnecting Electronic Components Market Share (%), By Application, 2017-2031F
- Figure 52. Spain Passive and Interconnecting Electronic Components Market, By Value, In USD Billion, 2017-2031F
- Figure 53. Spain Passive and Interconnecting Electronic Components Market, By Volume, in Thousand Units, 2017-2031F
- Figure 54. Spain Passive and Interconnecting Electronic Components Market Share (%), By Component, 2017-2031F
- Figure 55. Spain Passive and Interconnecting Electronic Components Market Share (%), By Application, 2017-2031F
- Figure 56. Turkey Passive and Interconnecting Electronic Components Market, By Value, In USD Billion, 2017-2031F
- Figure 57. Turkey Passive and Interconnecting Electronic Components Market, By Volume, in Thousand Units, 2017-2031F
- Figure 58. Turkey Passive and Interconnecting Electronic Components Market Share (%), By Component, 2017-2031F
- Figure 59. Turkey Passive and Interconnecting Electronic Components Market Share (%), By Application, 2017-2031F
- Figure 60. Poland Passive and Interconnecting Electronic Components Market, By Value, In USD Billion, 2017-2031F
- Figure 61. Poland Passive and Interconnecting Electronic Components Market, By Volume, in Thousand Units, 2017-2031F
- Figure 62. Poland Passive and Interconnecting Electronic Components Market Share (%), By Component, 2017-2031F
- Figure 63. Poland Passive and Interconnecting Electronic Components Market Share (%), By Application, 2017-2031F
- Figure 64. South America Passive and Interconnecting Electronic Components Market, By Value, In USD Billion, 2017-2031F
- Figure 65. South America Passive and Interconnecting Electronic Components Market, By Volume, in Thousand Units, 2017-2031F
- Figure 66. South America Passive and Interconnecting Electronic Components Market Share (%), By Component, 2017-2031F
- Figure 67. South America Passive and Interconnecting Electronic Components Market Share (%), By Application, 2017-2031F
- Figure 68. South America Passive and Interconnecting Electronic Components Market Share (%), By Country, 2017-2031F
- Figure 69. Brazil Passive and Interconnecting Electronic Components Market, By Value, In USD Billion, 2017-2031F
- Figure 70. Brazil Passive and Interconnecting Electronic Components Market, By Volume, in Thousand Units, 2017-2031F
- Figure 71. Brazil Passive and Interconnecting Electronic Components Market Share (%), By Component, 2017-2031F
- Figure 72. Brazil Passive and Interconnecting Electronic Components Market Share (%), By Application, 2017-2031F
- Figure 73. Argentina Passive and Interconnecting Electronic Components Market, By Value, In USD Billion, 2017-2031F
- Figure 74. Argentina Passive and Interconnecting Electronic Components Market, By Volume, in Thousand Units, 2017-2031F
- Figure 75. Argentina Passive and Interconnecting Electronic Components Market Share (%), By Component, 2017-2031F
- Figure 76. Argentina Passive and Interconnecting Electronic Components Market Share (%), By Application, 2017-2031F
- Figure 77. Asia-Pacific Passive and Interconnecting Electronic Components Market, By Value, In USD Billion, 2017-2031F
- Figure 78. Asia-Pacific Passive and Interconnecting Electronic Components Market, By Volume, in Thousand Units, 2017-2031F
- Figure 79. Asia-Pacific Passive and Interconnecting Electronic Components Market Share (%), By Component, 2017-2031F
- Figure 80. Asia-Pacific Passive and Interconnecting Electronic Components Market Share (%), By Application, 2017-2031F
- Figure 81. Asia-Pacific Passive and Interconnecting Electronic Components Market Share (%), By Country, 2017-2031F
- Figure 82. India Passive and Interconnecting Electronic Components Market, By Value, In USD Billion, 2017-2031F
- Figure 83. India Passive and Interconnecting Electronic Components Market, By Volume, in Thousand Units, 2017-2031F
- Figure 84. India Passive and Interconnecting Electronic Components Market Share (%), By Component, 2017-2031F
- Figure 85. India Passive and Interconnecting Electronic Components Market Share (%), By Application, 2017-2031F
- Figure 86. China Passive and Interconnecting Electronic Components Market, By Value, In USD Billion, 2017-2031F
- Figure 87. China Passive and Interconnecting Electronic Components Market, By Volume, in Thousand Units, 2017-2031F
- Figure 88. China Passive and Interconnecting Electronic Components Market Share (%), By Component, 2017-2031F
- Figure 89. China Passive and Interconnecting Electronic Components Market Share (%), By Application, 2017-2031F
- Figure 90. Japan Passive and Interconnecting Electronic Components Market, By Value, In USD Billion, 2017-2031F
- Figure 91. Japan Passive and Interconnecting Electronic Components Market, By Volume, in Thousand Units, 2017-2031F
- Figure 92. Japan Passive and Interconnecting Electronic Components Market Share (%), By Component, 2017-2031F
- Figure 93. Japan Passive and Interconnecting Electronic Components Market Share (%), By Application, 2017-2031F
- Figure 94. Australia Passive and Interconnecting Electronic Components Market, By Value, In USD Billion, 2017-2031F
- Figure 95. Australia Passive and Interconnecting Electronic Components Market, By Volume, in Thousand Units, 2017-2031F
- Figure 96. Australia Passive and Interconnecting Electronic Components Market Share (%), By Component, 2017-2031F
- Figure 97. Australia Passive and Interconnecting Electronic Components Market Share (%), By Application, 2017-2031F
- Figure 98. Vietnam Passive and Interconnecting Electronic Components Market, By Value, In USD Billion, 2017-2031F
- Figure 99. Vietnam Passive and Interconnecting Electronic Components Market, By Volume, in Thousand Units, 2017-2031F
- Figure 100. Vietnam Passive and Interconnecting Electronic Components Market Share (%), By Component, 2017-2031F
- Figure 101. Vietnam Passive and Interconnecting Electronic Components Market Share (%), By Application, 2017-2031F
- Figure 102. South Korea Passive and Interconnecting Electronic Components Market, By Value, In USD Billion, 2017-2031F
- Figure 103. South Korea Passive and Interconnecting Electronic Components Market, By Volume, in Thousand Units, 2017-2031F
- Figure 104. South Korea Passive and Interconnecting Electronic Components Market Share (%), By Component, 2017-2031F
- Figure 105. South Korea Passive and Interconnecting Electronic Components Market Share (%), By Application, 2017-2031F
- Figure 106. Indonesia Passive and Interconnecting Electronic Components Market, By Value, In USD Billion, 2017-2031F
- Figure 107. Indonesia Passive and Interconnecting Electronic Components Market, By Volume, in Thousand Units, 2017-2031F
- Figure 108. Indonesia Passive and Interconnecting Electronic Components Market Share (%), By Component, 2017-2031F
- Figure 109. Indonesia Passive and Interconnecting Electronic Components Market Share (%), By Application, 2017-2031F
- Figure 110. Philippines Passive and Interconnecting Electronic Components Market, By Value, In USD Billion, 2017-2031F
- Figure 111. Philippines Passive and Interconnecting Electronic Components Market, By Volume, in Thousand Units, 2017-2031F
- Figure 112. Philippines Passive and Interconnecting Electronic Components Market Share (%), By Component, 2017-2031F
- Figure 113. Philippines Passive and Interconnecting Electronic Components Market Share (%), By Application, 2017-2031F
- Figure 114. Middle East & Africa Passive and Interconnecting Electronic Components Market, By Value, In USD Billion, 2017-2031F
- Figure 115. Middle East & Africa Passive and Interconnecting Electronic Components Market, By Volume, in Thousand Units, 2017-2031F
- Figure 116. Middle East & Africa Passive and Interconnecting Electronic Components Market Share (%), By Component, 2017-2031F
- Figure 117. Middle East & Africa Passive and Interconnecting Electronic Components Market Share (%), By Application, 2017-2031F
- Figure 118. Middle East & Africa Passive and Interconnecting Electronic Components Market Share (%), By Country, 2017-2031F
- Figure 119. Saudi Arabia Passive and Interconnecting Electronic Components Market, By Value, In USD Billion, 2017-2031F
- Figure 120. Saudi Arabia Passive and Interconnecting Electronic Components Market, By Volume, in Thousand Units, 2017-2031F
- Figure 121. Saudi Arabia Passive and Interconnecting Electronic Components Market Share (%), By Component, 2017-2031F
- Figure 122. Saudi Arabia Passive and Interconnecting Electronic Components Market Share (%), By Application, 2017-2031F
- Figure 123. UAE Passive and Interconnecting Electronic Components Market, By Value, In USD Billion, 2017-2031F
- Figure 124. UAE Passive and Interconnecting Electronic Components Market, By Volume, in Thousand Units, 2017-2031F
- Figure 125. UAE Passive and Interconnecting Electronic Components Market Share (%), By Component, 2017-2031F
- Figure 126. UAE Passive and Interconnecting Electronic Components Market Share (%), By Application, 2017-2031F
- Figure 127. South Africa Passive and Interconnecting Electronic Components Market, By Value, In USD Billion, 2017-2031F
- Figure 128. South Africa Passive and Interconnecting Electronic Components Market, By Volume, in Thousand Units, 2017-2031F
- Figure 129. South Africa Passive and Interconnecting Electronic Components Market Share (%), By Component, 2017-2031F
- Figure 130. South Africa Passive and Interconnecting Electronic Components Market Share (%), By Application, 2017-2031F
- Figure 131. By Component Map-Market Size (USD Billion) & Growth Rate (%), 2023
- Figure 132. By Application Map-Market Size (USD Billion) & Growth Rate (%), 2023
- Figure 133. By Region Map-Market Size (USD Billion) & Growth Rate (%), 2023
The global passive and interconnecting electronic components market size was valued at USD 201.5 billion in 2023, which is expected to reach USD 293.2 billion in 2031, with a CAGR of 4.8% for the forecasted period between 2024 and 2031.
Passive and interconnecting electronic components offer essential functions in electronic devices, including signal transmission, energy storage, and filtering, thereby enhancing overall performance and reliability. The growth of the passive and interconnecting electronic components market is driven by increasing demand for consumer electronics, IoT applications, and automotive advancements. Additionally, innovations in materials and manufacturing processes, along with the proliferation of automation and smart technologies, further fuel the expansion of the passive and interconnecting electronic components sector.
In addition, IoT applications are propelling the growth of passive and interconnecting electronic components due to their essential role in connecting and powering the myriad sensors and devices within the IoT ecosystem. These components enable efficient data transmission, power management, and signal processing, thereby addressing the unique needs of IoT technology. For example, in May 2023, Estuary projected that by the end of 2023, approximately 66% of devices will be linked to the IoT, with an estimated total of 19.8 billion IoT devices in use.
The Emergence of Printed Circuit Boards (PCBs) is Spearheading the Market Growth
The market is experiencing a significant boost due to the rise in usage of printed circuit boards (PCBs). PCBs have become a driving force in the passive and interconnecting electronic components industry, serving as essential components in modern electronics. They enable efficient interconnections and play a pivotal role in enhancing the performance of electronic devices. Moreover, the continuous growing demand for smaller, and more sophisticated electronic equipment has further propelled the PCB industry growth, thereby making it a key contributor to the expansion of the passive and interconnecting electronic components market.
For example, in August 2023, Bloom Energy successfully implemented the initial stage of a 10-megawatt (MW) solid oxide fuel cell agreement with Unimicron Technology Corp, a manufacturer specializing in chip substrate and printed circuit boards (PCB) based in Taiwan. The installation is currently delivering clean and dependable power to support Unimicron's critical operations and clean rooms.
Rise in Manufacturing of Military Radars is Propelling the Market Prosperity
The growing production of military radar systems is a key driver of the global passive and interconnecting electronic components market's success. Military radars are essential for defense and surveillance applications, leading to heightened demand for associated electronic components. The surge in demand is fuelling the market's growth as manufacturers of passive and interconnecting components seize opportunities to supply crucial elements for military radar systems, thus contributing to the overall expansion of the industry.
For example, in August 2023, The U.S. Army granted the approval for the Sentinel A4 active electronically scanned array, which serves as the forthcoming radar technology set to replace the existing phase and frequency scanned arrays of Sentinel A3 and its predecessors. The advanced system boasts the capability to detect various threats, including cruise missiles, drones, and rockets.
Advancement of Consumer Electronics Sector is Catering to Extensive Opportunities
The consumer electronics sector's progress is creating vast opportunities in the passive and interconnecting electronic components industry. As the demand for consumer electronics continue to grow, the need for advanced passive and interconnecting components like resistors, capacitors, and connectors increases. Moreover, this trend offers substantial growth prospects for manufacturers and suppliers in these component sectors, as they play a crucial role in enhancing the performance and functionality of modern electronic devices.
For example, in January 2023, Sharp Corporation revealed its plans to introduce three versions (75-inch, 70-inch, and 65-inch) of its premium AQUOS XLED 4K TVs to the United States market in the spring of 2023. Concurrently, Sharp stated that it would bring six additional television models to the United States, including OLED TVs (55-inch and 65-inch) and LCD TVs (50-inch, 55-inch, 65-inch, and 75-inch), all featuring the Roku smart TV operating system. The diverse range of offerings ensures that there's a suitable choice for all consumers' preferences and requirements.
Asia-Pacific Comprehensively Spearheaded the Market Growth
Asia-Pacific led the passive and interconnecting electronic components market due to several factors such as its robust manufacturing ecosystem, cost-effective labor, and substantial investments in technology which has made it a manufacturing hub. Additionally, the region's burgeoning consumer electronics market, rapid urbanization, and increasing disposable income levels have fueled the demand for electronic devices. Moreover, the government policies and initiatives supporting the electronics industry have contributed significantly to the market growth. The combination of factors has positioned Asia-Pacific as one of the most dominant forces in the market for passive and interconnecting electronic components.
For example, in November 2022, Japan unveiled its plans to engage in the research and development (R&D) cooperation with the United States, committing approximately USD 2.47 trillion (Yen 350 billion) for the advancement of next-generation semiconductors. The overall investment amounted up to USD 3.06 trillion (Yen 450 billion) to establish advanced chip production facilities in Japan.
Government Initiatives to Augment the Market Growth
Government initiatives are essential in the passive and interconnecting electronic components market to foster innovation, enhance national competitiveness, and ensure regulatory compliance. The measures supplementing the revenue growth of the passive and interconnecting electronic components industry are research & development funding, industry standards, and policies that support the adoption of emerging technologies. Moreover, government support promotes sustainability and helps in addressing global challenges like supply chain security and environmental impact. Moreover, by actively engaging in this sector, governments can drive economic growth, create jobs, and advance their technological capabilities.
For example, the Production Linked Incentive Scheme (PLI) for IT Hardware, introduced on March 3rd, 2021, by the Indian government offers eligible companies incentives ranging from 1% to 4% on net incremental sales compared to a base year. This scheme encompasses the production of laptops, tablets, all-in-one pcs, and servers in India and extends over a four-year period.
Impact of COVID-19
The COVID-19 pandemic brought significant disruptions to the passive and interconnecting electronic components of industry. Pre-COVID, the passive and interconnecting electronic components sector was experiencing steady growth, driven by rising demand for consumer electronics, automotive technology, and telecommunications. However, the pandemic severely disrupted global supply chains, manufacturing operations, and consumer spending, resulting in growth rate declination of the market. In the post-COVID landscape, the increased reliance on remote work, e-learning, and IoT devices drove demand for electronic components. Supply chains were diversified, and automation investments were made to enhance future resilience. Moreover, the growth of 5G technology, EVs, and renewable energy solutions further fueled the demand, thereby indicating a gradual recovery and promising future growth prospects in this dynamically evolving technological sector.
Key Players Landscape and Outlook
The top companies operating in the global passive and interconnecting electronic components industry are involved in the manufacturing of the passive and interconnecting electronic components, which has highly advanced manufacturing facilities to ensure the production in bulk quantity. The industry is undergoing swift progress, with top companies significantly increasing their investments in the production of cutting-edge electronic equipment. Additionally, these firms are committing substantial resources to enhance their competitive standing and financial performance. They are actively pursuing collaborations, acquisitions, and partnerships, reshaping the industry's dynamics and accelerating the overall market expansion.
In September 2023, Panasonic Connect Europe unveiled two novel 1-Chip DLP laser projectors aimed at broadening the horizons of location-based entertainment. The PT-REQ15 projector represents Panasonic's inaugural 1-Chip DLP 4K Projector, providing an impressive 15,000lm brightness, while its counterpart, the PT-REZ15, delivers 15,000lm with WUXGA (1920 x 1200) resolution. Their compact design and high-quality visual output enable integrators to avoid costly electrical modifications on-site and introduce immersive experiences to constrained installation spaces.
Table of Contents
1. Research Methodology
2. Project Scope & Definitions
3. Impact of COVID-19 on Global Passive and Interconnecting Electronic Components Market
4. Executive Summary
5. Voice of Customer
- 5.1. Product and Market Intelligence
- 5.2. Sources of Information
- 5.3. Factors Considered in Purchase Decisions
- 5.3.1. Overall Expenses
- 5.3.2. Facility Requirement
- 5.3.3. Number of Installation Units
- 5.3.4. Efficiency
- 5.3.5. After-Sales Support
- 5.4. Purpose of Installation
- 5.5. Demand and Supply Mechanism
- 5.6. Consideration and Understanding of Safety Regulations
- 5.7. Application of Legal Compliances
- 5.8. Existing User or Intended Purchaser
6. Global Passive and Interconnecting Electronic Components Market Outlook, 2017-2031F
- 6.1. Market Size & Forecast
- 6.1.1. By Value
- 6.1.2. By Volume
- 6.2. By Component
- 6.2.1. Passive
- 6.2.1.1. Capacitors
- 6.2.1.2. Resistors
- 6.2.1.3. Transformers
- 6.2.1.4. Diode
- 6.2.1.5. Others
- 6.2.2. Interconnecting
- 6.2.2.1. Relays
- 6.2.2.2. PCB
- 6.2.2.3. Connectors/Sockets
- 6.2.2.4. Switches
- 6.2.2.5. Others
- 6.2.1. Passive
- 6.3. By Application
- 6.3.1. IT and Telecommunication
- 6.3.1.1. Networking Devices
- 6.3.1.2. Telecom Equipment
- 6.3.1.3. Others
- 6.3.2. Consumer Electronics
- 6.3.2.1. Personal Computers
- 6.3.2.2. Audio and Video Systems
- 6.3.2.3. Storage Devices
- 6.3.2.4. Home Appliances
- 6.3.2.5. Others
- 6.3.3. Aerospace and Defense
- 6.3.3.1. Military Radars
- 6.3.3.2. Aircraft systems
- 6.3.3.3. Others
- 6.3.4. Automotive
- 6.3.4.1. Infotainment Systems
- 6.3.4.2. Driver Assistance Systems
- 6.3.4.3. Others
- 6.3.5. Industrial
- 6.3.5.1. Power Electronics
- 6.3.5.2. Photovoltaic Systems
- 6.3.5.3. Others
- 6.3.6. Healthcare
- 6.3.6.1. Consumer Medical Devices
- 6.3.6.2. Medical Imaging Equipment
- 6.3.6.3. Others
- 6.3.1. IT and Telecommunication
- 6.4. By Region
- 6.4.1. North America
- 6.4.2. Asia-Pacific
- 6.4.3. Europe
- 6.4.4. South America
- 6.4.5. Middle East and Africa
- 6.5. By Company Market Share (%), 2023
7. Global Passive and Interconnecting Electronic Components Market Outlook, By Region, 2017-2031F
- 7.1. North America*
- 7.1.1. Market Size & Forecast
- 7.1.1.1. By Value
- 7.1.1.2. By Volume
- 7.1.2. By Component
- 7.1.2.1. Passive
- 7.1.2.1.1. Capacitors
- 7.1.2.1.2. Resistors
- 7.1.2.1.3. Transformers
- 7.1.2.1.4. Diode
- 7.1.2.1.5. Others
- 7.1.2.2. Interconnecting
- 7.1.2.2.1. Relays
- 7.1.2.2.2. PCB
- 7.1.2.2.3. Connectors/Sockets
- 7.1.2.2.4. Switches
- 7.1.2.2.5. Others
- 7.1.3. By Application
- 7.1.3.1. IT and Telecommunication
- 7.1.3.1.1. Networking Devices
- 7.1.3.1.2. Telecom Equipment
- 7.1.3.1.3. Others
- 7.1.3.2. Consumer Electronics
- 7.1.3.2.1. Personal Computers
- 7.1.3.2.2. Audio and Video Systems
- 7.1.3.2.3. Storage Devices
- 7.1.3.2.4. Home Appliances
- 7.1.3.2.5. Others
- 7.1.3.3. Aerospace and Defense
- 7.1.3.3.1. Military Radars
- 7.1.3.3.2. Aircraft systems
- 7.1.3.3.3. Others
- 7.1.3.4. Automotive
- 7.1.3.4.1. Infotainment Systems
- 7.1.3.4.2. Driver Assistance Systems
- 7.1.3.4.3. Others
- 7.1.3.5. Industrial
- 7.1.3.5.1. Power Electronics
- 7.1.3.5.2. Photovoltaic Systems
- 7.1.3.5.3. Others
- 7.1.3.6. Healthcare
- 7.1.3.6.1. Consumer Medical Devices
- 7.1.3.6.2. Medical Imaging Equipment
- 7.1.3.6.3. Others
- 7.1.4. United States*
- 7.1.4.1. Market Size & Forecast
- 7.1.4.1.1. By Value
- 7.1.4.1.2. By Volume
- 7.1.4.2. By Component
- 7.1.4.2.1. Passive
- 7.1.4.2.1.1. Capacitors
- 7.1.4.2.1.2. Resistors
- 7.1.4.2.1.3. Transformers
- 7.1.4.2.1.4. Diode
- 7.1.4.2.1.5. Others
- 7.1.4.2.2. Interconnecting
- 7.1.4.2.2.1. Relays
- 7.1.4.2.2.2. PCB
- 7.1.4.2.2.3. Connectors/Sockets
- 7.1.4.2.2.4. Switches
- 7.1.4.2.2.5. Others
- 7.1.4.3. By Application
- 7.1.4.3.1. IT and Telecommunication
- 7.1.4.3.1.1. Networking Devices
- 7.1.4.3.1.2. Telecom Equipment
- 7.1.4.3.1.3. Others
- 7.1.4.3.2. Consumer Electronics
- 7.1.4.3.2.1. Personal Computers
- 7.1.4.3.2.2. Audio and Video Systems
- 7.1.4.3.2.3. Storage Devices
- 7.1.4.3.2.4. Home Appliances
- 7.1.4.3.2.5. Others
- 7.1.4.3.3. Aerospace and Defense
- 7.1.4.3.3.1. Military Radars
- 7.1.4.3.3.2. Aircraft systems
- 7.1.4.3.3.3. Others
- 7.1.4.3.4. Automotive
- 7.1.4.3.4.1. Infotainment Systems
- 7.1.4.3.4.2. Driver Assistance Systems
- 7.1.4.3.4.3. Others
- 7.1.4.3.5. Industrial
- 7.1.4.3.5.1. Power Electronics
- 7.1.4.3.5.2. Photovoltaic Systems
- 7.1.4.3.5.3. Others
- 7.1.4.3.6. Healthcare
- 7.1.4.3.6.1. Consumer Medical Devices
- 7.1.4.3.6.2. Medical Imaging Equipment
- 7.1.4.3.6.3. Others
- 7.1.5. Canada
- 7.1.6. Mexico
- 7.1.1. Market Size & Forecast
All segments will be provided for all regions and countries covered:
- 7.2 Europe
- 7.2.1 Germany
- 7.2.2 France
- 7.2.3 Italy
- 7.2.4 United Kingdom
- 7.2.5 Russia
- 7.2.6 Netherlands
- 7.2.7 Spain
- 7.2.8 Turkey
- 7.2.9 Poland
- 7.3 South America
- 7.3.1 Brazil
- 7.3.2 Argentina
- 7.4 Asia Pacific
- 7.4.1 India
- 7.4.2 China
- 7.4.3 Japan
- 7.4.4 Australia
- 7.4.5 Vietnam
- 7.4.6 South Korea
- 7.4.7 Indonesia
- 7.4.8 Philippines
- 7.5 Middle East & Africa
- 7.5.1 Saudi Arabia
- 7.5.2 UAE
- 7.5.3 South Africa
8. Market Mapping, 2023
- 8.1. By Component
- 8.2. By Application
- 8.3. By Region
9. Macro Environment and Industry Structure
- 9.1. Supply Demand Analysis
- 9.2. Import Export Analysis
- 9.3. Value Chain Analysis
- 9.4. PESTEL Analysis
- 9.4.1. Political Factors
- 9.4.2. Economic System
- 9.4.3. Social Implications
- 9.4.4. Technological Advancements
- 9.4.5. Environmental Impacts
- 9.4.6. Legal Compliances and Regulatory Policies (Statutory Bodies Included)
- 9.5. Porter's Five Forces Analysis
- 9.5.1. Supplier Power
- 9.5.2. Buyer Power
- 9.5.3. Substitution Threat
- 9.5.4. Threat from New Entrant
- 9.5.5. Competitive Rivalry
10. Market Dynamics
- 10.1. Growth Drivers
- 10.2. Growth Inhibitors (Challenges and Restraints)
11. Key Players Landscape
- 11.1. Competition Matrix of Top Five Market Leaders
- 11.2. Market Revenue Analysis of Top Five Market Leaders (in %, 2023)
- 11.3. Mergers and Acquisitions/Joint Ventures (If Applicable)
- 11.4. SWOT Analysis (For Five Market Players)
- 11.5. Patent Analysis (If Applicable)
12. Pricing Analysis
13. Case Studies
14. Key Players Outlook
- 14.1. Panasonic Corporation
- 14.1.1. Company Details
- 14.1.2. Key Management Personnel
- 14.1.3. Products & Services
- 14.1.4. Financials (As reported)
- 14.1.5. Key Market Focus & Geographical Presence
- 14.1.6. Recent Developments
- 14.2. AVX Corporation
- 14.3. TDK Corporation
- 14.4. Hosiden Corporation
- 14.5. Fenghua (HK) Electronics Ltd.
- 14.6. Fujitsu Component Limited
- 14.7. Molex Incorporated
- 14.8. Yageo Corporation
- 14.9. TE connectivity
- 14.10. Nichicon Corporation
Companies mentioned above DO NOT hold any order as per market share and can be changed as per information available during research work.
