|
|
市場調査レポート
商品コード
1397911
ヘッドアップディスプレイ(HUD)の世界市場の評価:タイプ別、エンドユーザー別、地域別、機会、予測(2016年~2030年)Head-Up Display Market Assessment, By Type [Windshield Based, Combiner Based, AR Based], By End-user [Automotive, Military and Defense, Aviation, Others], By Region, Opportunities and Forecast, 2016-2030F |
||||||
|
|
|||||||
カスタマイズ可能
|
|||||||


| ヘッドアップディスプレイ(HUD)の世界市場の評価:タイプ別、エンドユーザー別、地域別、機会、予測(2016年~2030年) |
|
出版日: 2023年12月21日
発行: Markets & Data
ページ情報: 英文 241 Pages
納期: 3~5営業日
|

- 全表示
- 概要
- 図表
- 目次
世界のヘッドアップディスプレイ(HUD)の市場規模は、2022年の16億1,000万米ドルから2030年に61億3,000万米ドルに達し、2023年~2030年の予測期間にCAGRで18.2%の成長が見込まれています。市場は、さまざまな要因が重なり、近年著しい成長と技術革新を示しています。市場の主な促進要因の1つは、交通安全の重視の高まりと脇見運転防止の必要性です。HUDは、速度、ナビゲーション指示、衝突警告などの重要なデータをドライバーの視界に直接表示するため、道路から注意をそらす必要が少なくなります。安全規制が厳しくなるにつれ、自動車産業におけるHUDの採用は拡大しています。
航空産業では、HUDはパイロットに高度、対気速度、航法情報などの重要なデータを提供し、従来の計器パネルへの依存を減らすために不可欠なものとなっています。これは、視界の悪い状況や離着陸時に特に重要です。さらに、軍事部門はHUD市場に大きく寄与しており、先進のHUD技術が戦闘機のパイロットや地上部隊の状況認識を強化しています。特に現代の戦争シナリオでは、防衛能力を強化する必要性がHUDの採用を後押ししています。
例えば、世界保健機関(WHO)によると、年間約135万人が交通事故で命を落としています。ヘッドアップディスプレイ(HUD)は運転支援システムとして機能し、イベント通知をタイムリーに提供することで、ドライバーや歩行者に潜在的な危険について迅速に警告します。
ヘッドアップディスプレイ(HUD)市場に影響を与えるARとVR技術の進歩
AR技術は現実世界にデジタル情報を重ね合わせ、ユーザーの現実の認識を高めます。HUDの文脈では、ARはユーザーの視界に直接重要なデータを表示することを可能にし、注意をそらすことなくリアルタイムの情報を提供します。この技術は特に自動車用途で価値があり、ドライバーは道路から目を離すことなく、ナビゲーションの案内、速度制限、安全警告をシームレスに受け取ることができます。それとは逆に、VR技術は没入感のあるコンピューターで生成された環境を作り出し、ユーザーに360度の体験を提供します。HUDに統合されると、VRは表示されるコンテンツの奥行きとインタラクティブ性を高めます。特に航空部門や軍事部門では、複雑なデータの視覚化がパイロットや兵士の意思決定を助けます。
さらに、ARとVRの進歩により、よりコンパクトで軽量なディスプレイデバイスが開発され、HUDはユーザーにとってより快適で実用的なものとなっています。このような技術の進歩はユーザー体験を向上させ、ゲーム、教育、医療などの多様な用途への扉を開きます。ARやVR技術が進化を続ける中、HUDとの統合により安全性、利便性、全体的なユーザー満足度がさらに向上し、世界中でHUD市場の成長を促進すると予測されています。
北米がヘッドアップディスプレイ(HUD)市場を独占
北米は世界最大級の自動車メーカーとハイテク企業を抱え、革新的な自動車技術の拠点となっています。ADAS(先進運転支援システム)や強化された車両安全機能への需要が高まるにつれ、HUDは重要な情報をドライバーの視界に直接表示する不可欠な部品となっています。自動車部門への統合が市場の拡大を後押ししています。さらに、北米は強力な航空産業を誇り、HUD技術が広く採用されています。航空産業におけるHUDは、パイロットに必要不可欠な飛行データを提供し、飛行中の状況認識と安全性を高めます。同地域の軍事部門はHUD技術に多額の投資を行い、軍用機や地上車両に組み込むことで、市場成長をさらに促しています。
さらに、北米における著名なHUDメーカーや大手ハイテク企業のプレゼンスが技術革新や研究開発活動を後押ししています。これらの企業は、自動車、航空、防衛などの多様な産業に対応する最先端のHUDソリューションを継続的に開発しています。この地域は研究と技術の進歩を重視しており、最先端のHUD製品が着実に流入しています。
当レポートでは、世界のヘッドアップディスプレイ(HUD)市場について調査分析し、市場規模と予測、市場力学、主要企業の情勢と見通しなどを提供しています。
目次
第1章 調査手法
第2章 プロジェクトの範囲と定義
第3章 世界のヘッドアップディスプレイ(HUD)市場に対するCOVID-19の影響
第4章 エグゼクティブサマリー
第5章 世界のヘッドアップディスプレイ(HUD)市場の見通し(2016年~2030年)
- 市場規模と予測
- 金額
- タイプ別
- フロントガラス型
- コンバイナー型
- AR型
- エンドユーザー別
- 自動車
- 軍事・防衛
- 航空
- その他
- 地域別
- 北米
- 欧州
- 南米
- アジア太平洋
- 中東・アフリカ
- 市場シェア:企業別(2022年)
第6章 世界のヘッドアップディスプレイ(HUD)市場の見通し:地域別(2016年~2030年)
- 北米
- 市場規模と予測
- タイプ別
- エンドユーザー別
- 米国
- カナダ
- メキシコ
- 欧州
- ドイツ
- フランス
- イタリア
- 英国
- ロシア
- オランダ
- スペイン
- トルコ
- ポーランド
- 南米
- ブラジル
- アルゼンチン
- アジア太平洋
- インド
- 中国
- 日本
- オーストラリア
- ベトナム
- 韓国
- インドネシア
- フィリピン
- 中東・アフリカ
- サウジアラビア
- アラブ首長国連邦
- 南アフリカ
第7章 市場マッピング(2022年)
- タイプ別
- エンドユーザー別
- 地域別
第8章 マクロ環境と産業構造
- PESTEL分析
- ポーターのファイブフォース分析
第9章 市場力学
- 成長促進要因
- 成長抑制要因(課題、抑制要因)
第10章 主要企業情勢
- マーケットリーダー上位5社の競合マトリクス
- マーケットリーダー上位5社の市場収益分析(2022年)
- 合併と買収/合弁事業(該当する場合)
- SWOT分析(市場参入企業5社)
- 特許分析(該当する場合)
第11章 価格分析
第12章 ケーススタディ(該当する場合)
第13章 主要企業の見通し
- Panasonic Corporation
- Denso Corporation
- Nippon Seiki Co. Ltd.
- Visteon Corporation
- Thales Group
- BAE Systems PLC
- Elbit Systems Ltd
- Continental AG
- Pioneer Corporation
- Saab AB
第14章 戦略的推奨事項
第15章 当社について、免責事項
List of Tables
- Table 1. Pricing Analysis of Products from Key Players
- Table 2. Competition Matrix of Top 5 Market Leaders
- Table 3. Mergers & Acquisitions/ Joint Ventures (If Applicable)
- Table 4. About Us - Regions and Countries Where We Have Executed Client Projects
List of Figures
- Figure 1. Global Head-Up Display Market, By Value, in USD Billion, 2016-2030F
- Figure 2. Global Head-Up Display Market Share (%), By Type, 2016-2030F
- Figure 3. Global Head-Up Display Market Share (%), By End-user, 2016-2030F
- Figure 4. Global Head-Up Display Market Share (%), By Region, 2016-2030F
- Figure 5. North America Head-Up Display Market, By Value, in USD Billion, 2016-2030F
- Figure 6. North America Head-Up Display Market Share (%), By Type, 2016-2030F
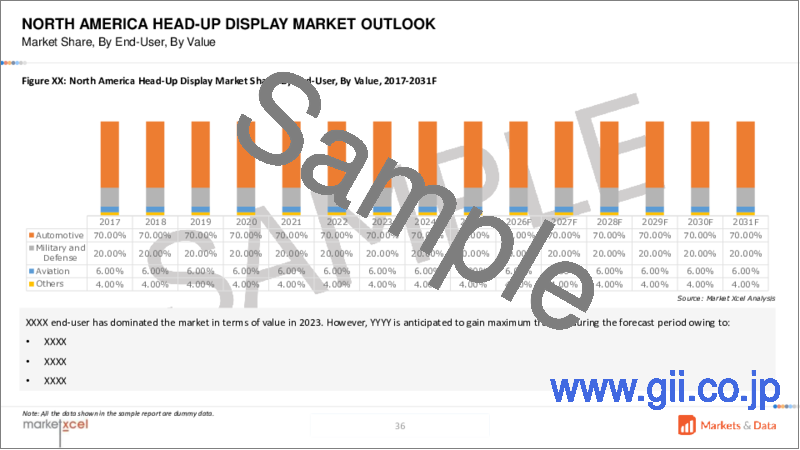
- Figure 7. North America Head-Up Display Market Share (%), By End-user, 2016-2030F
- Figure 8. North America Head-Up Display Market Share (%), By Country, 2016-2030F
- Figure 9. United States Head-Up Display Market, By Value, in USD Billion, 2016-2030F
- Figure 10. United States Head-Up Display Market Share (%), By Type, 2016-2030F
- Figure 11. United States Head-Up Display Market Share (%), By End-user, 2016-2030F
- Figure 12. Canada Head-Up Display Market, By Value, in USD Billion, 2016-2030F
- Figure 13. Canada Head-Up Display Market Share (%), By Type, 2016-2030F
- Figure 14. Canada Head-Up Display Market Share (%), By End-user, 2016-2030F
- Figure 15. Mexico Head-Up Display Market, By Value, in USD Billion, 2016-2030F
- Figure 16. Mexico Head-Up Display Market Share (%), By Type, 2016-2030F
- Figure 17. Mexico Head-Up Display Market Share (%), By End-user, 2016-2030F
- Figure 18. Europe Head-Up Display Market, By Value, in USD Billion, 2016-2030F
- Figure 19. Europe Head-Up Display Market Share (%), By Type, 2016-2030F
- Figure 20. Europe Head-Up Display Market Share (%), By End-user, 2016-2030F
- Figure 21. Europe Head-Up Display Market Share (%), By Country, 2016-2030F
- Figure 22. Germany Head-Up Display Market, By Value, in USD Billion, 2016-2030F
- Figure 23. Germany Head-Up Display Market Share (%), By Type, 2016-2030F
- Figure 24. Germany Head-Up Display Market Share (%), By End-user, 2016-2030F
- Figure 25. France Head-Up Display Market, By Value, in USD Billion, 2016-2030F
- Figure 26. France Head-Up Display Market Share (%), By Type, 2016-2030F
- Figure 27. France Head-Up Display Market Share (%), By End-user, 2016-2030F
- Figure 28. Italy Head-Up Display Market, By Value, in USD Billion, 2016-2030F
- Figure 29. Italy Head-Up Display Market Share (%), By Type, 2016-2030F
- Figure 30. Italy Head-Up Display Market Share (%), By End-user, 2016-2030F
- Figure 31. United Kingdom Head-Up Display Market, By Value, in USD Billion, 2016-2030F
- Figure 32. United Kingdom Head-Up Display Market Share (%), By Type, 2016-2030F
- Figure 33. United Kingdom Head-Up Display Market Share (%), By End-user, 2016-2030F
- Figure 34. Russia Head-Up Display Market, By Value, in USD Billion, 2016-2030F
- Figure 35. Russia Head-Up Display Market Share (%), By Type, 2016-2030F
- Figure 36. Russia Head-Up Display Market Share (%), By End-user, 2016-2030F
- Figure 37. Netherlands Head-Up Display Market, By Value, in USD Billion, 2016-2030F
- Figure 38. Netherlands Head-Up Display Market Share (%), By Type, 2016-2030F
- Figure 39. Netherlands Head-Up Display Market Share (%), By End-user, 2016-2030F
- Figure 40. Spain Head-Up Display Market, By Value, in USD Billion, 2016-2030F
- Figure 41. Spain Head-Up Display Market Share (%), By Type, 2016-2030F
- Figure 42. Spain Head-Up Display Market Share (%), By End-user, 2016-2030F
- Figure 43. Turkey Head-Up Display Market, By Value, in USD Billion, 2016-2030F
- Figure 44. Turkey Head-Up Display Market Share (%), By Type, 2016-2030F
- Figure 45. Turkey Head-Up Display Market Share (%), By End-user, 2016-2030F
- Figure 46. Poland Head-Up Display Market, By Value, in USD Billion, 2016-2030F
- Figure 47. Poland Head-Up Display Market Share (%), By Type, 2016-2030F
- Figure 48. Poland Head-Up Display Market Share (%), By End-user, 2016-2030F
- Figure 49. South America Head-Up Display Market, By Value, in USD Billion, 2016-2030F
- Figure 50. South America Head-Up Display Market Share (%), By Type, 2016-2030F
- Figure 51. South America Head-Up Display Market Share (%), By End-user, 2016-2030F
- Figure 52. South America Head-Up Display Market Share (%), By Country, 2016-2030F
- Figure 53. Brazil Head-Up Display Market, By Value, in USD Billion, 2016-2030F
- Figure 54. Brazil Head-Up Display Market Share (%), By Type, 2016-2030F
- Figure 55. Brazil Head-Up Display Market Share (%), By End-user, 2016-2030F
- Figure 56. Argentina Head-Up Display Market, By Value, in USD Billion, 2016-2030F
- Figure 57. Argentina Head-Up Display Market Share (%), By Type, 2016-2030F
- Figure 58. Argentina Head-Up Display Market Share (%), By End-user, 2016-2030F
- Figure 59. Asia-Pacific Head-Up Display Market, By Value, in USD Billion, 2016-2030F
- Figure 60. Asia-Pacific Head-Up Display Market Share (%), By Type, 2016-2030F
- Figure 61. Asia-Pacific Head-Up Display Market Share (%), By End-user, 2016-2030F
- Figure 62. Asia-Pacific Head-Up Display Market Share (%), By Country, 2016-2030F
- Figure 63. India Head-Up Display Market, By Value, in USD Billion, 2016-2030F
- Figure 64. India Head-Up Display Market Share (%), By Type, 2016-2030F
- Figure 65. India Head-Up Display Market Share (%), By End-user, 2016-2030F
- Figure 66. China Head-Up Display Market, By Value, in USD Billion, 2016-2030F
- Figure 67. China Head-Up Display Market Share (%), By Type, 2016-2030F
- Figure 68. China Head-Up Display Market Share (%), By End-user, 2016-2030F
- Figure 69. Japan Head-Up Display Market, By Value, in USD Billion, 2016-2030F
- Figure 70. Japan Head-Up Display Market Share (%), By Type, 2016-2030F
- Figure 71. Japan Head-Up Display Market Share (%), By End-user, 2016-2030F
- Figure 72. Australia Head-Up Display Market, By Value, in USD Billion, 2016-2030F
- Figure 73. Australia Head-Up Display Market Share (%), By Type, 2016-2030F
- Figure 74. Australia Head-Up Display Market Share (%), By End-user, 2016-2030F
- Figure 75. Vietnam Head-Up Display Market, By Value, in USD Billion, 2016-2030F
- Figure 76. Vietnam Head-Up Display Market Share (%), By Type, 2016-2030F
- Figure 77. Vietnam Head-Up Display Market Share (%), By End-user, 2016-2030F
- Figure 78. South Korea Head-Up Display Market, By Value, in USD Billion, 2016-2030F
- Figure 79. South Korea Head-Up Display Market Share (%), By Type, 2016-2030F
- Figure 80. South Korea Head-Up Display Market Share (%), By End-user, 2016-2030F
- Figure 81. Indonesia Head-Up Display Market, By Value, in USD Billion, 2016-2030F
- Figure 82. Indonesia Head-Up Display Market Share (%), By Type, 2016-2030F
- Figure 83. Indonesia Head-Up Display Market Share (%), By End-user, 2016-2030F
- Figure 84. Philippines Head-Up Display Market, By Value, in USD Billion, 2016-2030F
- Figure 85. Philippines Head-Up Display Market Share (%), By Type, 2016-2030F
- Figure 86. Philippines Head-Up Display Market Share (%), By End-user, 2016-2030F
- Figure 87. Middle East & Africa Head-Up Display Market, By Value, in USD Billion, 2016-2030F
- Figure 88. Middle East & Africa Head-Up Display Market Share (%), By Type, 2016-2030F
- Figure 89. Middle East & Africa Head-Up Display Market Share (%), By End-user, 2016-2030F
- Figure 90. Middle East & Africa Head-Up Display Market Share (%), By Country, 2016-2030F
- Figure 91. Saudi Arabia Head-Up Display Market, By Value, in USD Billion, 2016-2030F
- Figure 92. Saudi Arabia Head-Up Display Market Share (%), By Type, 2016-2030F
- Figure 93. Saudi Arabia Head-Up Display Market Share (%), By End-user, 2016-2030F
- Figure 94. UAE Head-Up Display Market, By Value, in USD Billion, 2016-2030F
- Figure 95. UAE Head-Up Display Market Share (%), By Type, 2016-2030F
- Figure 96. UAE Head-Up Display Market Share (%), By End-user, 2016-2030F
- Figure 97. South Africa Head-Up Display Market, By Value, in USD Billion, 2016-2030F
- Figure 98. South Africa Head-Up Display Market Share (%), By Type, 2016-2030F
- Figure 99. South Africa Head-Up Display Market Share (%), By End-user, 2016-2030F
- Figure 100. By Type Map-Market Size (USD Billion) & Growth Rate (%), 2022
- Figure 101. By End-user Map-Market Size (USD Billion) & Growth Rate (%), 2022
- Figure 102. By Region Map-Market Size (USD Billion) & Growth Rate (%), 2022
Global head-up display market size was valued at USD 1.61 billion in 2022, expected to reach USD 6.13 billion in 2030, with a CAGR of 18.2% for the forecast period between 2023 and 2030. Head-up display (HUD) market has witnessed significant growth and innovation in recent years, driven by a confluence of factors. Head-up displays are transparent screens that project critical information onto the driver's or pilot's field of vision, enhancing safety and convenience in various applications, including automotive, aviation, and military sectors. One of the primary drivers of the HUD market is the increasing emphasis on road safety and the need for distracted driving prevention. HUDs provide essential data such as speed, navigation instructions, and collision warnings directly in the driver's line of sight, reducing the need to divert attention from the road. As safety regulations become more stringent, the adoption of HUDs in the automotive industry is growing.
In aviation, HUDs have become indispensable, offering pilots critical data like altitude, airspeed, and navigation information, reducing the reliance on conventional instrument panels. This is particularly crucial for low-visibility conditions and during takeoff and landing. Furthermore, the military sector significantly contributes to the HUD market, where advanced HUD technology enhances situational awareness for fighter jet pilots and ground troops. The need for enhanced defense capabilities, especially in modern warfare scenarios, drives the adoption of HUDs.
For instance, as per the World Health Organization (WHO), about 1.35 million individuals succumb to road traffic accidents annually. The head-up display (HUD) serves as a driver assistance system, promptly alerting drivers and pedestrians about potential risks by providing timely event notifications.
Integration of Automotive Safety with Advanced Driver Assistance Systems (ADAS)
HUDs integrated with ADAS provide real-time information on the windshield, ensuring that drivers can access critical data without taking their eyes off the road. This integration enhances overall driving safety by displaying important information such as speed limits, navigation instructions, lane departure warnings, and collision alerts directly in the driver's line of sight. By merging HUDs with ADAS, automakers create a seamless user experience. Drivers receive alerts and notifications about potential hazards or changes in road conditions without shifting their focus away from driving. This integration enhances convenience and reduces distractions, contributing to a safer driving environment.
HUDs integrated with ADAS can display visual and auditory warnings about imminent collisions, allowing drivers to react promptly. These collision avoidance alerts are crucial in preventing accidents, especially when quick responses are essential. The integration ensures that drivers receive timely warnings, reducing the risk of collisions.
For instance, in January 2023, during CES 2023, BMW revealed the interior design of their Neue Klasse architecture cars, surprising many with the absence of large screens. BMW's Chairman expressed his belief that large screens pose a safety risk while driving and anticipates their disappearance from cars. Instead, the showcased interior featured an innovative head-up display (HUD) that stretched across the entire dashboard. This new technology will debut in BMW's upcoming cars as early as 2025.
Advancements in AR and VR Technologies Influencing Head-Up Display Market
AR technology overlays digital information onto the real world, enhancing the user's perception of reality. In the context of HUDs, AR enables the display of crucial data directly in the user's field of vision, providing real-time information without diverting attention. This technology is particularly valuable in automotive applications, where drivers receive navigation prompts, speed limits, and safety alerts seamlessly without taking their eyes off the road. On the contrary, VR technology creates immersive, computer-generated environments, offering users a 360-degree experience. When integrated into HUDs, VR enhances the depth and interactivity of displayed content. It is especially relevant in aviation and military sectors, where complex data visualization aids pilots and soldiers in decision-making.
Furthermore, AR and VR advancements have led to the development of more compact and lightweight display devices, making HUDs more comfortable and practical for users. These technological strides enhance user experience and open doors to diverse applications, including gaming, education, and healthcare. As AR and VR technologies continue to evolve, their integration with HUDs is expected to further enhance safety, convenience, and overall user satisfaction, driving the growth of the HUD market globally.
For instance, in January 2023, HARMAN introduced HARMAN Ready Vision, a comprehensive suite comprising Augmented Reality (AR) head-up display (HUD) hardware and AR software products. The innovative technology aims to elevate driver safety and awareness. Ready Vision's AR software seamlessly integrates with vehicle sensors, providing immersive audio and visual alerts that furnish drivers with crucial knowledge and information in a timely, precise, and unobtrusive manner. HARMAN Ready Vision acts as a bridge between the physical and digital realms, projecting intuitive turn-by-turn directions directly onto the windshield, enhancing the driver's understanding of the route. Utilizing advanced computer vision and machine learning techniques, Ready Vision enables 3D object detection, delivering unobtrusive warnings such as collision alerts, blind spot notifications, lane departure, lane change assistance, and low-speed zone alerts to the driver with remarkable accuracy, the sophisticated system enhances driver cognition and situational awareness, contributing significantly to road safety.
North America Dominates the Head-Up Display Market
North America hosts some of the world's largest automobile manufacturers and tech companies, making it a hub for innovative automotive technologies. As the demand for advanced driver assistance systems (ADAS) and enhanced vehicle safety features grows, HUDs have become integral components, displaying critical information directly in the driver's line of sight. The integration in the automotive sector propels the market's expansion. Additionally, North America boasts a strong aviation industry, where HUD technology has been widely adopted. HUDs in aviation provide pilots with essential flight data, enhancing situational awareness and safety during flights. The region's military sector heavily invests in HUD technology, integrating it into military aircraft and ground vehicles, further stimulating market growth.
Moreover, the presence of prominent HUD manufacturers and tech giants in North America drives innovation and research and development activities. These companies continuously develop cutting-edge HUD solutions, catering to diverse industries such as automotive, aviation, and defense. The region's focus on research and technological advancements ensures a steady influx of state-of-the-art HUD products.
High Cost of HUDs Pose a Significant Obstacle in Expansion
HUDs are still in the developmental phase and haven't achieved widespread usage. Currently, HUD end-users are primarily found in luxury cars and airplanes. However, the high production costs have limited the number of manufacturers entering the HUD market. Consequently, HUDs come with a high average selling price (ASP) in the automotive sector, a significant factor as this cost is transferred to customers. Despite a notable decrease in HUD ASP over the years, AR-based and advanced HUDs remain on the higher end of the price spectrum.
Furthermore, automotive OEMs operate on slight profit margins and continuously strive to cut costs. The initially prohibitive cost of HUDs confined their use to premium and luxury cars, and currently, they are limited to mid-size vehicles. Manufacturers are working towards cost reduction through large-scale production. However, the United States plans to introduce regulations mandating HUDs in new cars, which most countries globally lack in automobiles. Consequently, the high HUD costs present a significant barrier, especially for passenger and mid-sized cars, hindering market growth during the forecast period.
Impact of COVID-19
The COVID-19 pandemic had a mixed impact on the Head-Up Display (HUD) market, bringing challenges and opportunities. The global HUD market initially faced disruptions due to supply chain interruptions, factory closures, and reduced consumer spending. Lockdowns and travel restrictions affected manufacturing and distribution, causing delays in production timelines. Automotive and aviation industries, which are the key sectors for HUD adoption, experienced a sharp decline in demand as people refrained from travel and made fewer vehicle purchases.
However, the pandemic accelerated certain trends that benefited the HUD market. The increased emphasis on safety and hygiene encouraged automakers to invest in advanced technologies, including HUDs, to enhance the driving experience. As remote work became more prevalent, there was a rise in demand for premium vehicles equipped with advanced features, including HUDs, as consumers sought more comfortable and technologically advanced options for their limited travel needs.
Key Players Landscape and Outlook
The head-up display market is expanding due to the increasing emphasis placed by companies worldwide on establishing advanced display infrastructure. Furthermore, the market expansion is greatly facilitated by automotive industry, along with significant investments made by companies to enhance research and development resources, engage in collaboration projects, bolster marketing efforts, and expand distribution networks. These factors collectively contribute to the rapid expansion of the market.
In January 2022, Panasonic Corporation of North America introduced Augmented Reality HUD (AR HUD) 2.0, featuring a groundbreaking eye tracking system (ETS) to enhance the AR experience. The unique technology integrates an infrared (IR) camera directly into the AR HUD projector and optics, eliminating the need for a separate camera focused on the driver. The ETS precisely identifies the driver's gaze direction and adjusts the AR visuals accordingly, ensuring sharp and accurate imagery. The innovation leads to a more intuitive and enjoyable user experience, making driving with AR HUD 2.0 a seamless and engaging interaction.
Table of Contents
1. Research Methodology
2. Project Scope & Definitions
3. Impact of COVID-19 on Global Head-Up Display Market
4. Executive Summary
5. Global Head-Up Display Market Outlook, 2016-2030F
- 5.1. Market Size & Forecast
- 5.1.1. By Value
- 5.2. By Type
- 5.2.1. Windshield Based
- 5.2.2. Combiner Based
- 5.2.3. AR Based
- 5.3. By End-user
- 5.3.1. Automotive
- 5.3.2. Military and Defense
- 5.3.3. Aviation
- 5.3.4. Others
- 5.4. By Region
- 5.4.1. North America
- 5.4.2. Europe
- 5.4.3. South America
- 5.4.4. Asia-Pacific
- 5.4.5. Middle East and Africa
- 5.5. By Company Market Share (%), 2022
6. Global Head-Up Display Market Outlook, By Region, 2016-2030F
- 6.1. North America*
- 6.1.1. Market Size & Forecast
- 6.1.1.1. By Value
- 6.1.2. By Type
- 6.1.2.1. Windshield Based
- 6.1.2.2. Combiner Based
- 6.1.2.3. AR Based
- 6.1.3. By End-user
- 6.1.3.1. Automotive
- 6.1.3.2. Military and Defense
- 6.1.3.3. Aviation
- 6.1.3.4. Others
- 6.1.4. United States*
- 6.1.4.1. Market Size & Forecast
- 6.1.4.1.1. By Value
- 6.1.4.2. By Type
- 6.1.4.2.1. Windshield Based
- 6.1.4.2.2. Combiner Based
- 6.1.4.2.3. AR Based
- 6.1.4.3. By End-user
- 6.1.4.3.1. Automotive
- 6.1.4.3.2. Military and Defense
- 6.1.4.3.3. Aviation
- 6.1.4.3.4. Others
- 6.1.5. Canada
- 6.1.6. Mexico
- 6.1.1. Market Size & Forecast
All segments will be provided for all regions and countries covered:
- 6.2. Europe
- 6.2.1. Germany
- 6.2.2. France
- 6.2.3. Italy
- 6.2.4. United Kingdom
- 6.2.5. Russia
- 6.2.6. Netherlands
- 6.2.7. Spain
- 6.2.8. Turkey
- 6.2.9. Poland
- 6.3. South America
- 6.3.1. Brazil
- 6.3.2. Argentina
- 6.4. Asia-Pacific
- 6.4.1. India
- 6.4.2. China
- 6.4.3. Japan
- 6.4.4. Australia
- 6.4.5. Vietnam
- 6.4.6. South Korea
- 6.4.7. Indonesia
- 6.4.8. Philippines
- 6.5. Middle East & Africa
- 6.5.1. Saudi Arabia
- 6.5.2. UAE
- 6.5.3. South Africa
7. Market Mapping, 2022
- 7.1. By Type
- 7.2. By End-user
- 7.3. By Region
8. Macro Environment and Industry Structure
- 8.1. PESTEL Analysis
- 8.2. Porter's Five Forces Analysis
9. Market Dynamics
- 9.1. Growth Drivers
- 9.2. Growth Inhibitors (Challenges, Restraints)
10. Key Players Landscape
- 10.1. Competition Matrix of Top Five Market Leaders
- 10.2. Market Revenue Analysis of Top Five Market Leaders (in %, 2022)
- 10.3. Mergers and Acquisitions/Joint Ventures (If Applicable)
- 10.4. SWOT Analysis (For Five Market Players)
- 10.5. Patent Analysis (If Applicable)
11. Pricing Analysis
12. Case Studies (If applicable)
13. Key Players Outlook
- 13.1. Panasonic Corporation
- 13.1.1. Company Details
- 13.1.2. Key Management Personnel
- 13.1.3. Products & Services
- 13.1.4. Financials (As reported)
- 13.1.5. Key Market Focus & Geographical Presence
- 13.1.6. Recent Developments
- 13.2. Denso Corporation
- 13.3. Nippon Seiki Co. Ltd.
- 13.4. Visteon Corporation
- 13.5. Thales Group
- 13.6. BAE Systems PLC
- 13.7. Elbit Systems Ltd
- 13.8. Continental AG
- 13.9. Pioneer Corporation
- 13.10. Saab AB
Companies mentioned above DO NOT hold any order as per market share and can be changed as per information available during research work.
14. Strategic Recommendations
15. About Us & Disclaimer
