|
|
市場調査レポート
商品コード
1394576
ラップトップの世界市場の評価:タイプ別、画面サイズ別、オペレーティングシステム別、流通チャネル別、地域別、機会、予測(2016年~2030年)Laptops Market Assessment, By Type, By Screen Size, By Operating System, By Distribution Channel, By Region, Opportunities and Forecast, 2016-2030F |
||||||
|
|
|||||||
カスタマイズ可能
|
|||||||


| ラップトップの世界市場の評価:タイプ別、画面サイズ別、オペレーティングシステム別、流通チャネル別、地域別、機会、予測(2016年~2030年) |
|
出版日: 2023年12月13日
発行: Markets & Data
ページ情報: 英文 212 Pages
納期: 3~5営業日
|

全表示
- 概要
- 図表
- 目次
世界のラップトップ市場は技術革新をリードしており、コネクテッドな世界の進化するニーズにダイナミックに対応しています。ポータブルコンピューティングの頂点として機能するラップトップは、仕事、教育、レジャーの領域で不可欠なツールとなっています。世界のラップトップの市場規模は、2022年の1,795億米ドルから2030年までに3,107億米ドルに達し、2022年~2030年の予測期間にCAGRで7.1%の成長が見込まれています。市場は、リモートワークや遠隔学習の増加、技術の進歩、汎用性の高いコンピューティングソリューションに対する需要の高まりといった要因に後押しされ、力強い成長と変革的なシフトの融合を見せています。
技術の進歩とラップトップの採用の拡大が、ラップトップ市場の成長を世界中で促進する重要な役割を担っています。消費者行動の変化や、在宅ワーク文化の広がり、利便性と携帯性が、市場の主な促進要因です。世界のラップトップ市場には、HP、Apple、Dell、Lenovoなどの有名企業が含まれており、最先端の機能、向上した性能、洗練されたデザインを提供する競争を繰り広げています。世界のラップトップ市場に課題がないわけではありません。世界の半導体不足は電子機器製造のサプライチェーンに波及し、ラップトップの生産と入手に影響を与えています。
リモートワークと遠隔教育
リモートワークと遠隔教育は、世界のラップトップ市場に大きな影響を与えています。リモートワークとオンライン教育は、世界のラップトップ市場の動向を形成し、需要に影響を与え、技術革新を推進しています。特にCOVID-19以降、リモートワークやオンライン教育への移行が進み、ラップトップのニーズが顕著に増加しています。自宅で仕事をしたり、授業に出席したりする人々は自分用のコンピューターを求めており、ラップトップはその携帯性と適応性から支持されています。ラップトップは、リモートワークやハイブリッドモデルにより、世界中のオフィスのワークスペースにおいて、徐々にデスクトップに取って代わりつつあります。米国市場の分析によると、労働人口の約42%が在宅勤務またはハイブリッド環境で仕事をしていると推定されています。このようにラップトップへの依存が高まることで、メーカーの売上も伸びています。企業や教育機関は、遠隔でのコラボレーションや遠隔学習を促進するため、従業員や学生へのラップトップの提供に投資しています。
話題を呼ぶ2画面ラップトップ
デュアルスクリーンラップトップやデュアルディスプレイラップトップと呼ばれるこれらの革新的なデザインのシステムは、ワークスペースを広げ、マルチタスクの機会を増やすことができます。これらの2画面ラップトップは、マルチタスク、コンテンツ作成、または特定のアプリケーションの使用により多くの画面スペースをユーザーに提供することで、生産性を向上させるように設計されています。ユーザーは、主にタッチ、スタイラス入力、内蔵キーボードなどのインタラクティブな機能が利用できるセカンダリスクリーンを使用して、新しい方法でデバイスに関与することができます。
2023年、LenovoはYoga Book 9iを発売しました。これはラップトップ産業に特別なものをもたらしました。Yoga Book 9iは、代わりに第2のタッチスクリーンを使用しています。パッケージには、スタイラス、取り外し可能な追加キーボード、ケースが含まれています。2つの巨大なOLEDスクリーンのシームレスな融合は、生産性に新たな視点をもたらす魅力的なデュアルスクリーンを作り出します。
ゲーミング・ラップトップの需要増加
世界のラップトップ市場における近年の発展は、ゲーミングラップトップの売り上げ、需要、熱狂の高まりです。YouTubeの台頭と普及のおかげで、Z世代とミレニアル世代はゲーミングラップトップに多額の投資をしています。ゲーム産業は、電子機器の領域で世界でもっとも急速に成長している産業の1つであり、ゲーム産業の絶え間ない伸びに伴い、ハイエンドのゲーミングラップトップの需要が増加します。HP、ASUS、MSI(Micro-Star International)などは、こうした特定のユーザーに対応するブランドです。ゲーム産業の成長は、高性能ゲーミングラップトップの需要に拍車をかけています。ゲーム愛好家は、没入感のあるゲーム体験のために、先進のグラフィックス機能、高いリフレッシュレート、ハイエンド性能、効率的な冷却システムを備えたデバイスを求めています。
カリフォルニアに本社を置くHPのレポートによると、同社は2023年第1四半期に4万7,298台のゲーミングラップトップを販売し、全体の37.53%を占めました(2022年第1四半期は4万6,139台)。昨年のゲーミングPCの販売台数は55万2,000台で、2021年の37万1,000台から増加しました。
当レポートでは、世界のラップトップ市場について調査の分析し、市場規模と予測、市場力学、主要企業の情勢と見通しなどを提供しています。
目次
第1章 調査手法
第2章 プロジェクトの範囲と定義
第3章 世界のラップトップ市場に対するCOVID-19の影響
第4章 エグゼクティブサマリー
第5章 顧客の声
- 人口統計(年齢/コーホート分析 - 団塊の世代とX世代、ミレニアル世代、Z世代、性別、所得 - 低、中、高、地域、国籍など)
- 市場の認知度と製品情報
- ブランドの認知度とロイヤルティ
- 購入決定において考慮される要素
- 購入の目的
- 購入頻度
- 購入媒体
- 製品/ブランドの吸収におけるブランドアンバサダーまたはインフルエンサーマーケティングの役割
第6章 世界のラップトップ市場の見通し(2016年~2030年)
- 市場規模と予測
- 金額
- 数量
- タイプ別
- 従来型
- コンバーチブル2-in-1ラップトップ
- 画面サイズ別
- 10.9インチ以下
- 11インチ~14.9インチ
- 15インチ~16.9インチ
- 17インチ以上
- オペレーティングシステム別
- Windows
- MacOS
- Linux
- その他(Chrome、Dos)
- 流通チャネル別
- オンライン
- オフライン
- 地域別
- 北米
- 南米
- 欧州
- アジア太平洋
- 中東・アフリカ
- 市場シェア:企業別(2022年)
第7章 世界のラップトップ市場の見通し:地域別(2016年~2030年)
- 北米
- 市場規模と予測
- タイプ別
- 画面サイズ別
- オペレーティングシステム別
- 流通チャネル別
- 米国
- カナダ
- メキシコ
- 欧州
- ドイツ
- フランス
- イタリア
- 英国
- ロシア
- オランダ
- スペイン
- トルコ
- ポーランド
- 南米
- ブラジル
- アルゼンチン
- アジア太平洋
- インド
- 中国
- 日本
- オーストラリア
- ベトナム
- 韓国
- インドネシア
- フィリピン
- 中東・アフリカ
- サウジアラビア
- アラブ首長国連邦
- 南アフリカ
第8章 市場マッピング(2022年)
- タイプ別
- 画面サイズ別
- オペレーティングシステム別
- 流通チャネル別
- 地域別
第9章 マクロ環境と産業構造
- 需給分析
- 輸出入の分析
- バリューチェーン分析
- PESTEL分析
- ポーターのファイブフォース分析
第10章 市場力学
- 成長促進要因
- 成長抑制要因(課題、抑制要因)
第11章 主要企業情勢
- マーケットリーダー上位5社の競合マトリクス
- マーケットリーダー上位5社の市場収益分析(2022年)
- 合併と買収/合弁事業(該当する場合)
- SWOT分析(市場参入企業5社)
- 特許分析(該当する場合)
第12章 価格分析
第13章 ケーススタディ
第14章 主要企業の見通し
- HP Inc.
- Apple Inc.
- Acer Inc.
- Dell Technologies, Inc
- Lenovo Group Ltd.
- ASUSTeK COMPUTER INC.
- Haier Inc.
- Samsung Electronics Co., Ltd.
- Micro-Star Int'l Co., Ltd.
- TOSHIBA CORPORATION
第15章 戦略的推奨事項
第16章 当社について、免責事項
List of Tables
- Table 1. Pricing Analysis of Products from Key Players
- Table 2. Competition Matrix of Top 5 Market Leaders
- Table 3. Mergers & Acquisitions/ Joint Ventures (If Applicable)
- Table 4. About Us - Regions and Countries Where We Have Executed Client Projects
List of Figures
- Figure 1. Global Laptops Market, By Value, In USD Billion, 2016-2030F
- Figure 2. Global Laptops Market, By Volume, In Million Units, 2016-2030F
- Figure 3. Global Laptops Market Share, By Type, In USD Billion, 2016-2030F
- Figure 4. Global Laptops Market Share, By Screen Size, In USD Billion, 2016-2030F
- Figure 5. Global Laptops Market Share, By Operating System, In USD Billion, 2016-2030F
- Figure 6. Global Laptops Market Share, By Distribution Channel, In USD Billion, 2016-2030F
- Figure 7. Global Laptops Market Share, By Region, In USD Billion, 2016-2030F
- Figure 8. North America Laptops Market, By Value, In USD Billion, 2016-2030F
- Figure 9. North America Laptops Market, By Volume, In Million Units, 2016-2030F
- Figure 10. North America Laptops Market Share, By Type, In USD Billion, 2016-2030F
- Figure 11. North America Laptops Market Share, By Screen Size, In USD Billion, 2016-2030F
- Figure 12. North America Laptops Market Share, By Operating System, In USD Billion, 2016-2030F
- Figure 13. North America Laptops Market Share, By Distribution Channel, In USD Billion, 2016-2030F
- Figure 14. North America Laptops Market Share, By Country, In USD Billion, 2016-2030F
- Figure 15. United States Laptops Market, By Value, In USD Billion, 2016-2030F
- Figure 16. United States Laptops Market, By Volume, In Million Units, 2016-2030F
- Figure 17. United States Laptops Market Share, By Type, In USD Billion, 2016-2030F
- Figure 18. United States Laptops Market Share, By Screen Size, In USD Billion, 2016-2030F
- Figure 19. United States Laptops Market Share, By Operating System, In USD Billion, 2016-2030F
- Figure 20. United States Laptops Market Share, By Distribution Channel, In USD Billion, 2016-2030F
- Figure 21. Canada Laptops Market, By Value, In USD Billion, 2016-2030F
- Figure 22. Canada Laptops Market, By Volume, In Million Units, 2016-2030F
- Figure 23. Canada Laptops Market Share, By Type, In USD Billion, 2016-2030F
- Figure 24. Canada Laptops Market Share, By Screen Size, In USD Billion, 2016-2030F
- Figure 25. Canada Laptops Market Share, By Operating System, In USD Billion, 2016-2030F
- Figure 26. Canada Laptops Market Share, By Distribution Channel, In USD Billion, 2016-2030F
- Figure 27. Mexico Laptops Market, By Value, In USD Billion, 2016-2030F
- Figure 28. Mexico Laptops Market, By Volume, In Million Units, 2016-2030F
- Figure 29. Mexico Laptops Market Share, By Type, In USD Billion, 2016-2030F
- Figure 30. Mexico Laptops Market Share, By Screen Size, In USD Billion, 2016-2030F
- Figure 31. Mexico Laptops Market Share, By Operating System, In USD Billion, 2016-2030F
- Figure 32. Mexico Laptops Market Share, By Distribution Channel, In USD Billion, 2016-2030F
- Figure 33. Europe Laptops Market, By Value, In USD Billion, 2016-2030F
- Figure 34. Europe Laptops Market, By Volume, In Million Units, 2016-2030F
- Figure 35. Europe Laptops Market Share, By Type, In USD Billion, 2016-2030F
- Figure 36. Europe Laptops Market Share, By Screen Size, In USD Billion, 2016-2030F
- Figure 37. Europe Laptops Market Share, By Operating System, In USD Billion, 2016-2030F
- Figure 38. Europe Laptops Market Share, By Distribution Channel, In USD Billion, 2016-2030F
- Figure 39. Europe Laptops Market Share, By Country, In USD Billion, 2016-2030F
- Figure 40. Germany Laptops Market, By Value, In USD Billion, 2016-2030F
- Figure 41. Germany Laptops Market, By Volume, In Million Units, 2016-2030F
- Figure 42. Germany Laptops Market Share, By Type, In USD Billion, 2016-2030F
- Figure 43. Germany Laptops Market Share, By Screen Size, In USD Billion, 2016-2030F
- Figure 44. Germany Laptops Market Share, By Operating System, In USD Billion, 2016-2030F
- Figure 45. Germany Laptops Market Share, By Distribution Channel, In USD Billion, 2016-2030F
- Figure 46. France Laptops Market, By Value, In USD Billion, 2016-2030F
- Figure 47. France Laptops Market, By Volume, In Million Units, 2016-2030F
- Figure 48. France Laptops Market Share, By Type, In USD Billion, 2016-2030F
- Figure 49. France Laptops Market Share, By Screen Size, In USD Billion, 2016-2030F
- Figure 50. France Laptops Market Share, By Operating System, In USD Billion, 2016-2030F
- Figure 51. France Laptops Market Share, By Distribution Channel, In USD Billion, 2016-2030F
- Figure 52. Italy Laptops Market, By Value, In USD Billion, 2016-2030F
- Figure 53. Italy Laptops Market, By Volume, In Million Units, 2016-2030F
- Figure 54. Italy Laptops Market Share, By Type, In USD Billion, 2016-2030F
- Figure 55. Italy Laptops Market Share, By Screen Size, In USD Billion, 2016-2030F
- Figure 56. Italy Laptops Market Share, By Operating System, In USD Billion, 2016-2030F
- Figure 57. Italy Laptops Market Share, By Distribution Channel, In USD Billion, 2016-2030F
- Figure 58. United Kingdom Laptops Market, By Value, In USD Billion, 2016-2030F
- Figure 59. United Kingdom Laptops Market, By Volume, In Million Units, 2016-2030F
- Figure 60. United Kingdom Laptops Market Share, By Type, In USD Billion, 2016-2030F
- Figure 61. United Kingdom Laptops Market Share, By Screen Size, In USD Billion, 2016-2030F
- Figure 62. United Kingdom Laptops Market Share, By Operating System, In USD Billion, 2016-2030F
- Figure 63. United Kingdom Laptops Market Share, By Distribution Channel, In USD Billion, 2016-2030F
- Figure 64. Russia Laptops Market, By Value, In USD Billion, 2016-2030F
- Figure 65. Russia Laptops Market, By Volume, In Million Units, 2016-2030F
- Figure 66. Russia Laptops Market Share, By Type, In USD Billion, 2016-2030F
- Figure 67. Russia Laptops Market Share, By Screen Size, In USD Billion, 2016-2030F
- Figure 68. Russia Laptops Market Share, By Operating System, In USD Billion, 2016-2030F
- Figure 69. Russia Laptops Market Share, By Distribution Channel, In USD Billion, 2016-2030F
- Figure 70. Netherlands Laptops Market, By Value, In USD Billion, 2016-2030F
- Figure 71. Netherlands Laptops Market, By Volume, In Million Units, 2016-2030F
- Figure 72. Netherlands Laptops Market Share, By Type, In USD Billion, 2016-2030F
- Figure 73. Netherlands Laptops Market Share, By Screen Size, In USD Billion, 2016-2030F
- Figure 74. Netherlands Laptops Market Share, By Operating System, In USD Billion, 2016-2030F
- Figure 75. Netherlands Laptops Market Share, By Distribution Channel, In USD Billion, 2016-2030F
- Figure 76. Spain Laptops Market, By Value, In USD Billion, 2016-2030F
- Figure 77. Spain Laptops Market, By Volume, In Million Units, 2016-2030F
- Figure 78. Spain Laptops Market Share, By Type, In USD Billion, 2016-2030F
- Figure 79. Spain Laptops Market Share, By Screen Size, In USD Billion, 2016-2030F
- Figure 80. Spain Laptops Market Share, By Operating System, In USD Billion, 2016-2030F
- Figure 81. Spain Laptops Market Share, By Distribution Channel, In USD Billion, 2016-2030F
- Figure 82. Turkey Laptops Market, By Value, In USD Billion, 2016-2030F
- Figure 83. Turkey Laptops Market, By Volume, In Million Units, 2016-2030F
- Figure 84. Turkey Laptops Market Share, By Type, In USD Billion, 2016-2030F
- Figure 85. Turkey Laptops Market Share, By Screen Size, In USD Billion, 2016-2030F
- Figure 86. Turkey Laptops Market Share, By Operating System, In USD Billion, 2016-2030F
- Figure 87. Turkey Laptops Market Share, By Distribution Channel, In USD Billion, 2016-2030F
- Figure 88. Poland Laptops Market, By Value, In USD Billion, 2016-2030F
- Figure 89. Poland Laptops Market, By Volume, In Million Units, 2016-2030F
- Figure 90. Poland Laptops Market Share, By Type, In USD Billion, 2016-2030F
- Figure 91. Poland Laptops Market Share, By Screen Size, In USD Billion, 2016-2030F
- Figure 92. Poland Laptops Market Share, By Operating System, In USD Billion, 2016-2030F
- Figure 93. Poland Laptops Market Share, By Distribution Channel, In USD Billion, 2016-2030F
- Figure 94. South America Laptops Market, By Value, In USD Billion, 2016-2030F
- Figure 95. South America Laptops Market, By Volume, In Million Units, 2016-2030F
- Figure 96. South America Laptops Market Share, By Type, In USD Billion, 2016-2030F
- Figure 97. South America Laptops Market Share, By Screen Size, In USD Billion, 2016-2030F
- Figure 98. South America Laptops Market Share, By Operating System, In USD Billion, 2016-2030F
- Figure 99. South America Laptops Market Share, By Distribution Channel, In USD Billion, 2016-2030F
- Figure 100. South America Laptops Market Share, By Country, In USD Billion, 2016-2030F
- Figure 101. Brazil Laptops Market, By Value, In USD Billion, 2016-2030F
- Figure 102. Brazil Laptops Market, By Volume, In Million Units, 2016-2030F
- Figure 103. Brazil Laptops Market Share, By Type, In USD Billion, 2016-2030F
- Figure 104. Brazil Laptops Market Share, By Screen Size, In USD Billion, 2016-2030F
- Figure 105. Brazil Laptops Market Share, By Operating System, In USD Billion, 2016-2030F
- Figure 106. Brazil Laptops Market Share, By Distribution Channel, In USD Billion, 2016-2030F
- Figure 107. Argentina Laptops Market, By Value, In USD Billion, 2016-2030F
- Figure 108. Argentina Laptops Market, By Volume, In Million Units, 2016-2030F
- Figure 109. Argentina Laptops Market Share, By Type, In USD Billion, 2016-2030F
- Figure 110. Argentina Laptops Market Share, By Screen Size, In USD Billion, 2016-2030F
- Figure 111. Argentina Laptops Market Share, By Operating System, In USD Billion, 2016-2030F
- Figure 112. Argentina Laptops Market Share, By Distribution Channel, In USD Billion, 2016-2030F
- Figure 113. Asia-Pacific Laptops Market, By Value, In USD Billion, 2016-2030F
- Figure 114. Asia-Pacific Laptops Market, By Volume, In Million Units, 2016-2030F
- Figure 115. Asia-Pacific Laptops Market Share, By Type, In USD Billion, 2016-2030F
- Figure 116. Asia-Pacific Laptops Market Share, By Screen Size, In USD Billion, 2016-2030F
- Figure 117. Asia-Pacific Laptops Market Share, By Operating System, In USD Billion, 2016-2030F
- Figure 118. Asia-Pacific Laptops Market Share, By Distribution Channel, In USD Billion, 2016-2030F
- Figure 119. Asia-Pacific Laptops Market Share, By Country, In USD Billion, 2016-2030F
- Figure 120. India Laptops Market, By Value, In USD Billion, 2016-2030F
- Figure 121. India Laptops Market, By Volume, In Million Units, 2016-2030F
- Figure 122. India Laptops Market Share, By Type, In USD Billion, 2016-2030F
- Figure 123. India Laptops Market Share, By Screen Size, In USD Billion, 2016-2030F
- Figure 124. India Laptops Market Share, By Operating System, In USD Billion, 2016-2030F
- Figure 125. India Laptops Market Share, By Distribution Channel, In USD Billion, 2016-2030F
- Figure 126. China Laptops Market, By Value, In USD Billion, 2016-2030F
- Figure 127. China Laptops Market, By Volume, In Million Units, 2016-2030F
- Figure 128. China Laptops Market Share, By Type, In USD Billion, 2016-2030F
- Figure 129. China Laptops Market Share, By Screen Size, In USD Billion, 2016-2030F
- Figure 130. China Laptops Market Share, By Operating System, In USD Billion, 2016-2030F
- Figure 131. China Laptops Market Share, By Distribution Channel, In USD Billion, 2016-2030F
- Figure 132. Japan Laptops Market, By Value, In USD Billion, 2016-2030F
- Figure 133. Japan Laptops Market, By Volume, In Million Units, 2016-2030F
- Figure 134. Japan Laptops Market Share, By Type, In USD Billion, 2016-2030F
- Figure 135. Japan Laptops Market Share, By Screen Size, In USD Billion, 2016-2030F
- Figure 136. Japan Laptops Market Share, By Operating System, In USD Billion, 2016-2030F
- Figure 137. Japan Laptops Market Share, By Distribution Channel, In USD Billion, 2016-2030F
- Figure 138. Australia Laptops Market, By Value, In USD Billion, 2016-2030F
- Figure 139. Australia Laptops Market, By Volume, In Million Units, 2016-2030F
- Figure 140. Australia Laptops Market Share, By Type, In USD Billion, 2016-2030F
- Figure 141. Australia Laptops Market Share, By Screen Size, In USD Billion, 2016-2030F
- Figure 142. Australia Laptops Market Share, By Operating System, In USD Billion, 2016-2030F
- Figure 143. Australia Laptops Market Share, By Distribution Channel, In USD Billion, 2016-2030F
- Figure 144. Vietnam Laptops Market, By Value, In USD Billion, 2016-2030F
- Figure 145. Vietnam Laptops Market, By Volume, In Million Units, 2016-2030F
- Figure 146. Vietnam Laptops Market Share, By Type, In USD Billion, 2016-2030F
- Figure 147. Vietnam Laptops Market Share, By Screen Size, In USD Billion, 2016-2030F
- Figure 148. Vietnam Laptops Market Share, By Operating System, In USD Billion, 2016-2030F
- Figure 149. Vietnam Laptops Market Share, By Distribution Channel, In USD Billion, 2016-2030F
- Figure 150. South Korea Laptops Market, By Value, In USD Billion, 2016-2030F
- Figure 151. South Korea Laptops Market, By Volume, In Million Units, 2016-2030F
- Figure 152. South Korea Laptops Market Share, By Type, In USD Billion, 2016-2030F
- Figure 153. South Korea Laptops Market Share, By Screen Size, In USD Billion, 2016-2030F
- Figure 154. South Korea Laptops Market Share, By Operating System, In USD Billion, 2016-2030F
- Figure 155. South Korea Laptops Market Share, By Distribution Channel, In USD Billion, 2016-2030F
- Figure 156. Indonesia Laptops Market, By Value, In USD Billion, 2016-2030F
- Figure 157. Indonesia Laptops Market, By Volume, In Million Units, 2016-2030F
- Figure 158. Indonesia Laptops Market Share, By Type, In USD Billion, 2016-2030F
- Figure 159. Indonesia Laptops Market Share, By Screen Size, In USD Billion, 2016-2030F
- Figure 160. Indonesia Laptops Market Share, By Operating System, In USD Billion, 2016-2030F
- Figure 161. Indonesia Laptops Market Share, By Distribution Channel, In USD Billion, 2016-2030F
- Figure 162. Philippines Laptops Market, By Value, In USD Billion, 2016-2030F
- Figure 163. Philippines Laptops Market, By Volume, In Million Units, 2016-2030F
- Figure 164. Philippines Laptops Market Share, By Type, In USD Billion, 2016-2030F
- Figure 165. Philippines Laptops Market Share, By Screen Size, In USD Billion, 2016-2030F
- Figure 166. Philippines Laptops Market Share, By Operating System, In USD Billion, 2016-2030F
- Figure 167. Philippines Laptops Market Share, By Distribution Channel, In USD Billion, 2016-2030F
- Figure 168. Middle East & Africa Laptops Market, By Value, In USD Billion, 2016-2030F
- Figure 169. Middle East & Africa Laptops Market, By Volume, In Million Units, 2016-2030F
- Figure 170. Middle East & Africa Laptops Market Share, By Type, In USD Billion, 2016-2030F
- Figure 171. Middle East & Africa Laptops Market Share, By Screen Size, In USD Billion, 2016-2030F
- Figure 172. Middle East & Africa Laptops Market Share, By Operating System, In USD Billion, 2016-2030F
- Figure 173. Middle East & Africa Laptops Market Share, By Distribution Channel, In USD Billion, 2016-2030F
- Figure 174. Middle East & Africa Laptops Market Share, By Country, In USD Billion, 2016-2030F
- Figure 175. Saudi Arabia Laptops Market, By Value, In USD Billion, 2016-2030F
- Figure 176. Saudi Arabia Laptops Market, By Volume, In Million Units, 2016-2030F
- Figure 177. Saudi Arabia Laptops Market Share, By Type, In USD Billion, 2016-2030F
- Figure 178. Saudi Arabia Laptops Market Share, By Screen Size, In USD Billion, 2016-2030F
- Figure 179. Saudi Arabia Laptops Market Share, By Operating System, In USD Billion, 2016-2030F
- Figure 180. Saudi Arabia Laptops Market Share, By Distribution Channel, In USD Billion, 2016-2030F
- Figure 181. UAE Laptops Market, By Value, In USD Billion, 2016-2030F
- Figure 182. UAE Laptops Market, By Volume, In Million Units, 2016-2030F
- Figure 183. UAE Laptops Market Share, By Type, In USD Billion, 2016-2030F
- Figure 184. UAE Laptops Market Share, By Screen Size, In USD Billion, 2016-2030F
- Figure 185. UAE Laptops Market Share, By Operating System, In USD Billion, 2016-2030F
- Figure 186. UAE Laptops Market Share, By Distribution Channel, In USD Billion, 2016-2030F
- Figure 187. South Africa Laptops Market, By Value, In USD Billion, 2016-2030F
- Figure 188. South Africa Laptops Market, By Volume, In Million Units, 2016-2030F
- Figure 189. South Africa Laptops Market Share, By Type, In USD Billion, 2016-2030F
- Figure 190. South Africa Laptops Market Share, By Screen Size, In USD Billion, 2016-2030F
- Figure 191. South Africa Laptops Market Share, By Operating System, In USD Billion, 2016-2030F
- Figure 192. South Africa Laptops Market Share, By Distribution Channel, In USD Billion, 2016-2030F
- Figure 193. By Type Map-Market Size (USD Billion) & Growth Rate (%), 2022
- Figure 194. By Screen Size Map-Market Size (USD Billion) & Growth Rate (%), 2022
- Figure 195. By Operating System Map-Market Size (USD Billion) & Growth Rate (%), 2022
- Figure 196. By Distribution Channel Map-Market Size (USD Billion) & Growth Rate (%), 2022
- Figure 197. By Region Map-Market Size (USD Billion) & Growth Rate (%), 2022
Global laptops market takes the lead in technological innovation, dynamically responding to the evolving needs of a connected world. Laptops, serving as the pinnacle of portable computing, have become essential tools in the realms of work, education and leisure. The global laptops market size was valued at USD 179.5 billion in 2022, which is expected to reach USD 310.7 billion in 2030, with a CAGR of 7.1% for the forecast period between 2022 and 2030. This market is displaying a blend of robust growth and transformative shifts, fueled by factors such as the rise in remote work and learning, technological advancements and the growing demand for versatile computing solutions.
Technological advancements and rising laptops adaptation play a crucial role in driving the growth of the laptop market, globally. Changing consumer behavior, spreading work-from-home culture, convenience and portability are major factors that drive the market. Global laptops market includes some renowned players like HP, Apple, Dell and Lenovo and have been engaged in a competitive race to offer cutting-edge features, improved performance and sleek designs. The global laptops market has not been without its challenges. The global semiconductor shortage has reverberated through the electronics manufacturing supply chain, impacting the production and availability of laptops.
Remote Work and Education
Remote work and education have a major impact on the global laptops market. Remote work and online education are shaping trends, influencing demand and driving innovations in the global laptops market. The transition to remote work and online education, specifically after COVID-19, has resulted in a notable increase in the need for laptops. Those who work or attend classes from home seek personal computing devices, and laptops are favored for their portability and adaptability. Laptops, due to remote work or hybrid models, are gradually replacing desktops in office workspaces worldwide. With the market analysis of the United States, it is estimated that about 42% of the working population works from home or in a hybrid setup. This increased reliance on laptops has resulted in higher sales for manufacturers. Companies and educational institutions have invested in providing laptops to employees and students to facilitate remote collaboration and learning.
Laptops with 2 Screens Creating Buzz
Often called dual-screen laptops or dual-display laptops, these innovatively designed systems provide customers with an increased workspace and additional opportunities for multitasking. These laptops with two screens are designed to increase productivity by giving users more screen space for multitasking, creating content, or using particular apps. Users can engage with their devices in new ways using the secondary screens, which frequently allow interactive features like touch, stylus input, inbuilt keyboard and other capabilities.
In 2023, Lenovo launched the Yoga Book 9i. It brings something special to the laptop industry. The Yoga Book 9i uses a second touchscreen instead. The package includes a stylus, an extra detachable keyboard, and a case. The seamless fusion of two huge OLED screens creates a fascinating dual-screen that offers a new perspective on productivity.
Rising Demand for Gaming Laptops
Recent development in some past years in the global laptops market has been a growing sales, demand and craze for gaming laptops. Thanks to the rise and adoption of YouTube, Generation Z and Millennials are heavily investing in gaming laptops. The gaming industry is one of the fastest growing industries in the world in the realm of electronic devices, with the constant rise of the gaming industry the demand for high-end gaming laptops will increase. HP, ASUS and MSI (Micro-Star International) are some brands that cater to these specific users. The gaming industry's growth has fueled the demand for high-performance gaming laptops. Gaming enthusiasts seek devices with advanced graphics capabilities, high refresh rates, high-end performance and efficient cooling systems for an immersive gaming experience.
HP, a California-based company, reported that in Q1 2023, it sold 47,298 gaming laptops, accounting for 37.53% of the total (compared to 46,139 units in Q1 2022). It sold 552,000 gaming computers last year, up from 371,000 in 2021.
Technological Advancements
There used to be a time when laptops were simple and considered as just a portable computer used for day-to-day simple tasks. But over the last decade, these devices have evolved in such a way that they are able to handle complex tasks from video editing to gaming to coding, and all of this is possible only because of technological advancements in the global laptops market. Ongoing technological advancements, such as faster processors and more energy-efficient CPUs (Central Processing Units), contribute to enhanced overall performance and responsiveness in laptops. Graphics processing units (GPUs) have seen significant advancements, particularly in gaming laptops and those designed for graphics-intensive tasks like gaming, streaming, video editing and more. improved graphics, and innovative form factors, drive consumers to upgrade their laptops for enhanced performance and features. Now, laptops are incorporating high-resolution displays, including Full HD (1080p), Quad HD (1440p) and even 4K displays in LED and OLED display panels. Such advancements in technologies in the global laptops market have allowed for the creation of thinner, slimmer and lighter laptop designs without compromising performance.
In 2023, at WorldWide Developer Conference , Apple announced the 11.5mm thin 15-inch MacBook Air. According to Apple, this laptop is the thinnest in the world and weighs slightly over three pounds.
Impact of COVID-19
The COVID-19 pandemic has had a profound impact on the global laptops market, influencing demand, supply chains, and consumer behavior. The substantial surge in demand for laptops stemmed from the widespread embrace of remote work and online learning amid lockdowns and social distancing measures. Professionals, students and organizations actively sought portable computing solutions to support seamless remote collaboration and virtual education. The global supply chain faced disruptions due to factory closures, transportation restrictions and semiconductor shortages. These challenges affected the production and availability of laptops, leading to delays and increased demand and prices for laptops.
Key Player Landscape and Outlook
The landscape of key players in the global laptops market is characterized by strong competition and innovation in designs, display and functionality. Prominent brands in the global laptops market are HP, Dell, Lenovo, Apple and ASUS dominate the market, continually introducing advanced features like strong and powerful processors, clear and vibrant displays with higher refresh rates, longer battery life and multifunctional. These players invest heavily in research and development to stay at the forefront of technological advancements. Additionally, partnerships and collaborations with tech companies, such as Intel, Microsoft and Nvidia, have become a common strategy to enhance user experience. The outlook for key players remains optimistic as the market continues to expand, with growing consumer demand for laptops both at homes and office spaces. The key focus areas include compact and stylish products and improved user interface insights to cater to changing consumer preferences and their product application.
Moreover, regional-level players are also coming up with their product ranges at very reasonable prices that are available for sale through online portals. In July 2023, Reliance Retail introduced its new JioBook for USD 197 (INR 16,499). JioBook is a pocket friendly and lightweight 4G powered laptop available at Reliance digital stores as well as online retailers such as Amazon.
Table of Contents
1. Research Methodology
2. Project Scope & Definitions
3. Impact of COVID-19 on Global Laptops Market
4. Executive Summary
5. Voice of Customer
- 5.1. Demographics (Age/Cohort Analysis - Baby Boomers and GenX, Millenials, Gen Z; Gender; Income - Low, Mid and High; Geography; Nationality; etc.)
- 5.2. Market Awareness and Product Information
- 5.3. Brand Awareness and Loyalty
- 5.4. Factors Considered in Purchase Decision
- 5.4.1. Brand Name
- 5.4.2. Price
- 5.4.3. Performance
- 5.4.4. Size
- 5.4.5. Weight
- 5.4.6. Material
- 5.4.7. Warranty Period
- 5.4.8. Battery Backup
- 5.5. Purpose of Purchase
- 5.6. Frequency of Purchase
- 5.7. Medium of Purchase
- 5.8. Role of Brand Ambassador or Influencer Marketing on Product/Brand Absorption
6. Global Laptops Market Outlook, 2016-2030F
- 6.1. Market Size & Forecast
- 6.1.1. By Value
- 6.1.2. By Volume
- 6.2. By Type
- 6.2.1. Traditional
- 6.2.1.1. General-Purpose Laptop
- 6.2.1.2. Gaming Laptop
- 6.2.1.3. Work Station Laptop
- 6.2.2. Convertible 2-in-1 Laptop
- 6.2.1. Traditional
- 6.3. By Screen Size
- 6.3.1. Up to 10.9"
- 6.3.2. 11" to 14.9"
- 6.3.3. 15" to 16.9"
- 6.3.4. 17" and more
- 6.4. By Operating System
- 6.4.1. Windows
- 6.4.2. MacOS
- 6.4.3. Linux
- 6.4.4. Others (Chrome, Dos)
- 6.5. By Distribution Channel
- 6.5.1. Online
- 6.5.1.1. Company Websites
- 6.5.1.2. Online Retailers/Dealers
- 6.5.2. Offline
- 6.5.2.1. Specialty Stores
- 6.5.2.2. Muti-brand Outlets
- 6.5.2.3. Others
- 6.5.1. Online
- 6.6. By Region
- 6.6.1. North America
- 6.6.2. South America
- 6.6.3. Europe
- 6.6.4. Asia-Pacific
- 6.6.5. Middle East & Africa
- 6.7. By Company Market Share (%), 2022
7. Global Laptops Market Outlook, By Region, 2016-2030F
- 7.1. North America*
- 7.1.1. Market Size & Forecast
- 7.1.1.1. By Value
- 7.1.1.2. By Volume
- 7.1.2. By Type
- 7.1.2.1. Traditional
- 7.1.2.1.1. General-Purpose Laptop
- 7.1.2.1.2. Gaming Laptop
- 7.1.2.1.3. Work Station Laptop
- 7.1.2.2. Convertible 2-in-1 Laptop
- 7.1.3. By Screen Size
- 7.1.3.1. Up to 10.9"
- 7.1.3.2. 11" to 14.9"
- 7.1.3.3. 15" to 16.9"
- 7.1.3.4. 17" and more
- 7.1.4. By Operating System
- 7.1.4.1. Windows
- 7.1.4.2. MacOS
- 7.1.4.3. Linux
- 7.1.4.4. Others (Chrome, Dos)
- 7.1.5. By Distribution Channel
- 7.1.5.1. Online
- 7.1.5.1.1. Company Websites
- 7.1.5.1.2. Online Retailers/Dealers
- 7.1.5.2. Offline
- 7.1.5.2.1. Specialty Stores
- 7.1.5.2.2. Muti-brand Outlets
- 7.1.5.2.3. Others
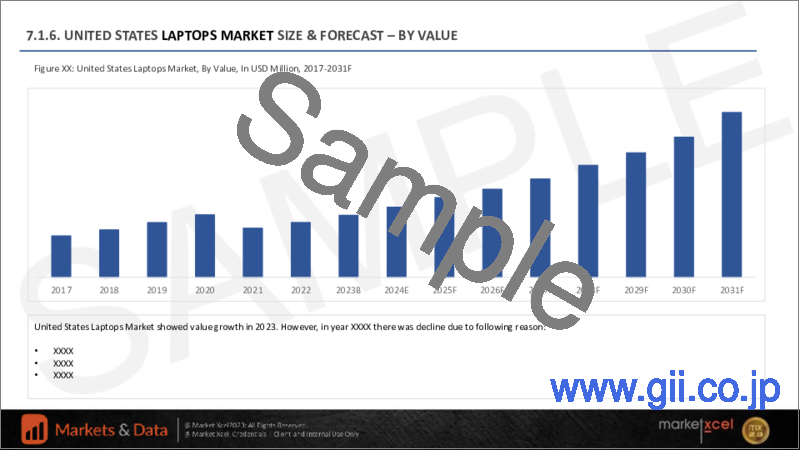
- 7.1.6. United States*
- 7.1.6.1. Market Size & Forecast
- 7.1.6.1.1. By Value
- 7.1.6.1.2. By Volume
- 7.1.6.2. By Type
- 7.1.6.2.1. Traditional
- 7.1.6.2.1.1. General-Purpose Laptop
- 7.1.6.2.1.2. Gaming Laptop
- 7.1.6.2.1.3. Work Station Laptop
- 7.1.6.2.2. Convertible 2-in-1 Laptop
- 7.1.6.3. By Screen Size
- 7.1.6.3.1. Up to 10.9"
- 7.1.6.3.2. 11" to 14.9"
- 7.1.6.3.3. 15" to 16.9"
- 7.1.6.3.4. 17" and more
- 7.1.6.4. By Operating System
- 7.1.6.4.1. Windows
- 7.1.6.4.2. MacOS
- 7.1.6.4.3. Linux
- 7.1.6.4.4. Others (Chrome, Dos)
- 7.1.6.5. By Distribution Channel
- 7.1.6.5.1. Online
- 7.1.6.5.1.1. Company Websites
- 7.1.6.5.1.2. Online Retailers/Dealers
- 7.1.6.5.2. Offline
- 7.1.6.5.2.1. Specialty Stores
- 7.1.6.5.2.2. Muti-brand Outlets
- 7.1.6.5.2.3. Others
- 7.1.7. Canada
- 7.1.8. Mexico
- 7.1.1. Market Size & Forecast
All segments will be provided for all regions and countries covered:
- 7.2. Europe
- 7.2.1. Germany
- 7.2.2. France
- 7.2.3. Italy
- 7.2.4. United Kingdom
- 7.2.5. Russia
- 7.2.6. Netherlands
- 7.2.7. Spain
- 7.2.8. Turkey
- 7.2.9. Poland
- 7.3. South America
- 7.3.1. Brazil
- 7.3.2. Argentina
- 7.4. Asia Pacific
- 7.4.1. India
- 7.4.2. China
- 7.4.3. Japan
- 7.4.4. Australia
- 7.4.5. Vietnam
- 7.4.6. South Korea
- 7.4.7. Indonesia
- 7.4.8. Philippines
- 7.5. Middle East & Africa
- 7.5.1. Saudi Arabia
- 7.5.2. UAE
- 7.5.3. South Africa
8. Market Mapping, 2022
- 8.1. By Type
- 8.2. By Screen Size
- 8.3. By Operating System
- 8.4. By Distribution Channel
- 8.5. By Region
9. Macro Environment and Industry Structure
- 9.1. Supply Demand Analysis
- 9.2. Import Export Analysis
- 9.3. Value Chain Analysis
- 9.4. PESTEL Analysis
- 9.4.1. Political Factors
- 9.4.2. Economic System
- 9.4.3. Social Implications
- 9.4.4. Technological Advancements
- 9.4.5. Environmental Impacts
- 9.4.6. Legal Compliances and Regulatory Policies (Statutory Bodies Included)
- 9.5. Porter's Five Forces Analysis
- 9.5.1. Supplier Power
- 9.5.2. Buyer Power
- 9.5.3. Substitution Threat
- 9.5.4. Threat from New Entrant
- 9.5.5. Competitive Rivalry
10. Market Dynamics
- 10.1. Growth Drivers
- 10.2. Growth Inhibitors (Challenges and Restraints)
11. Key Players Landscape
- 11.1. Competition Matrix of Top Five Market Leaders
- 11.2. Market Revenue Analysis of Top Five Market Leaders (in %, 2022)
- 11.3. Mergers and Acquisitions/Joint Ventures (If Applicable)
- 11.4. SWOT Analysis (For Five Market Players)
- 11.5. Patent Analysis (If Applicable)
12. Pricing Analysis
13. Case Studies
14. Key Players Outlook
- 14.1. HP Inc.
- 14.1.1. Company Details
- 14.1.2. Key Management Personnel
- 14.1.3. Products & Services
- 14.1.4. Financials (As reported)
- 14.1.5. Key Market Focus & Geographical Presence
- 14.1.6. Recent Developments
- 14.2. Apple Inc.
- 14.3. Acer Inc.
- 14.4. Dell Technologies, Inc
- 14.5. Lenovo Group Ltd.
- 14.6. ASUSTeK COMPUTER INC.
- 14.7. Haier Inc.
- 14.8. Samsung Electronics Co., Ltd.
- 14.9. Micro-Star Int'l Co., Ltd.
- 14.10. TOSHIBA CORPORATION
Companies mentioned above DO NOT hold any order as per market share and can be changed as per information available during research work.

