|
|
市場調査レポート
商品コード
1389882
フリップチップの世界市場の評価:ウエハーバンピング技術別、パッケージング方法別、製品別、産業別、地域別、機会、予測(2016年~2030年)Flip Chip Market Assessment, By Wafer Bumping Technology, By Packaging Method, By Product, By Industry, By Region, Opportunities and Forecast, 2016-2030F |
||||||
|
|
|||||||
カスタマイズ可能
|
|||||||


| フリップチップの世界市場の評価:ウエハーバンピング技術別、パッケージング方法別、製品別、産業別、地域別、機会、予測(2016年~2030年) |
|
出版日: 2023年12月04日
発行: Markets & Data
ページ情報: 英文 205 Pages
納期: 3~5営業日
|

- 全表示
- 概要
- 図表
- 目次
世界のフリップチップ市場は近年大きな成長を示しており、今後も力強い拡大ペースを維持する見込みです。予測される収益は2022年に約280億4,000万米ドルで、2030年までに484億7,000万米ドルに達し、2023年~2030年にCAGRで7.1%の健全な成長が予測されています。
市場は、スマートフォンやIoTデバイスなど、より小型で高性能な電子機器に対する需要の高まりにより、急速に拡大しています。第二に、5GやAIなどの半導体技術の進歩が高性能CPUの需要を促進しています。最後に、自動車産業の電動化や自動運転に向けた動きは、車両の通信や安全性の機能を高めるフリップチップ技術の需要を増加させます。
国際エネルギー機関(IEA)が強調しているように、電気自動車部門の急成長はフリップチップ市場に大きな影響を与えます。EVは、電源管理、モーター制御、バッテリー管理システムなどのさまざまな用途で、フリップチップを含む先進の半導体技術に依存しています。EVの販売台数が世界的に増加し続ける中、フリップチップのような小型で高性能なチップの需要は大きく伸びると予測されます。この動向は、より広範な自動車部門の電動化への動きと一致しており、EV革命を実現する上で重要な役割を果たすフリップチップ市場に有望な見通しをもたらしています。
例えば2023年9月、CamtekはFormFactorのFRT Metrology事業を1億米ドルで買収し、先進パッケージングとシリコンカーバイド部門の高精度計測ソリューションの専門知識を強化し、半導体産業での地位を確固たるものにしました。
5G革命がフリップチップ市場に拍車をかける
5Gネットワークの普及はフリップチップ市場の成長に大きく寄与します。フリップチップは、より高いデータスループットと短い遅延を管理できる高性能回路を必要とするため、5G技術に最適な選択肢です。これらのチップは電気的・熱的特性が向上しており、データ処理の高速化と発熱の低減を可能にします。さらに、その小さいサイズは5Gインフラの省スペース要件に対応しています。5Gが国際的に展開され続け、その用途がスマートフォンだけでなく、IoT、自律走行車、産業オートメーションへと拡大するにつれて、高性能フリップチップの需要が急増し、市場の発展とイノベーションが推進される可能性が高いです。
例えばSETは2022年11月、通信、量子、自動車、防衛、HPC、AI、VR用途向けに、高い精度を持つ、アライメント精度を±0.1µmに高めた先進のフリップチップボンダ「FC150 PLATINUM」を発売しました。
フリップチップを利用したカーエレクトロニクスの革新
ADAS(先進運転支援システム)や電気自動車(EV)に後押しされて活況を呈しているカーエレクトロニクス部門は、フリップチップ市場の成長を促進する重大な要素となっています。衝突回避、アダプティブクルーズコントロール、セルフパーキングなどのタスクに対し、ADASは高性能CPUに依存しており、小型で効率的な半導体ソリューションが必要とされています。複雑なバッテリー管理システムや車載コンピューターを搭載するEVには、信頼性が高く電力効率の高い半導体が必要です。フリップチップは、その小さなフォームファクターと高い性能で注目され、これらのカーエレクトロニクスのニーズを満たすことに成功しています。自動車部門が電動化と自動化に向かうにつれて、フリップチップの需要は増加し続け、市場の成長が強化されています。
例えば、Advanced Semiconductor Engineering(ASE)は2023年10月、VIPackプラットフォーム向けにパッケージアーキテクチャ設計を最適化するIntegrated Design Ecosystem(IDE)を発表しました。IDEはSoCからマルチダイへの統合を簡略化し、設計効率を50%向上させ、サイクルタイムを大幅に短縮します。IDEはパッケージ設計においてチップレット、メモリ、先進のファンアウト構造をサポートします。
当レポートでは、世界のフリップチップ市場について調査分析し、市場規模と予測、市場力学、主要企業の情勢と見通しなどを提供しています。
目次
第1章 調査手法
第2章 プロジェクトの範囲と定義
第3章 世界のフリップチップ市場に対するCOVID-19の影響
第4章 エグゼクティブサマリー
第5章 顧客の声
- 製品と市場のインテリジェンス
- ブランド認知の方式
- 購入決定において考慮される要素
- プライバシーと安全規制への配慮
第6章 世界のフリップチップ市場の見通し(2016年~2030年)
- 市場規模と予測
- 金額
- 数量
- ウエハーバンピング技術別
- 銅ピラー
- 鉛フリー
- 錫/鉛共晶はんだ
- 金スタッド+メッキはんだ
- パッケージング方法別
- 2D IC
- 2.5D IC
- 3D IC
- 製品別
- メモリ
- LED
- CMOSイメージセンサー
- SoC
- GPU
- CPU
- 産業別
- IT・通信
- 工業
- 電子
- 自動車
- 医療
- 航空宇宙・防衛
- その他
- 地域別
- 北米
- 欧州
- アジア太平洋
- 南米
- 中東・アフリカ
- 市場シェア:企業別(2022年)
第7章 世界のフリップチップ市場の見通し:地域別(2016年~2030年)
- 北米
- 市場規模と予測
- ウエハーバンピング技術別
- パッケージング方法別
- 製品別
- 産業別
- 米国
- カナダ
- メキシコ
- 欧州
- ドイツ
- フランス
- イタリア
- 英国
- ロシア
- オランダ
- スペイン
- トルコ
- ポーランド
- アジア太平洋
- インド
- 中国
- 日本
- オーストラリア
- ベトナム
- 韓国
- インドネシア
- フィリピン
- 南米
- ブラジル
- アルゼンチン
- 中東・アフリカ
- サウジアラビア
- アラブ首長国連邦
- 南アフリカ
第8章 市場マッピング(2022年)
- ウエハーバンピング技術別
- パッケージング方法別
- 製品別
- 産業別
- 地域別
第9章 マクロ環境と産業構造
- 需給分析
- 輸出入の分析
- バリューチェーン分析
- PESTEL分析
- ポーターのファイブフォース分析
第10章 市場力学
- 成長促進要因
- 成長抑制要因(課題、抑制要因)
第11章 主要企業情勢
- マーケットリーダー上位5社の競合マトリクス
- マーケットリーダー上位5社の市場収益分析(2022年)
- 合併と買収/合弁事業(該当する場合)
- SWOT分析(市場参入企業5社向け)
- 特許分析(該当する場合)
第12章 ケーススタディ
第13章 主要企業の見通し
- Amkor Technology, Inc.
- ASE Technology Holding Co, Ltd
- FormFactor, Inc.
- Globalfoundries Inc.
- IBM Corporation
- Intel Corporation
- Samsung Electronics Co., Ltd.
- Taiwan Semiconductor Manufacturing Company Limited
- Texas Instruments Incorporated
- United Microelectronics Corporation
第14章 戦略的推奨事項
第15章 当社について、免責事項
List of Tables
- Table 1. Pricing Analysis of Products from Key Players
- Table 2. Competition Matrix of Top 5 Market Leaders
- Table 3. Mergers & Acquisitions/ Joint Ventures (If Applicable)
- Table 4. About Us - Regions and Countries Where We Have Executed Client Projects
List of Figures
- Figure 1. Global Flip Chip Market, By Value, In USD Billion, 2016-2030F
- Figure 2. Global Flip Chip Market, By Volume, In Thousand Units, 2016-2030F
- Figure 3. Global Flip Chip Market Share, By Wafer Bumping Technology, In USD Billion, 2016-2030F
- Figure 4. Global Flip Chip Market Share, By Packaging Method, In USD Billion, 2016-2030F
- Figure 5. Global Flip Chip Market Share, By Product, In USD Billion, 2016-2030F
- Figure 6. Global Flip Chip Market Share, By Industry, In USD Billion, 2016-2030F
- Figure 7. Global Flip Chip Market Share, By Region, In USD Billion, 2016-2030F
- Figure 8. North America Flip Chip Market, By Value, In USD Billion, 2016-2030F
- Figure 9. North America Flip Chip Market, By Volume, In Thousand Units, 2016-2030F
- Figure 10. North America Flip Chip Market Share, By Wafer Bumping Technology, In USD Billion, 2016-2030F
- Figure 11. North America Flip Chip Market Share, By Packaging Method, In USD Billion, 2016-2030F
- Figure 12. North America Flip Chip Market Share, By Product, In USD Billion, 2016-2030F
- Figure 13. North America Flip Chip Market Share, By Industry, In USD Billion, 2016-2030F
- Figure 14. North America Flip Chip Market Share, By Country, In USD Billion, 2016-2030F
- Figure 15. United States Flip Chip Market, By Value, In USD Billion, 2016-2030F
- Figure 16. United States Flip Chip Market, By Volume, In Thousand Units, 2016-2030F
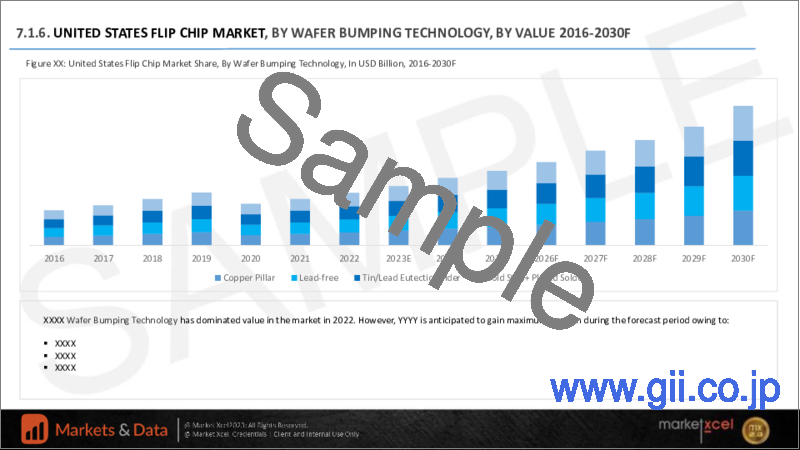
- Figure 17. United States Flip Chip Market Share, By Wafer Bumping Technology, In USD Billion, 2016-2030F
- Figure 18. United States Flip Chip Market Share, By Packaging Method, In USD Billion, 2016-2030F
- Figure 19. United States Flip Chip Market Share, By Product, In USD Billion, 2016-2030F
- Figure 20. United States Flip Chip Market Share, By Industry, In USD Billion, 2016-2030F
- Figure 21. Canada Flip Chip Market, By Value, In USD Billion, 2016-2030F
- Figure 22. Canada Flip Chip Market, By Volume, In Thousand Units, 2016-2030F
- Figure 23. Canada Flip Chip Market Share, By Wafer Bumping Technology, In USD Billion, 2016-2030F
- Figure 24. Canada Flip Chip Market Share, By Packaging Method, In USD Billion, 2016-2030F
- Figure 25. Canada Flip Chip Market Share, By Product, In USD Billion, 2016-2030F
- Figure 26. Canada Flip Chip Market Share, By Industry, In USD Billion, 2016-2030F
- Figure 27. Mexico Flip Chip Market, By Value, In USD Billion, 2016-2030F
- Figure 28. Mexico Flip Chip Market, By Volume, In Thousand Units, 2016-2030F
- Figure 29. Mexico Flip Chip Market Share, By Wafer Bumping Technology, In USD Billion, 2016-2030F
- Figure 30. Mexico Flip Chip Market Share, By Packaging Method, In USD Billion, 2016-2030F
- Figure 31. Mexico Flip Chip Market Share, By Product, In USD Billion, 2016-2030F
- Figure 32. Mexico Flip Chip Market Share, By Industry, In USD Billion, 2016-2030F
- Figure 33. Europe Flip Chip Market, By Value, In USD Billion, 2016-2030F
- Figure 34. Europe Flip Chip Market, By Volume, In Thousand Units, 2016-2030F
- Figure 35. Europe Flip Chip Market Share, By Wafer Bumping Technology, In USD Billion, 2016-2030F
- Figure 36. Europe Flip Chip Market Share, By Packaging Method, In USD Billion, 2016-2030F
- Figure 37. Europe Flip Chip Market Share, By Product, In USD Billion, 2016-2030F
- Figure 38. Europe Flip Chip Market Share, By Industry, In USD Billion, 2016-2030F
- Figure 39. Europe Flip Chip Market Share, By Country, In USD Billion, 2016-2030F
- Figure 40. Germany Flip Chip Market, By Value, In USD Billion, 2016-2030F
- Figure 41. Germany Flip Chip Market, By Volume, In Thousand Units, 2016-2030F
- Figure 42. Germany Flip Chip Market Share, By Wafer Bumping Technology, In USD Billion, 2016-2030F
- Figure 43. Germany Flip Chip Market Share, By Packaging Method, In USD Billion, 2016-2030F
- Figure 44. Germany Flip Chip Market Share, By Product, In USD Billion, 2016-2030F
- Figure 45. Germany Flip Chip Market Share, By Industry, In USD Billion, 2016-2030F
- Figure 46. France Flip Chip Market, By Value, In USD Billion, 2016-2030F
- Figure 47. France Flip Chip Market, By Volume, In Thousand Units, 2016-2030F
- Figure 48. France Flip Chip Market Share, By Wafer Bumping Technology, In USD Billion, 2016-2030F
- Figure 49. France Flip Chip Market Share, By Packaging Method, In USD Billion, 2016-2030F
- Figure 50. France Flip Chip Market Share, By Product, In USD Billion, 2016-2030F
- Figure 51. France Flip Chip Market Share, By Industry, In USD Billion, 2016-2030F
- Figure 52. Italy Flip Chip Market, By Value, In USD Billion, 2016-2030F
- Figure 53. Italy Flip Chip Market, By Volume, In Thousand Units, 2016-2030F
- Figure 54. Italy Flip Chip Market Share, By Wafer Bumping Technology, In USD Billion, 2016-2030F
- Figure 55. Italy Flip Chip Market Share, By Packaging Method, In USD Billion, 2016-2030F
- Figure 56. Italy Flip Chip Market Share, By Product, In USD Billion, 2016-2030F
- Figure 57. Italy Flip Chip Market Share, By Industry, In USD Billion, 2016-2030F
- Figure 58. United Kingdom Flip Chip Market, By Value, In USD Billion, 2016-2030F
- Figure 59. United Kingdom Flip Chip Market, By Volume, In Thousand Units, 2016-2030F
- Figure 60. United Kingdom Flip Chip Market Share, By Wafer Bumping Technology, In USD Billion, 2016-2030F
- Figure 61. United Kingdom Flip Chip Market Share, By Packaging Method, In USD Billion, 2016-2030F
- Figure 62. United Kingdom Flip Chip Market Share, By Product, In USD Billion, 2016-2030F
- Figure 63. United Kingdom Flip Chip Market Share, By Industry, In USD Billion, 2016-2030F
- Figure 64. Russia Flip Chip Market, By Value, In USD Billion, 2016-2030F
- Figure 65. Russia Flip Chip Market, By Volume, In Thousand Units, 2016-2030F
- Figure 66. Russia Flip Chip Market Share, By Wafer Bumping Technology, In USD Billion, 2016-2030F
- Figure 67. Russia Flip Chip Market Share, By Packaging Method, In USD Billion, 2016-2030F
- Figure 68. Russia Flip Chip Market Share, By Product, In USD Billion, 2016-2030F
- Figure 69. Russia Flip Chip Market Share, By Industry, In USD Billion, 2016-2030F
- Figure 70. Netherlands Flip Chip Market, By Value, In USD Billion, 2016-2030F
- Figure 71. Netherlands Flip Chip Market, By Volume, In Thousand Units, 2016-2030F
- Figure 72. Netherlands Flip Chip Market Share, By Wafer Bumping Technology, In USD Billion, 2016-2030F
- Figure 73. Netherlands Flip Chip Market Share, By Packaging Method, In USD Billion, 2016-2030F
- Figure 74. Netherlands Flip Chip Market Share, By Product, In USD Billion, 2016-2030F
- Figure 75. Netherlands Flip Chip Market Share, By Industry, In USD Billion, 2016-2030F
- Figure 76. Spain Flip Chip Market, By Value, In USD Billion, 2016-2030F
- Figure 77. Spain Flip Chip Market, By Volume, In Thousand Units, 2016-2030F
- Figure 78. Spain Flip Chip Market Share, By Wafer Bumping Technology, In USD Billion, 2016-2030F
- Figure 79. Spain Flip Chip Market Share, By Packaging Method, In USD Billion, 2016-2030F
- Figure 80. Spain Flip Chip Market Share, By Product, In USD Billion, 2016-2030F
- Figure 81. Spain Flip Chip Market Share, By Industry, In USD Billion, 2016-2030F
- Figure 82. Turkey Flip Chip Market, By Value, In USD Billion, 2016-2030F
- Figure 83. Turkey Flip Chip Market, By Volume, In Thousand Units, 2016-2030F
- Figure 84. Turkey Flip Chip Market Share, By Wafer Bumping Technology, In USD Billion, 2016-2030F
- Figure 85. Turkey Flip Chip Market Share, By Packaging Method, In USD Billion, 2016-2030F
- Figure 86. Turkey Flip Chip Market Share, By Product, In USD Billion, 2016-2030F
- Figure 87. Turkey Flip Chip Market Share, By Industry, In USD Billion, 2016-2030F
- Figure 88. Poland Flip Chip Market, By Value, In USD Billion, 2016-2030F
- Figure 89. Poland Flip Chip Market, By Volume, In Thousand Units, 2016-2030F
- Figure 90. Poland Flip Chip Market Share, By Wafer Bumping Technology, In USD Billion, 2016-2030F
- Figure 91. Poland Flip Chip Market Share, By Packaging Method, In USD Billion, 2016-2030F
- Figure 92. Poland Flip Chip Market Share, By Product, In USD Billion, 2016-2030F
- Figure 93. Poland Flip Chip Market Share, By Industry, In USD Billion, 2016-2030F
- Figure 94. South America Flip Chip Market, By Value, In USD Billion, 2016-2030F
- Figure 95. South America Flip Chip Market, By Volume, In Thousand Units, 2016-2030F
- Figure 96. South America Flip Chip Market Share, By Wafer Bumping Technology, In USD Billion, 2016-2030F
- Figure 97. South America Flip Chip Market Share, By Packaging Method, In USD Billion, 2016-2030F
- Figure 98. South America Flip Chip Market Share, By Product, In USD Billion, 2016-2030F
- Figure 99. South America Flip Chip Market Share, By Industry, In USD Billion, 2016-2030F
- Figure 100. South America Flip Chip Market Share, By Country, In USD Billion, 2016-2030F
- Figure 101. Brazil Flip Chip Market, By Value, In USD Billion, 2016-2030F
- Figure 102. Brazil Flip Chip Market, By Volume, In Thousand Units, 2016-2030F
- Figure 103. Brazil Flip Chip Market Share, By Wafer Bumping Technology, In USD Billion, 2016-2030F
- Figure 104. Brazil Flip Chip Market Share, By Packaging Method, In USD Billion, 2016-2030F
- Figure 105. Brazil Flip Chip Market Share, By Product, In USD Billion, 2016-2030F
- Figure 106. Brazil Flip Chip Market Share, By Industry, In USD Billion, 2016-2030F
- Figure 107. Argentina Flip Chip Market, By Value, In USD Billion, 2016-2030F
- Figure 108. Argentina Flip Chip Market, By Volume, In Thousand Units, 2016-2030F
- Figure 109. Argentina Flip Chip Market Share, By Wafer Bumping Technology, In USD Billion, 2016-2030F
- Figure 110. Argentina Flip Chip Market Share, By Packaging Method, In USD Billion, 2016-2030F
- Figure 111. Argentina Flip Chip Market Share, By Product, In USD Billion, 2016-2030F
- Figure 112. Argentina Flip Chip Market Share, By Industry, In USD Billion, 2016-2030F
- Figure 113. Asia-Pacific Flip Chip Market, By Value, In USD Billion, 2016-2030F
- Figure 114. Asia-Pacific Flip Chip Market, By Volume, In Thousand Units, 2016-2030F
- Figure 115. Asia-Pacific Flip Chip Market Share, By Wafer Bumping Technology, In USD Billion, 2016-2030F
- Figure 116. Asia-Pacific Flip Chip Market Share, By Packaging Method, In USD Billion, 2016-2030F
- Figure 117. Asia-Pacific Flip Chip Market Share, By Product, In USD Billion, 2016-2030F
- Figure 118. Asia-Pacific Flip Chip Market Share, By Industry, In USD Billion, 2016-2030F
- Figure 119. Asia-Pacific Flip Chip Market Share, By Country, In USD Billion, 2016-2030F
- Figure 120. India Flip Chip Market, By Value, In USD Billion, 2016-2030F
- Figure 121. India Flip Chip Market, By Volume, In Thousand Units, 2016-2030F
- Figure 122. India Flip Chip Market Share, By Wafer Bumping Technology, In USD Billion, 2016-2030F
- Figure 123. India Flip Chip Market Share, By Packaging Method, In USD Billion, 2016-2030F
- Figure 124. India Flip Chip Market Share, By Product, In USD Billion, 2016-2030F
- Figure 125. India Flip Chip Market Share, By Industry, In USD Billion, 2016-2030F
- Figure 126. China Flip Chip Market, By Value, In USD Billion, 2016-2030F
- Figure 127. China Flip Chip Market, By Volume, In Thousand Units, 2016-2030F
- Figure 128. China Flip Chip Market Share, By Wafer Bumping Technology, In USD Billion, 2016-2030F
- Figure 129. China Flip Chip Market Share, By Packaging Method, In USD Billion, 2016-2030F
- Figure 130. China Flip Chip Market Share, By Product, In USD Billion, 2016-2030F
- Figure 131. China Flip Chip Market Share, By Industry, In USD Billion, 2016-2030F
- Figure 132. Japan Flip Chip Market, By Value, In USD Billion, 2016-2030F
- Figure 133. Japan Flip Chip Market, By Volume, In Thousand Units, 2016-2030F
- Figure 134. Japan Flip Chip Market Share, By Wafer Bumping Technology, In USD Billion, 2016-2030F
- Figure 135. Japan Flip Chip Market Share, By Packaging Method, In USD Billion, 2016-2030F
- Figure 136. Japan Flip Chip Market Share, By Product, In USD Billion, 2016-2030F
- Figure 137. Japan Flip Chip Market Share, By Industry, In USD Billion, 2016-2030F
- Figure 138. Australia Flip Chip Market, By Value, In USD Billion, 2016-2030F
- Figure 139. Australia Flip Chip Market, By Volume, In Thousand Units, 2016-2030F
- Figure 140. Australia Flip Chip Market Share, By Wafer Bumping Technology, In USD Billion, 2016-2030F
- Figure 141. Australia Flip Chip Market Share, By Packaging Method, In USD Billion, 2016-2030F
- Figure 142. Australia Flip Chip Market Share, By Product, In USD Billion, 2016-2030F
- Figure 143. Australia Flip Chip Market Share, By Industry, In USD Billion, 2016-2030F
- Figure 144. Vietnam Flip Chip Market, By Value, In USD Billion, 2016-2030F
- Figure 145. Vietnam Flip Chip Market, By Volume, In Thousand Units, 2016-2030F
- Figure 146. Vietnam Flip Chip Market Share, By Wafer Bumping Technology, In USD Billion, 2016-2030F
- Figure 147. Vietnam Flip Chip Market Share, By Packaging Method, In USD Billion, 2016-2030F
- Figure 148. Vietnam Flip Chip Market Share, By Product, In USD Billion, 2016-2030F
- Figure 149. Vietnam Flip Chip Market Share, By Industry, In USD Billion, 2016-2030F
- Figure 150. South Korea Flip Chip Market, By Value, In USD Billion, 2016-2030F
- Figure 151. South Korea Flip Chip Market, By Volume, In Thousand Units, 2016-2030F
- Figure 152. South Korea Flip Chip Market Share, By Wafer Bumping Technology, In USD Billion, 2016-2030F
- Figure 153. South Korea Flip Chip Market Share, By Packaging Method, In USD Billion, 2016-2030F
- Figure 154. South Korea Flip Chip Market Share, By Product, In USD Billion, 2016-2030F
- Figure 155. South Korea Flip Chip Market Share, By Industry, In USD Billion, 2016-2030F
- Figure 156. Indonesia Flip Chip Market, By Value, In USD Billion, 2016-2030F
- Figure 157. Indonesia Flip Chip Market, By Volume, In Thousand Units, 2016-2030F
- Figure 158. Indonesia Flip Chip Market Share, By Wafer Bumping Technology, In USD Billion, 2016-2030F
- Figure 159. Indonesia Flip Chip Market Share, By Packaging Method, In USD Billion, 2016-2030F
- Figure 160. Indonesia Flip Chip Market Share, By Product, In USD Billion, 2016-2030F
- Figure 161. Indonesia Flip Chip Market Share, By Industry, In USD Billion, 2016-2030F
- Figure 162. Philippines Flip Chip Market, By Value, In USD Billion, 2016-2030F
- Figure 163. Philippines Flip Chip Market, By Volume, In Thousand Units, 2016-2030F
- Figure 164. Philippines Flip Chip Market Share, By Wafer Bumping Technology, In USD Billion, 2016-2030F
- Figure 165. Philippines Flip Chip Market Share, By Packaging Method, In USD Billion, 2016-2030F
- Figure 166. Philippines Flip Chip Market Share, By Product, In USD Billion, 2016-2030F
- Figure 167. Philippines Flip Chip Market Share, By Industry, In USD Billion, 2016-2030F
- Figure 168. Middle East & Africa Flip Chip Market, By Value, In USD Billion, 2016-2030F
- Figure 169. Middle East & Africa Flip Chip Market, By Volume, In Thousand Units, 2016-2030F
- Figure 170. Middle East & Africa Flip Chip Market Share, By Wafer Bumping Technology, In USD Billion, 2016-2030F
- Figure 171. Middle East & Africa Flip Chip Market Share, By Packaging Method, In USD Billion, 2016-2030F
- Figure 172. Middle East & Africa Flip Chip Market Share, By Product, In USD Billion, 2016-2030F
- Figure 173. Middle East & Africa Flip Chip Market Share, By Industry, In USD Billion, 2016-2030F
- Figure 174. Middle East & Africa Flip Chip Market Share, By Country, In USD Billion, 2016-2030F
- Figure 175. Saudi Arabia Flip Chip Market, By Value, In USD Billion, 2016-2030F
- Figure 176. Saudi Arabia Flip Chip Market, By Volume, In Thousand Units, 2016-2030F
- Figure 177. Saudi Arabia Flip Chip Market Share, By Wafer Bumping Technology, In USD Billion, 2016-2030F
- Figure 178. Saudi Arabia Flip Chip Market Share, By Packaging Method, In USD Billion, 2016-2030F
- Figure 179. Saudi Arabia Flip Chip Market Share, By Product, In USD Billion, 2016-2030F
- Figure 180. Saudi Arabia Flip Chip Market Share, By Industry, In USD Billion, 2016-2030F
- Figure 181. UAE Flip Chip Market, By Value, In USD Billion, 2016-2030F
- Figure 182. UAE Flip Chip Market, By Volume, In Thousand Units, 2016-2030F
- Figure 183. UAE Flip Chip Market Share, By Wafer Bumping Technology, In USD Billion, 2016-2030F
- Figure 184. UAE Flip Chip Market Share, By Packaging Method, In USD Billion, 2016-2030F
- Figure 185. UAE Flip Chip Market Share, By Product, In USD Billion, 2016-2030F
- Figure 186. UAE Flip Chip Market Share, By Industry, In USD Billion, 2016-2030F
- Figure 187. South Africa Flip Chip Market, By Value, In USD Billion, 2016-2030F
- Figure 188. South Africa Flip Chip Market, By Volume, In Thousand Units, 2016-2030F
- Figure 189. South Africa Flip Chip Market Share, By Wafer Bumping Technology, In USD Billion, 2016-2030F
- Figure 190. South Africa Flip Chip Market Share, By Packaging Method, In USD Billion, 2016-2030F
- Figure 191. South Africa Flip Chip Market Share, By Product, In USD Billion, 2016-2030F
- Figure 192. South Africa Flip Chip Market Share, By Industry, In USD Billion, 2016-2030F
- Figure 193. By Wafer Bumping Technology Map-Market Size (USD Billion) & Growth Rate (%), 2022
- Figure 194. By Packaging Method Map-Market Size (USD Billion) & Growth Rate (%), 2022
- Figure 195. By Product Map-Market Size (USD Billion) & Growth Rate (%), 2022
- Figure 196. By Industry Map-Market Size (USD Billion) & Growth Rate (%), 2022
- Figure 197. By Region Map-Market Size (USD Billion) & Growth Rate (%), 2022
Global flip chip market has experienced significant growth in recent years and is expected to maintain a strong pace of expansion in the coming years. With projected revenue of approximately USD 28.04 billion in 2022, the market is forecasted to reach a value of USD 48.47 billion by 2030, displaying a robust CAGR of 7.1% from 2023 to 2030.
The flip chip market provides benefits like higher performance, electrical and thermal conductivity, lower power consumption, and smaller form factors. It enables faster and more reliable microelectronics, making it perfect for applications such as enhanced semiconductor packaging, mobile devices, and high-performance computing, promoting innovation and efficiency.
The flip chip market is expanding rapidly owing to rising demand for smaller and more powerful electronic devices such as smartphones and IoT devices. Second, advances in semiconductor technology, such as 5G and AI, fuel demand for high-performance CPUs. Finally, the automotive industry's push toward electrified and self-driving automobiles increases demand for flip chip technology to increase vehicle communication and safety features.
The surge in the electric vehicle sector, as highlighted by the International Energy Agency (IEA), holds substantial implications for the flip chip market. EVs rely on advanced semiconductor technology, including flip chips, for various applications like power management, motor control, and battery management systems. As EV sales continue to rise globally, the demand for compact, high-performance chips, like flip chips, is expected to grow significantly. The trend aligns with the broader automotive sector's move towards electrification, creating a promising outlook for the flip chip market, which plays a vital role in enabling the EV revolution.
For instance, in September 2023, Camtek purchased FormFactor's FRT Metrology business for USD 100 million, bolstering its expertise in high-precision metrology solutions for the Advanced Packaging and Silicon Carbide sectors, solidifying its standing in the semiconductor industry.
5G Revolution to Fuel Flip Chip Market
The proliferation of 5G networks contributes significantly to the growth of the flip chip market. Flip chips are an excellent choice for 5G technology since they require high-performance circuits that can manage higher data throughput and reduced latency. These chips have enhanced electrical and thermal properties, allowing faster data processing and less heat generation. Furthermore, their small size corresponds to the space-saving requirements of 5G infrastructure. As 5G continues to roll out internationally and its applications expand beyond smartphones towards IoT, autonomous vehicles, and industrial automation, the demand for high-performance flip chips will likely skyrocket, propelling market development and innovation.
For example, in November 2022, SET launched the FC150 PLATINUM, an advanced flip-chip bonder with improved precision and alignment accuracy of ± 0.1 µm for telecom, quantum, automotive, defense, HPC, AI, and VR applications.
Innovating Automotive Electronics with Flip Chips
Fueled by advanced driver-assistance systems (ADAS) and electric vehicles (EVs), the flourishing automotive electronics sector is a critical component driving the flip chip market's growth. For tasks such as collision avoidance, adaptive cruise control, and self-parking, ADAS relies on high-performance CPUs, necessitating small and efficient semiconductor solutions. With their complicated battery management systems and onboard computers, EVs require reliable and power efficient semiconductors. Flip chips, noted for their small form factor and improved performance, successfully satisfy these automotive electronics needs. As the automotive sector moves toward electrification and automation, demand for flip chips continues to rise, strengthening the market growth.
For example, in October 2023, Advanced Semiconductor Engineering (ASE) unveiled its Integrated Design Ecosystem (IDE), optimizing package architecture design for the VIPack platform. IDE simplifies SoC to multi-die integration, yielding 50% design efficiency improvements and substantial cycle time reduction. It supports chiplet, memory, and advanced fanout structures in package design.
Dominance of Copper Pillars in the Market
Copper pillars are emerging as a leading segment in the flip chip market, owing to their several advantages, such as great electrical and thermal conductivity, allowing for efficient heat dissipation and fast data transport. Copper's mechanical strength and dependability make it perfect for advanced semiconductor packing, allowing smaller form factors. Furthermore, their compatibility with fine-pitch designs and low-resistance properties aid in performance. As the demand for high-performance, miniaturized electronic devices grows, copper pillars become more popular, fueling their dominance in the flip chip market.
For instance, in March 2023, Jupiter Systems unveiled the Zavus Xtreme Pixel (XP) Flip Chip COB MicroLED, expanding its 21:9 ultra-wide display offerings for enterprise and industrial applications.
Asia-Pacific Dominates Flip Chip Market
Asia-Pacific is at the leading edge of the flip chip market owing to several factors. The region is a global semiconductor manufacturing powerhouse, with important businesses situated in Taiwan, South Korea, and China. Furthermore, Asia-Pacific has a large consumer electronics market, which drives the demand for miniature and high-performance CPUs in products such as smartphones and wearables. The growing adoption of IoT and proliferation of 5G technology in the region has increased the demand for superior flip chip technology. Hence, Asia-Pacific leads the global flip chip market due to its manufacturing capabilities and robust demand.
For instance, in June 2022, Luminus Devices introduced the MP-3030-110F flip-chip LEDs, which offer high efficacy, brightness, and durability. These wire-bond-free LEDs were ideal for horticulture and outdoor lighting, with improved sulfur resistance and a long life exceeding 50,000 hours.
Government Initiatives Acting as Catalyst to Flip Chip Market
The United States government, through the National Institute of Standards and Technology (NIST), is launching a substantial initiative to strengthen the domestic semiconductor sector, including the flip chip market. Under the CHIPS Incentives Program, especially the 2023-NIST-CHIPS-CFF-01 funding opportunity, the program is designed to enhance the United States' economic and national security. It is inviting applications for the construction, expansion, or modernization of semiconductor manufacturing facilities, encompassing those related to flip chip technology. Notably, the program strongly encourages projects with capital investments exceeding USD 300 million, emphasizing the government's commitment to fortify semiconductor infrastructure and maintain global tech competitiveness.
Impact of COVID-19
The flip chip market experienced a dual-phase impact from the COVID-19 pandemic. In the initial stages, supply chain disruptions, reduced consumer demand, and labor shortages led to manufacturing and production setbacks. However, the post-pandemic scenario saw a resurgence in the global flip chip market. With increased reliance on remote work technology, healthcare equipment, consumer electronics, and substantial investments in 5G infrastructure, the market has rebounded. Industry players adapted to the new normal, and the significance of high-performance and compact chips in various applications fueled the market's strong recovery, underscoring the resilience of the semiconductor sector.
Future Market Scenario (2024 - 2030F)
Advancements in materials, such as low-temperature solder and high-performance underfill substances, are poised to elevate the flip chip process.
The continuous growth of 5G infrastructure and the rising adoption of artificial intelligence are set to boost the need for high-performance flip chips in data centers, edge computing, and the telecommunications sector.
The expansion of the Internet of Things (IoT) is expected to persist, generating prospects for the utilization of flip chips in smart devices, wearables, and sensor applications.
There will be a growing focus on energy-efficient flip chips in the market, especially for devices that rely on battery or renewable energy sources.
Key Players Landscape and Outlook
The global flip chip market exhibits vigorous activity and fierce competition, driven by major industry players such as IBM Corporation, ASE Technology Holding Co., Ltd, Intel Corporation, Samsung Electronics Co., Ltd, and Taiwan Semiconductor Manufacturing Company Limited, dedicated to push the boundaries of innovation. Key market dynamics encompass a relentless pursuit of size reduction, the growing significance of 5G and AI technologies, and the expanding role of automotive electronics. This competitive landscape underscores a future characterized by advanced materials, heterogeneous integration, and enhanced energy efficiency, catering to a wide array of sectors. With the ever-increasing demand for compact, high-performance devices, the market's outlook remains highly promising.
In May 2023, FormFactor introduce the FRT MicroProf PT, a semiconductor metrology and inspection tool designed for larger rectangular panels, offering automation and hybrid metrology for 3D measurements and defect detection.
In September 2023, GlobalFoundries inaugurated a USD 4 billion expansion fabrication facility in Singapore, generating 1,000 high-value positions, predominantly focused on technicians and engineers. The facility's objective is to improve supply chain adaptability.
Table of Contents
1. Research Methodology
2. Project Scope & Definitions
3. Impact of COVID-19 on the Global Flip Chip Market
4. Executive Summary
5. Voice of Customer
- 5.1. Product and Market Intelligence
- 5.2. Mode of Brand Awareness
- 5.3. Factors Considered in Purchase Decisions
- 5.3.1. Features and other value-added service
- 5.3.2. IT Infrastructure Compatibility
- 5.3.3. Efficiency of Solutions
- 5.3.4. After-Sales Support
- 5.4. Consideration of Privacy & Safety Regulations
6. Global Flip Chip Market Outlook, 2016-2030F
- 6.1. Market Size & Forecast
- 6.1.1. By Value
- 6.1.2. By Volume
- 6.2. By Wafer Bumping Technology
- 6.2.1. Copper Pillar
- 6.2.2. Lead-free
- 6.2.3. Tin/Lead Eutectic Solder
- 6.2.4. Gold Stud+ Plated Solder
- 6.3. By Packaging Method
- 6.3.1. 2D IC
- 6.3.2. 2.5D IC
- 6.3.3. 3D IC
- 6.4. By Product
- 6.4.1. Memory
- 6.4.2. Light Emitting Diode
- 6.4.3. CMOS Image Sensor
- 6.4.4. SoC
- 6.4.5. GPU
- 6.4.6. CPU
- 6.5. By Industry
- 6.5.1. IT & Telecommunication
- 6.5.2. Industrial
- 6.5.3. Electronic
- 6.5.4. Automotive
- 6.5.5. Healthcare
- 6.5.6. Aerospace & Defense
- 6.5.7. Others
- 6.6. By Region
- 6.6.1. North America
- 6.6.2. Europe
- 6.6.3. Asia-Pacific
- 6.6.4. South America
- 6.6.5. Middle East and Africa
- 6.7. By Company Market Share (%), 2022
7. Global Flip Chip Market Outlook, By Region, 2016-2030F
- 7.1. North America*
- 7.1.1. Market Size & Forecast
- 7.1.1.1. By Value
- 7.1.1.2. By Volume
- 7.1.2. By Wafer Bumping Technology
- 7.1.2.1. Copper Pillar
- 7.1.2.2. Lead-free
- 7.1.2.3. Tin/Lead Eutectic Solder
- 7.1.2.4. Gold Stud+ Plated Solder
- 7.1.3. By Packaging Method
- 7.1.3.1. 2D IC
- 7.1.3.2. 2.5D IC
- 7.1.3.3. 3D IC
- 7.1.4. By Product
- 7.1.4.1. Memory
- 7.1.4.2. Light Emitting Diode
- 7.1.4.3. CMOS Image Sensor
- 7.1.4.4. SoC
- 7.1.4.5. GPU
- 7.1.4.6. CPU
- 7.1.5. By Industry
- 7.1.5.1. IT & Telecommunication
- 7.1.5.2. Industrial
- 7.1.5.3. Electronic
- 7.1.5.4. Automotive
- 7.1.5.5. Healthcare
- 7.1.5.6. Aerospace & Defense
- 7.1.5.7. Others
- 7.1.6. United States*
- 7.1.6.1. Market Size & Forecast
- 7.1.6.1.1. By Value
- 7.1.6.1.2. By Volume
- 7.1.6.2. By Wafer Bumping Technology
- 7.1.6.2.1. Copper Pillar
- 7.1.6.2.2. Lead-free
- 7.1.6.2.3. Tin/Lead Eutectic Solder
- 7.1.6.2.4. Gold Stud+ Plated Solder
- 7.1.6.3. By Packaging Method
- 7.1.6.3.1. 2D IC
- 7.1.6.3.2. 2.5D IC
- 7.1.6.3.3. 3D IC
- 7.1.6.4. By Product
- 7.1.6.4.1. Memory
- 7.1.6.4.2. Light Emitting Diode
- 7.1.6.4.3. CMOS Image Sensor
- 7.1.6.4.4. SoC
- 7.1.6.4.5. GPU
- 7.1.6.4.6. CPU
- 7.1.6.5. By Industry
- 7.1.6.5.1. IT & Telecommunication
- 7.1.6.5.2. Industrial
- 7.1.6.5.3. Electronic
- 7.1.6.5.4. Automotive
- 7.1.6.5.5. Healthcare
- 7.1.6.5.6. Aerospace & Defense
- 7.1.6.5.7. Others
- 7.1.7. Canada
- 7.1.8. Mexico
- 7.1.1. Market Size & Forecast
All segments will be provided for all regions and countries covered:
- 7.2. Europe
- 7.2.1. Germany
- 7.2.2. France
- 7.2.3. Italy
- 7.2.4. United Kingdom
- 7.2.5. Russia
- 7.2.6. Netherlands
- 7.2.7. Spain
- 7.2.8. Turkey
- 7.2.9. Poland
- 7.3. Asia-Pacific
- 7.3.1. India
- 7.3.2. China
- 7.3.3. Japan
- 7.3.4. Australia
- 7.3.5. Vietnam
- 7.3.6. South Korea
- 7.3.7. Indonesia
- 7.3.8. Philippines
- 7.4. South America
- 7.4.1. Brazil
- 7.4.2. Argentina
- 7.5. Middle East & Africa
- 7.5.1. Saudi Arabia
- 7.5.2. UAE
- 7.5.3. South Africa
8. Market Mapping, 2022
- 8.1. By Wafer Bumping Technology
- 8.2. By Packaging Method
- 8.3. By Product
- 8.4. By Industry
- 8.5. By Region
9. Macro Environment and Industry Structure
- 9.1. Demand Supply Analysis
- 9.2. Import Export Analysis
- 9.3. Value Chain Analysis
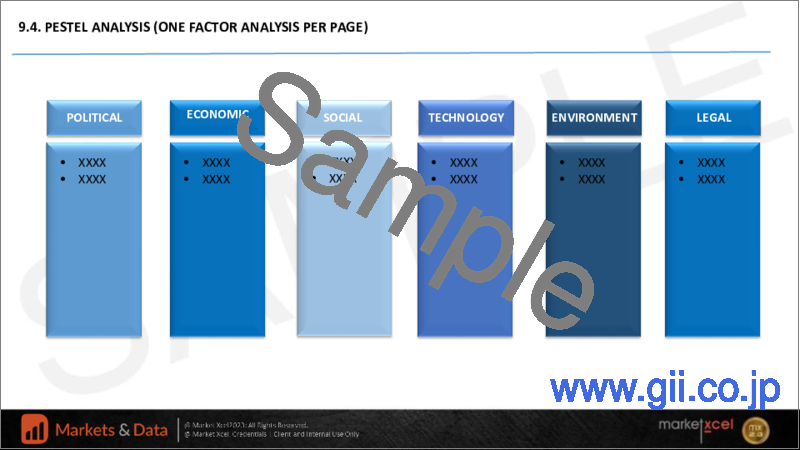
- 9.4. PESTEL Analysis
- 9.4.1. Political Factors
- 9.4.2. Economic System
- 9.4.3. Social Implications
- 9.4.4. Technological Advancements
- 9.4.5. Environmental Impacts
- 9.4.6. Legal Compliances and Regulatory Policies (Statutory Bodies Included)
- 9.5. Porter's Five Forces Analysis
- 9.5.1. Supplier Power
- 9.5.2. Buyer Power
- 9.5.3. Substitution Threat
- 9.5.4. Threat from New Entrant
- 9.5.5. Competitive Rivalry
10. Market Dynamics
- 10.1. Growth Drivers
- 10.2. Growth Inhibitors (Challenges and Restraints)
11. Key Players Landscape
- 11.1. Competition Matrix of Top Five Market Leaders
- 11.2. Market Revenue Analysis of Top Five Market Leaders (in %, 2022)
- 11.3. Mergers and Acquisitions/Joint Ventures (If Applicable)
- 11.4. SWOT Analysis (For Five Market Players)
- 11.5. Patent Analysis (If Applicable)
12. Case Studies
13. Key Players Outlook
- 13.1. Amkor Technology, Inc.
- 13.1.1. Company Details
- 13.1.2. Key Management Personnel
- 13.1.3. Products & Services
- 13.1.4. Financials (As reported)
- 13.1.5. Key Market Focus & Geographical Presence
- 13.1.6. Recent Developments
- 13.2. ASE Technology Holding Co, Ltd
- 13.3. FormFactor, Inc.
- 13.4. Globalfoundries Inc.
- 13.5. IBM Corporation
- 13.6. Intel Corporation
- 13.7. Samsung Electronics Co., Ltd.
- 13.8. Taiwan Semiconductor Manufacturing Company Limited
- 13.9. Texas Instruments Incorporated
- 13.10. United Microelectronics Corporation
Companies mentioned above DO NOT hold any order as per market share and can be changed as per information available during research work.
