|
|
市場調査レポート
商品コード
1347135
水中ホテルの世界市場の評価:場所別、宿泊タイプ別、設計別、ターゲットオーディエンス別、パッケージ別、地域別、機会、予測(2016年~2030年)Underwater Hotels Market Assessment, By Location, By Type of Accommodation, By Design, By Target Audience, By Package, By Region, Opportunities, and Forecast, 2016-2030F |
||||||
|
|
|||||||
カスタマイズ可能
|
|||||||


| 水中ホテルの世界市場の評価:場所別、宿泊タイプ別、設計別、ターゲットオーディエンス別、パッケージ別、地域別、機会、予測(2016年~2030年) |
|
出版日: 2023年09月12日
発行: Markets & Data
ページ情報: 英文 136 Pages
納期: 3~5営業日
|

- 全表示
- 概要
- 図表
- 目次
水中ホテル市場は、広範なホスピタリティ産業の中で、革新的で魅惑的なニッチとして台頭してきました。その市場規模は、技術の進歩、建築上の創意工夫、独特な旅行体験への欲求によって牽引され、2022年の27億5,000万米ドルから2030年までに85億9,000万米ドルに達し、予測期間中にCAGRで15.3%の成長が予測されています。
市場の成長可能性は、海中での特別な滞在にプレミアムを支払うことを望む富裕層や高級旅行者に対応する能力によって強く示されています。しかし、水中構造物の建設には資本集約的な性質があり、ロジスティクス上の課題や規制当局の承認が、潜在的な開発者にとって参入障壁となる可能性があります。
水中ホテルの中には、水上のスイートと水中のラウンジやレストランを組み合わせ、より幅広い顧客層にアピールするため、部分的に水中の宿泊施設を提供しているところもあります。水中ホテルのコンセプトは魅力的ですが、経済情勢、環境維持への懸念、シームレスで安全な宿泊体験を提供する能力など、市場見通しを左右する要因はいくつかあります。旅行産業とホスピタリティ産業が進化するにつれ、市場の軌跡は、技術の進歩、消費者の選好の変化、産業の持続可能な慣行への取り組みに左右される可能性が高いです。
高級志向の旅行者が主なターゲットオーディエンスとなっています
市場の成長を促進する上で、高級感と独占性は極めて重要な役割を果たしています。希少で豪奢な体験の魅力は、他では味わえない贅沢を求めている富裕層や目の肥えた旅行者を引きつけます。こうした客は、水中宿泊施設での滞在に割高な料金を支払うことを厭わず、開発者にとって有利な収益源を育むことになります。水中ホテルは独占的な存在であるため、宿泊客に威信と社会的差異を与え、その望ましさを高めています。その結果、豪華さと排他性がニッチな顧客を引き付け、メディアの注目、口コミマーケティングに寄与し、これらのホテルが卓越したホスピタリティの象徴的なシンボルとして確立されます。独占性と市場成長のシナジーは、水中ホテルが従来の宿泊施設を超越し、特別な滞在を求める人々に非日常的な逃避を提供するという概念を強化します。
メディア・マーケティングバリューが市場成長に寄与
メディア・マーケティングバリューは、市場の成長を促進する上で重要な役割を果たします。これらのユニークで視覚的に魅惑的な宿泊施設は、メディアの注目を集め、広く報道され、話題となります。このような知名度の向上は、潜在的な宿泊客の興味を引き、水中ホテルをエキゾチックで魅力的な旅行先として位置づけます。このように、メディアへの露出と戦略的なマーケティング活動が、多くの旅行者の共感を呼ぶ不思議と冒険の感覚を生み出すことで、市場の拡大に大きく貢献しています。
世界の観光客の伸びが市場に影響
世界の観光産業の成長は、市場の拡大に直接的かつ大きな影響を与えています。より多くの人々が旅行に参加し、斬新で忘れられない体験を求めるようになり、水中ホテルのようなニッチなサービスが脚光を浴びるようになっています。国際旅行の増加や新しい旅行先の開拓は、ユニークな宿泊施設に興味を持つ多様で冒険的な顧客層を生み出しています。さらに、旅行情報の入手性の向上と予約の簡単さが、こうした体験をより幅広い旅行者が楽しめるようにしています。その結果、世界の観光客の増加傾向は市場を強化し、水中ホテルをニッチなコンセプトから旅行者のバケットリストの人気の要素へと変えています。
当レポートでは、世界の水中ホテル市場について調査分析し、市場規模と予測、市場力学、主要企業の情勢と見通しなどを提供しています。
目次
第1章 調査手法
第2章 プロジェクトの範囲と定義
第3章 水中ホテル市場に対するCOVID-19の影響
第4章 エグゼクティブサマリー
第5章 顧客の声
- 人口統計(年齢/コホート分析 - 団塊の世代とX世代、ミレニアル世代、Z世代、性別、所得 - 低、中、高、地域、国籍など)
- 市場の認知度とホテル情報
- ホテルの認知度とロイヤルティ
- 予約の決定において考慮される要素
- アクセシビリティ
- 予約の利用可用性
- 予約媒体
- レビューと評判
第6章 水中ホテル市場の見通し(2016年~2030年)
- 市場規模と予測
- 金額
- 場所別
- 沿岸地域
- 外洋
- 宿泊タイプ別
- 水中スイート
- 水中ヴィラ
- 水中ポッド/カプセル
- 設計別
- 部分的水没
- 完全水没
- ターゲットオーディエンス別
- 贅沢な旅行者
- 冒険家
- パッケージ別
- 企業リトリート
- 結婚式と新婚旅行のパッケージ
- オールインクルーシブの滞在
- その他
- 地域別
- 北米
- 欧州
- 南米
- アジア太平洋
- 中東・アフリカ
- 市場シェア:企業別(2022年)
第7章 水中ホテル市場の見通し:地域別(2016年~2030年)
- 北米
- 市場規模と予測
- 場所別
- 宿泊タイプ別
- 設計別
- ターゲットオーディエンス別
- パッケージ別
- 米国
- カナダ
- メキシコ
- 欧州
- ドイツ
- フランス
- イタリア
- 英国
- ロシア
- オランダ
- スペイン
- トルコ
- ポーランド
- 南米
- ブラジル
- アルゼンチン
- アジア太平洋
- インド
- 中国
- 日本
- オーストラリア
- ベトナム
- 韓国
- インドネシア
- フィリピン
- 中東・アフリカ
- アラブ首長国連邦
- サウジアラビア
- 南アフリカ
第8章 市場マッピング(2022年)
- 場所別
- 宿泊タイプ別
- 設計別
- ターゲットオーディエンス別
- パッケージ別
- 地域別
第9章 マクロ環境と産業構造
- 需給分析
- バリューチェーン分析
- PESTEL分析
- ポーターのファイブフォース分析
第10章 市場力学
- 成長促進要因
- 成長抑制要因(課題、抑制要因)
第11章 主要企業の情勢
- マーケットリーダー上位5社の競合マトリクス
- マーケットリーダー上位5社市場の収益分析(2022年)
- 合併と買収/合弁事業(該当する場合)
- SWOT分析(市場参入企業5社向け)
- 特許分析(該当する場合)
第12章 価格分析
第13章 ケーススタディ
第14章 主要企業の見通し
- The Manta Resort
- Conrad Hilton (Conrad Maldives Rangali Island)
- Atlantis, The Palm
- Utter Inn
- InterContinental Shanghai Wonderland
- The Poseidon Underwater Resort
- Reefsuites, Whitsunday Islands
- Jules' Undersea Lodge
- Water Discus Hotel
- Niyama Private Islands
第15章 戦略的推奨事項
第16章 当社について、免責事項
List of Tables
- Table 1. Pricing Analysis of Products from Key Players
- Table 2. Competition Matrix of Top 5 Market Leaders
- Table 3. Mergers & Acquisitions/ Joint Ventures (If Applicable)
- Table 4. About Us - Regions and Countries Where We Have Executed Client Projects
List of Figures
- Figure 1. Global Underwater Hotel Market, By Value, In USD Billion, 2016-2030F
- Figure 2. Global Underwater Hotel Market Share, By Location, In USD Billion, 2016-2030F
- Figure 3. Global Underwater Hotel Market Share, By Type of Accommodation, In USD Billion, 2016-2030F
- Figure 4. Global Underwater Hotel Market Share, By Design, In USD Billion, 2016-2030F
- Figure 5. Global Underwater Hotel Market Share, By Target Audience, In USD Billion, 2016-2030F
- Figure 6. Global Underwater Hotel Market Share, By Package, In USD Billion, 2016-2030F
- Figure 7. Global Underwater Hotel Market Share, By Region, In USD Billion, 2016-2030F
- Figure 8. North America Underwater Hotel Market, By Value, In USD Billion, 2016-2030F
- Figure 9. North America Underwater Hotel Market Share, By Location, In USD Billion, 2016-2030F
- Figure 10. North America Underwater Hotel Market Share, By Type of Accommodation, In USD Billion, 2016-2030F
- Figure 11. North America Underwater Hotel Market Share, By Design, In USD Billion, 2016-2030F
- Figure 12. North America Underwater Hotel Market Share, By Target Audience, In USD Billion, 2016-2030F
- Figure 13. North America Underwater Hotel Market Share, By Package, In USD Billion, 2016-2030F
- Figure 14. North America Underwater Hotel Market Share, By Country, In USD Billion, 2016-2030F
- Figure 15. United States Underwater Hotel Market, By Value, In USD Billion, 2016-2030F
- Figure 16. United States Underwater Hotel Market Share, By Location, In USD Billion, 2016-2030F
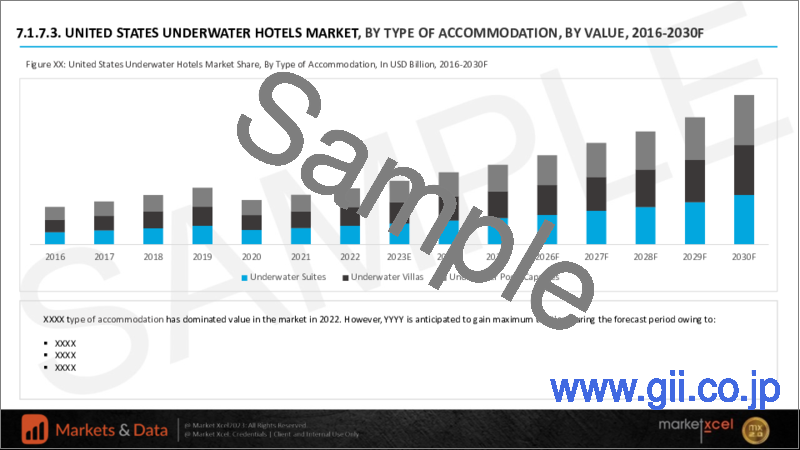
- Figure 17. United States Underwater Hotel Market Share, By Type of Accommodation, In USD Billion, 2016-2030F
- Figure 18. United States Underwater Hotel Market Share, By Design, In USD Billion, 2016-2030F
- Figure 19. United States Underwater Hotel Market Share, By Target Audience, In USD Billion, 2016-2030F
- Figure 20. United States Underwater Hotel Market Share, By Package, In USD Billion, 2016-2030F
- Figure 21. Canada Underwater Hotel Market, By Value, In USD Billion, 2016-2030F
- Figure 22. Canada Underwater Hotel Market Share, By Location, In USD Billion, 2016-2030F
- Figure 23. Canada Underwater Hotel Market Share, By Type of Accommodation, In USD Billion, 2016-2030F
- Figure 24. Canada Underwater Hotel Market Share, By Design, In USD Billion, 2016-2030F
- Figure 25. Canada Underwater Hotel Market Share, By Target Audience, In USD Billion, 2016-2030F
- Figure 26. Canada Underwater Hotel Market Share, By Package, In USD Billion, 2016-2030F
- Figure 27. Mexico Underwater Hotel Market, By Value, In USD Billion, 2016-2030F
- Figure 28. Mexico Underwater Hotel Market Share, By Location, In USD Billion, 2016-2030F
- Figure 29. Mexico Underwater Hotel Market Share, By Type of Accommodation, In USD Billion, 2016-2030F
- Figure 30. Mexico Underwater Hotel Market Share, By Design, In USD Billion, 2016-2030F
- Figure 31. Mexico Underwater Hotel Market Share, By Target Audience, In USD Billion, 2016-2030F
- Figure 32. Mexico Underwater Hotel Market Share, By Package, In USD Billion, 2016-2030F
- Figure 33. Europe Underwater Hotel Market, By Value, In USD Billion, 2016-2030F
- Figure 34. Europe Underwater Hotel Market Share, By Location, In USD Billion, 2016-2030F
- Figure 35. Europe Underwater Hotel Market Share, By Type of Accommodation, In USD Billion, 2016-2030F
- Figure 36. Europe Underwater Hotel Market Share, By Design, In USD Billion, 2016-2030F
- Figure 37. Europe Underwater Hotel Market Share, By Target Audience, In USD Billion, 2016-2030F
- Figure 38. Europe Underwater Hotel Market Share, By Package, In USD Billion, 2016-2030F
- Figure 39. Europe Underwater Hotel Market Share, By Country, In USD Billion, 2016-2030F
- Figure 40. Germany Underwater Hotel Market, By Value, In USD Billion, 2016-2030F
- Figure 41. Germany Underwater Hotel Market Share, By Location, In USD Billion, 2016-2030F
- Figure 42. Germany Underwater Hotel Market Share, By Type of Accommodation, In USD Billion, 2016-2030F
- Figure 43. Germany Underwater Hotel Market Share, By Design, In USD Billion, 2016-2030F
- Figure 44. Germany Underwater Hotel Market Share, By Target Audience, In USD Billion, 2016-2030F
- Figure 45. Germany Underwater Hotel Market Share, By Package, In USD Billion, 2016-2030F
- Figure 46. France Underwater Hotel Market, By Value, In USD Billion, 2016-2030F
- Figure 47. France Underwater Hotel Market Share, By Location, In USD Billion, 2016-2030F
- Figure 48. France Underwater Hotel Market Share, By Type of Accommodation, In USD Billion, 2016-2030F
- Figure 49. France Underwater Hotel Market Share, By Design, In USD Billion, 2016-2030F
- Figure 50. France Underwater Hotel Market Share, By Target Audience, In USD Billion, 2016-2030F
- Figure 51. France Underwater Hotel Market Share, By Package, In USD Billion, 2016-2030F
- Figure 52. Italy Underwater Hotel Market, By Value, In USD Billion, 2016-2030F
- Figure 53. Italy Underwater Hotel Market Share, By Location, In USD Billion, 2016-2030F
- Figure 54. Italy Underwater Hotel Market Share, By Type of Accommodation, In USD Billion, 2016-2030F
- Figure 55. Italy Underwater Hotel Market Share, By Design, In USD Billion, 2016-2030F
- Figure 56. Italy Underwater Hotel Market Share, By Target Audience, In USD Billion, 2016-2030F
- Figure 57. Italy Underwater Hotel Market Share, By Package, In USD Billion, 2016-2030F
- Figure 58. United Kingdom Underwater Hotel Market, By Value, In USD Billion, 2016-2030F
- Figure 59. United Kingdom Underwater Hotel Market Share, By Location, In USD Billion, 2016-2030F
- Figure 60. United Kingdom Underwater Hotel Market Share, By Type of Accommodation, In USD Billion, 2016-2030F
- Figure 61. United Kingdom Underwater Hotel Market Share, By Design, In USD Billion, 2016-2030F
- Figure 62. United Kingdom Underwater Hotel Market Share, By Target Audience, In USD Billion, 2016-2030F
- Figure 63. United Kingdom Underwater Hotel Market Share, By Package, In USD Billion, 2016-2030F
- Figure 64. Russia Underwater Hotel Market, By Value, In USD Billion, 2016-2030F
- Figure 65. Russia Underwater Hotel Market Share, By Location, In USD Billion, 2016-2030F
- Figure 66. Russia Underwater Hotel Market Share, By Type of Accommodation, In USD Billion, 2016-2030F
- Figure 67. Russia Underwater Hotel Market Share, By Design, In USD Billion, 2016-2030F
- Figure 68. Russia Underwater Hotel Market Share, By Target Audience, In USD Billion, 2016-2030F
- Figure 69. Russia Underwater Hotel Market Share, By Package, In USD Billion, 2016-2030F
- Figure 70. Netherlands Underwater Hotel Market, By Value, In USD Billion, 2016-2030F
- Figure 71. Netherlands Underwater Hotel Market Share, By Location, In USD Billion, 2016-2030F
- Figure 72. Netherlands Underwater Hotel Market Share, By Type of Accommodation, In USD Billion, 2016-2030F
- Figure 73. Netherlands Underwater Hotel Market Share, By Design, In USD Billion, 2016-2030F
- Figure 74. Netherlands Underwater Hotel Market Share, By Target Audience, In USD Billion, 2016-2030F
- Figure 75. Netherlands Underwater Hotel Market Share, By Package, In USD Billion, 2016-2030F
- Figure 76. Spain Underwater Hotel Market, By Value, In USD Billion, 2016-2030F
- Figure 77. Spain Underwater Hotel Market Share, By Location, In USD Billion, 2016-2030F
- Figure 78. Spain Underwater Hotel Market Share, By Type of Accommodation, In USD Billion, 2016-2030F
- Figure 79. Spain Underwater Hotel Market Share, By Design, In USD Billion, 2016-2030F
- Figure 80. Spain Underwater Hotel Market Share, By Target Audience, In USD Billion, 2016-2030F
- Figure 81. Spain Underwater Hotel Market Share, By Package, In USD Billion, 2016-2030F
- Figure 82. Turkey Underwater Hotel Market, By Value, In USD Billion, 2016-2030F
- Figure 83. Turkey Underwater Hotel Market Share, By Location, In USD Billion, 2016-2030F
- Figure 84. Turkey Underwater Hotel Market Share, By Type of Accommodation, In USD Billion, 2016-2030F
- Figure 85. Turkey Underwater Hotel Market Share, By Design, In USD Billion, 2016-2030F
- Figure 86. Turkey Underwater Hotel Market Share, By Target Audience, In USD Billion, 2016-2030F
- Figure 87. Turkey Underwater Hotel Market Share, By Package, In USD Billion, 2016-2030F
- Figure 88. Poland Underwater Hotel Market, By Value, In USD Billion, 2016-2030F
- Figure 89. Poland Underwater Hotel Market Share, By Location, In USD Billion, 2016-2030F
- Figure 90. Poland Underwater Hotel Market Share, By Type of Accommodation, In USD Billion, 2016-2030F
- Figure 91. Poland Underwater Hotel Market Share, By Design, In USD Billion, 2016-2030F
- Figure 92. Poland Underwater Hotel Market Share, By Target Audience, In USD Billion, 2016-2030F
- Figure 93. Poland Underwater Hotel Market Share, By Package, In USD Billion, 2016-2030F
- Figure 94. South America Underwater Hotel Market, By Value, In USD Billion, 2016-2030F
- Figure 95. South America Underwater Hotel Market Share, By Location, In USD Billion, 2016-2030F
- Figure 96. South America Underwater Hotel Market Share, By Type of Accommodation, In USD Billion, 2016-2030F
- Figure 97. South America Underwater Hotel Market Share, By Design, In USD Billion, 2016-2030F
- Figure 98. South America Underwater Hotel Market Share, By Target Audience, In USD Billion, 2016-2030F
- Figure 99. South America Underwater Hotel Market Share, By Package, In USD Billion, 2016-2030F
- Figure 100. South America Underwater Hotel Market Share, By Country, In USD Billion, 2016-2030F
- Figure 101. Brazil Underwater Hotel Market, By Value, In USD Billion, 2016-2030F
- Figure 102. Brazil Underwater Hotel Market Share, By Location, In USD Billion, 2016-2030F
- Figure 103. Brazil Underwater Hotel Market Share, By Type of Accommodation, In USD Billion, 2016-2030F
- Figure 104. Brazil Underwater Hotel Market Share, By Design, In USD Billion, 2016-2030F
- Figure 105. Brazil Underwater Hotel Market Share, By Target Audience, In USD Billion, 2016-2030F
- Figure 106. Brazil Underwater Hotel Market Share, By Package, In USD Billion, 2016-2030F
- Figure 107. Argentina Underwater Hotel Market, By Value, In USD Billion, 2016-2030F
- Figure 108. Argentina Underwater Hotel Market Share, By Location, In USD Billion, 2016-2030F
- Figure 109. Argentina Underwater Hotel Market Share, By Type of Accommodation, In USD Billion, 2016-2030F
- Figure 110. Argentina Underwater Hotel Market Share, By Design, In USD Billion, 2016-2030F
- Figure 111. Argentina Underwater Hotel Market Share, By Target Audience, In USD Billion, 2016-2030F
- Figure 112. Argentina Underwater Hotel Market Share, By Package, In USD Billion, 2016-2030F
- Figure 113. Asia-Pacific Underwater Hotel Market, By Value, In USD Billion, 2016-2030F
- Figure 114. Asia-Pacific Underwater Hotel Market Share, By Location, In USD Billion, 2016-2030F
- Figure 115. Asia-Pacific Underwater Hotel Market Share, By Type of Accommodation, In USD Billion, 2016-2030F
- Figure 116. Asia-Pacific Underwater Hotel Market Share, By Design, In USD Billion, 2016-2030F
- Figure 117. Asia-Pacific Underwater Hotel Market Share, By Target Audience, In USD Billion, 2016-2030F
- Figure 118. Asia- Pacific Cream Market Share, By Package, In USD Billion, 2016-2030F
- Figure 119. Asia-Pacific Underwater Hotel Market Share, By Country, In USD Billion, 2016-2030F
- Figure 120. India Underwater Hotel Market, By Value, In USD Billion, 2016-2030F
- Figure 121. India Underwater Hotel Market Share, By Location, In USD Billion, 2016-2030F
- Figure 122. India Underwater Hotel Market Share, By Type of Accommodation, In USD Billion, 2016-2030F
- Figure 123. India Underwater Hotel Market Share, By Design, In USD Billion, 2016-2030F
- Figure 124. India Underwater Hotel Market Share, By Target Audience, In USD Billion, 2016-2030F
- Figure 125. India Underwater Hotel Market Share, By Package, In USD Billion, 2016-2030F
- Figure 126. China Underwater Hotel Market, By Value, In USD Billion, 2016-2030F
- Figure 127. China Underwater Hotel Market Share, By Location, In USD Billion, 2016-2030F
- Figure 128. China Underwater Hotel Market Share, By Type of Accommodation, In USD Billion, 2016-2030F
- Figure 129. China Underwater Hotel Market Share, By Design, In USD Billion, 2016-2030F
- Figure 130. China Underwater Hotel Market Share, By Target Audience, In USD Billion, 2016-2030F
- Figure 131. China Underwater Hotel Market Share, By Package, In USD Billion, 2016-2030F
- Figure 132. Japan Underwater Hotel Market, By Value, In USD Billion, 2016-2030F
- Figure 133. Japan Underwater Hotel Market Share, By Location, In USD Billion, 2016-2030F
- Figure 134. Japan Underwater Hotel Market Share, By Type of Accommodation, In USD Billion, 2016-2030F
- Figure 135. Japan Underwater Hotel Market Share, By Design, In USD Billion, 2016-2030F
- Figure 136. Japan Underwater Hotel Market Share, By Target Audience, In USD Billion, 2016-2030F
- Figure 137. Japan Underwater Hotel Market Share, By Package, In USD Billion, 2016-2030F
- Figure 138. Australia Underwater Hotel Market, By Value, In USD Billion, 2016-2030F
- Figure 139. Australia Underwater Hotel Market Share, By Location, In USD Billion, 2016-2030F
- Figure 140. Australia Underwater Hotel Market Share, By Type of Accommodation, In USD Billion, 2016-2030F
- Figure 141. Australia Underwater Hotel Market Share, By Design, In USD Billion, 2016-2030F
- Figure 142. Australia Underwater Hotel Market Share, By Target Audience, In USD Billion, 2016-2030F
- Figure 143. Australia Underwater Hotel Market Share, By Package, In USD Billion, 2016-2030F
- Figure 144. Vietnam Underwater Hotel Market, By Value, In USD Billion, 2016-2030F
- Figure 145. Vietnam Underwater Hotel Market Share, By Location, In USD Billion, 2016-2030F
- Figure 146. Vietnam Underwater Hotel Market Share, By Type of Accommodation, In USD Billion, 2016-2030F
- Figure 147. Vietnam Underwater Hotel Market Share, By Design, In USD Billion, 2016-2030F
- Figure 148. Vietnam Underwater Hotel Market Share, By Target Audience, In USD Billion, 2016-2030F
- Figure 149. Vietnam Underwater Hotel Market Share, By Package, In USD Billion, 2016-2030F
- Figure 150. South Korea Underwater Hotel Market, By Value, In USD Billion, 2016-2030F
- Figure 151. South Korea Underwater Hotel Market Share, By Location, In USD Billion, 2016-2030F
- Figure 152. South Korea Underwater Hotel Market Share, By Type of Accommodation, In USD Billion, 2016-2030F
- Figure 153. South Korea Underwater Hotel Market Share, By Design, In USD Billion, 2016-2030F
- Figure 154. South Korea Underwater Hotel Market Share, By Target Audience, In USD Billion, 2016-2030F
- Figure 155. South Korea Underwater Hotel Market Share, By Package, In USD Billion, 2016-2030F
- Figure 156. Indonesia Underwater Hotel Market, By Value, In USD Billion, 2016-2030F
- Figure 157. Indonesia Underwater Hotel Market Share, By Location, In USD Billion, 2016-2030F
- Figure 158. Indonesia Underwater Hotel Market Share, By Type of Accommodation, In USD Billion, 2016-2030F
- Figure 159. Indonesia Underwater Hotel Market Share, By Design, In USD Billion, 2016-2030F
- Figure 160. Indonesia Underwater Hotel Market Share, By Target Audience, In USD Billion, 2016-2030F
- Figure 161. Indonesia Underwater Hotel Market Share, By Package, In USD Billion, 2016-2030F
- Figure 162. Philippines Underwater Hotel Market, By Value, In USD Billion, 2016-2030F
- Figure 163. Philippines Underwater Hotel Market Share, By Location, In USD Billion, 2016-2030F
- Figure 164. Philippines Underwater Hotel Market Share, By Type of Accommodation, In USD Billion, 2016-2030F
- Figure 165. Philippines Underwater Hotel Market Share, By Design, In USD Billion, 2016-2030F
- Figure 166. Philippines Underwater Hotel Market Share, By Target Audience, In USD Billion, 2016-2030F
- Figure 167. Philippines Underwater Hotel Market Share, By Package, In USD Billion, 2016-2030F
- Figure 168. Middle East & Africa Underwater Hotel Market, By Value, In USD Billion, 2016-2030F
- Figure 169. Middle East & Africa Underwater Hotel Market Share, By Location, In USD Billion, 2016-2030F
- Figure 170. Middle East & Africa Underwater Hotel Market Share, By Type of Accommodation, In USD Billion, 2016-2030F
- Figure 171. Middle East & Africa Underwater Hotel Market Share, By Design, In USD Billion, 2016-2030F
- Figure 172. Middle East & Africa Underwater Hotel Market Share, By Target Audience, In USD Billion, 2016-2030F
- Figure 173. Middle East & Africa Underwater Hotel Market Share, By Package, In USD Billion, 2016-2030F
- Figure 174. Middle East & Africa Underwater Hotel Market Share, By Country, In USD Billion, 2016-2030F
- Figure 175. Saudi Arabia Underwater Hotel Market, By Value, In USD Billion, 2016-2030F
- Figure 176. Saudi Arabia Underwater Hotel Market Share, By Location, In USD Billion, 2016-2030F
- Figure 177. Saudi Arabia Underwater Hotel Market Share, By Type of Accommodation, In USD Billion, 2016-2030F
- Figure 178. Saudi Arabia Underwater Hotel Market Share, By Design, In USD Billion, 2016-2030F
- Figure 179. Saudi Arabia Underwater Hotel Market Share, By Target Audience, In USD Billion, 2016-2030F
- Figure 180. Saudi Arabia Underwater Hotel Market Share, By Package, In USD Billion, 2016-2030F
- Figure 181. UAE Underwater Hotel Market, By Value, In USD Billion, 2016-2030F
- Figure 182. UAE Underwater Hotel Market Share, By Location, In USD Billion, 2016-2030F
- Figure 183. UAE Underwater Hotel Market Share, By Type of Accommodation, In USD Billion, 2016-2030F
- Figure 184. UAE Underwater Hotel Market Share, By Design, In USD Billion, 2016-2030F
- Figure 185. UAE Underwater Hotel Market Share, By Target Audience, In USD Billion, 2016-2030F
- Figure 186. UAE Underwater Hotel Market Share, By Package, In USD Billion, 2016-2030F
- Figure 187. South Africa Underwater Hotel Market, By Value, In USD Billion, 2016-2030F
- Figure 188. South Africa Underwater Hotel Market Share, By Location, In USD Billion, 2016-2030F
- Figure 189. South Africa Underwater Hotel Market Share, By Type of Accommodation, In USD Billion, 2016-2030F
- Figure 190. South Africa Underwater Hotel Market Share, By Design, In USD Billion, 2016-2030F
- Figure 191. South Africa Underwater Hotel Market Share, By Target Audience, In USD Billion, 2016-2030F
- Figure 192. South Africa Underwater Hotel Market Share, By Package, In USD Billion, 2016-2030F
- Figure 193. By Location Map-Market Size (USD Billion) & Growth Rate (%), 2022
- Figure 194. By Type of Accommodation Map-Market Size (USD Billion) & Growth Rate (%), 2022
- Figure 195. By Design Map-Market Size (USD Billion) & Growth Rate (%), 2022
- Figure 196. By Target Audience Map-Market Size (USD Billion) & Growth Rate (%), 2022
- Figure 197. By Package Map-Market Size (USD Billion) & Growth Rate (%), 2022
- Figure 198. By Region Map-Market Size (USD Billion) & Growth Rate (%), 2022
The underwater hotels market has emerged as an innovative and captivating niche within the broader hospitality industry. These submerged accommodations offer a unique and luxurious experience that appeals to adventurers, honeymooners, and travellers seeking unparalleled memories. This market was estimated at USD 2.75 billion in 2022 and is anticipated to reach USD 8.59 billion by 2030, growing at a CAGR of 15.3% during the forecast period, driven by technological advancements, architectural ingenuity, and a desire for distinctive travel experiences.
Underwater hotels are typically situated in exotic coastal locations, where guests can enjoy breathtaking views of marine life through large windows, creating an immersive connection with the ocean environment. These hotels often integrate sustainable practices and technologies, such as water recycling systems and minimal-impact construction, to mitigate potential ecological concerns.
The market's growth potential is underscored by its ability to cater to high-net-worth individuals and luxury travellers willing to pay a premium for exclusive underwater stays. However, the capital-intensive nature of constructing underwater structures, coupled with logistical challenges and regulatory approvals, can pose barriers to entry for potential developers.
Some underwater hotels offer partial underwater accommodations, combining above-water suites with underwater lounges or restaurants to appeal to a broader customer base. While the concept of underwater hotels is captivating, several factors contribute to the market's outlook, including economic conditions, environmental sustainability concerns, and the ability to deliver a seamless and safe guest experience. As the travel and hospitality industries evolve, the underwater hotels market's trajectory will likely depend on technological advancements, shifting consumer preferences, and the industry's commitment to sustainable practices.
Luxury Travellers are Among the Main Target Audience
Luxury and exclusivity play a pivotal role in driving the growth of the underwater hotel market. The allure of a rare and opulent experience draws high-net-worth individuals and discerning travellers seeking unparalleled indulgence. These guests are willing to pay a premium for staying in underwater accommodations, fostering a lucrative revenue stream for developers. The perception of exclusivity elevates the desirability of underwater hotels, creating a sense of prestige and social distinction among guests. As a result, luxury and exclusivity attract a niche clientele and contribute to media attention, word-of-mouth marketing, and the establishment of these hotels as iconic symbols of exceptional hospitality. This synergy between exclusivity and market growth reinforces the notion that underwater hotels transcend conventional lodgings, offering an extraordinary escape for those seeking a remarkable stay.
Media and Marketing Value Add to the Market Growth
Media and marketing value plays a crucial role in propelling the growth of the underwater hotel market. These unique and visually captivating accommodations capture media attention, generating widespread coverage and buzz. This heightened visibility draws potential guests' interest and positions underwater hotels as exotic and alluring destinations. Thus, media exposure and strategic marketing efforts contribute significantly to expanding the underwater hotel market by creating a sense of wonder and adventure that resonates with many travelers.
In August 2022, after a three-year hiatus, Atlantis Aquaventure After Dark, the UAE's largest moonlit waterpark party, concluded the summer season grandly. Waterpark enthusiasts aged 16 and above could anticipate an exciting night featuring 105 rides, slides, and attractions across three towers. The event boasted three live DJ zones spinning the season's hottest tracks, on-site activations sponsored by Coca-Cola, a delectable variety of food choices, and a dedicated Virgin Radio zone.
Global Tourism Growth Impacts the Market
Global tourism growth directly and substantially impacts driving the expansion of the underwater hotels market. As more people engage in travel and seek novel, unforgettable experiences, niche offerings like underwater hotels gain prominence. The rise in international travel and exploring new destinations create a diverse and adventurous customer base interested in unique accommodations. Additionally, the growing accessibility of travel information and the ease of booking make these exclusive experiences more reachable to a broader range of travellers. Consequently, the upward trajectory of global tourism bolsters the underwater hotels market, transforming it from a niche concept into a sought-after component of travellers' bucket lists.
In March 2022, Conrad Maldives Rangali Island offered a sneak peek into its multi-million-dollar renovation project, set for an official "Grand Relaunch." The extensive two-year transformation included refurbishing 50 overwater villas and the spa and adding a new gym. These updates aimed to enhance the connection with the natural surroundings while offering a contemporary experience to guests.
Adventure and Experiential Tourism Trends
Adventure and experiential tourism trends significantly drive the growth of the underwater hotels market. As modern travellers increasingly seek immersive and offbeat experiences, underwater accommodations offer a thrilling and novel opportunity. The adventurous spirit inherent in these trends aligns perfectly with the unique allure of underwater hotels, where guests can explore marine life and ecosystems in an unprecedented manner. The desire to create lasting memories and engage in extraordinary activities fuels the demand for accommodations beyond conventional offerings. Underwater hotels cater to this appetite for adventure by enhancing the overall travel experience. As adventure and experiential tourism continue to shape travel preferences, underwater hotels benefit from a growing market segment that values authenticity, novelty, and the opportunity to create remarkable stories to share. In February 2023, Siyam World introduced the world's inaugural underwater jet pack in partnership with Cudajet. The Cudajet is easily attachable and detachable, enabling quick swaps between divers. The harness also offers buoyancy, making it effortless for divers to rest on the surface between dives.
Impact of COVID-19
The COVID-19 pandemic had a profound impact on the underwater hotels market. Travel restrictions, lockdowns, and reduced tourism resulted in temporary closures and decreased occupancy rates for these unique accommodations. With international travel largely halted, the market faced financial challenges as luxury travel and discretionary spending declined. Development projects and expansions were put on hold due to uncertainties, affecting the growth trajectory. However, some underwater hotels adapted by implementing stringent health and safety measures to attract guests seeking isolated and exclusive experiences. As travel begins to recover, the market is gradually regaining, with the unique allure of underwater hotels potentially appealing to travellers seeking secluded and extraordinary getaways in a post-pandemic world.
Key Players Landscape and Outlook
The underwater hotel market's key players included brands such as Conrad Maldives Rangali Island, Utter Inn, and Atlantis, The Palm. These establishments showcased the trend of offering partially submerged accommodations that combine luxury suites above water with underwater dining and observation areas. The outlook for the underwater hotels market indicated continued growth potential, albeit with cautious considerations due to the COVID-19 pandemic's impact on travel. While the pandemic posed challenges, underwater hotels' unique and aspirational nature could position them as sought-after destinations in the evolving travel landscape. Technological advancements, environmental sustainability efforts, and innovative designs will likely shape the market's future, with travellers seeking exclusive and immersive experiences contributing to its sustained growth.
Table of Contents
1. Research Methodology
2. Project Scope & Definitions
3. Impact of COVID-19 on Underwater Hotels Market
4. Executive Summary
5. Voice of Customer
- 5.1. Demographics (Age/Cohort Analysis - Baby Boomers and Gen X, Millennials, Gen Z; Gender; Income - Low, Mid and High; Geography; Nationality; etc.)
- 5.2. Market Awareness and Hotel Information
- 5.3. Hotel Awareness and Loyalty
- 5.4. Factors Considered in Booking Decision
- 5.4.1. Hotel Name
- 5.4.2. Location
- 5.4.3. Price
- 5.4.4. Type of Accommodation
- 5.4.5. Duration of Stay
- 5.4.6. Customisation Options
- 5.4.7. Safety and Security
- 5.4.8. Activities and Amenities
- 5.4.9. Promotional Offers & Discounts
- 5.5. Accessibility
- 5.6. Booking Availability
- 5.7. Medium of Booking
- 5.8. Reviews and Reputation
6. Underwater Hotels Market Outlook, 2016-2030F
- 6.1. Market Size & Forecast
- 6.1.1. By Value
- 6.2. By Location
- 6.2.1. Coastal Areas
- 6.2.2. Open Oceans
- 6.3. By Type of Accommodation
- 6.3.1. Underwater Suites
- 6.3.2. Underwater Villas
- 6.3.3. Underwater Pods/Capsules
- 6.4. By Design
- 6.4.1. Partially Submerged
- 6.4.2. Fully Submerged
- 6.5. By Target Audience
- 6.5.1. Luxury Travelers
- 6.5.2. Adventure Seekers
- 6.6. By Package
- 6.6.1. Corporate Retreat
- 6.6.2. Wedding and Honeymoon Packages
- 6.6.3. All-inclusive Stays
- 6.6.4. Others
- 6.7. By Region
- 6.7.1. North America
- 6.7.2. Europe
- 6.7.3. South America
- 6.7.4. Asia-Pacific
- 6.7.5. Middle East and Africa
- 6.8. By Company Market Share (%), 2022
7. Underwater Hotels Market Outlook, By Region, 2016-2030F
- 7.1. North America*
- 7.1.1. Market Size & Forecast
- 7.1.1.1. By Value
- 7.1.2. By Location
- 7.1.2.1. Coastal Areas
- 7.1.2.2. Open Oceans
- 7.1.3. By Type of Accommodation
- 7.1.3.1. Underwater Suites
- 7.1.3.2. Underwater Villas
- 7.1.3.3. Underwater Pods/Capsules
- 7.1.4. By Design
- 7.1.4.1. Partially Submerged
- 7.1.4.2. Fully Submerged
- 7.1.5. By Target Audience
- 7.1.5.1. Luxury Travelers
- 7.1.5.2. Adventure Seekers
- 7.1.6. By Package
- 7.1.6.1. Corporate Retreat
- 7.1.6.2. Wedding and Honeymoon Packages
- 7.1.6.3. All-inclusive Stays
- 7.1.6.4. Others
- 7.1.7. United States*
- 7.1.7.1. Market Size & Forecast
- 7.1.7.1.1. By Value
- 7.1.7.2. By Location
- 7.1.7.2.1. Coastal Areas
- 7.1.7.2.2. Open Oceans
- 7.1.7.3. By Type of Accommodation
- 7.1.7.3.1. Underwater Suites
- 7.1.7.3.2. Underwater Villas
- 7.1.7.3.3. Underwater Pods/Capsules
- 7.1.7.4. By Design
- 7.1.7.4.1. Partially Submerged
- 7.1.7.4.2. Fully Submerged
- 7.1.7.5. By Target Audience
- 7.1.7.5.1. Luxury Travelers
- 7.1.7.5.2. Adventure Seekers
- 7.1.7.6. By Package
- 7.1.7.6.1. Corporate Retreat
- 7.1.7.6.2. Wedding and Honeymoon Packages
- 7.1.7.6.3. All-inclusive Stays
- 7.1.7.6.4. Others
- 7.1.8. Canada
- 7.1.9. Mexico
- 7.1.1. Market Size & Forecast
All segments will be provided for all regions and countries covered:
- 7.2. Europe
- 7.2.1. Germany
- 7.2.2. France
- 7.2.3. Italy
- 7.2.4. United Kingdom
- 7.2.5. Russia
- 7.2.6. Netherlands
- 7.2.7. Spain
- 7.2.8. Turkey
- 7.2.9. Poland
- 7.3. South America
- 7.3.1. Brazil
- 7.3.2. Argentina
- 7.4. Asia Pacific
- 7.4.1. India
- 7.4.2. China
- 7.4.3. Japan
- 7.4.4. Australia
- 7.4.5. Vietnam
- 7.4.6. South Korea
- 7.4.7. Indonesia
- 7.4.8. Philippines
- 7.5. Middle East & Africa
- 7.5.1. UAE
- 7.5.2. Saudi Arabia
- 7.5.3. South Africa
8. Market Mapping, 2022
- 8.1. By Location
- 8.2. By Type of Accommodation
- 8.3. By Design
- 8.4. By Target Audience
- 8.5. By Package
- 8.6. By Region
9. Macro Environment and Industry Structure
- 9.1. Supply Demand Analysis
- 9.2. Value Chain Analysis
- 9.3. PESTEL Analysis
- 9.3.1. Political Factors
- 9.3.2. Economic System
- 9.3.3. Social Implications
- 9.3.4. Technological Advancements
- 9.3.5. Environmental Impacts
- 9.3.6. Legal Compliances and Regulatory Policies (Statutory Bodies Included)
- 9.4. Porter's Five Forces Analysis
- 9.4.1. Supplier Power
- 9.4.2. Buyer Power
- 9.4.3. Substitution Threat
- 9.4.4. Threat from New Entrant
- 9.4.5. Competitive Rivalry
10. Market Dynamics
- 10.1. Growth Drivers
- 10.2. Growth Inhibitors (Challenges and Restraints)
11. Key Players Landscape
- 11.1. Competition Matrix of Top Five Market Leaders
- 11.2. Market Revenue Analysis of Top Five Market Leaders (in %, 2022)
- 11.3. Mergers and Acquisitions/Joint Ventures (If Applicable)
- 11.4. SWOT Analysis (For Five Market Players)
- 11.5. Patent Analysis (If Applicable)
12. Pricing Analysis
13. Case Studies
14. Key Players Outlook
- 14.1. The Manta Resort
- 14.1.1. Company Details
- 14.1.2. Key Management Personnel
- 14.1.3. Products & Services
- 14.1.4. Financials (As reported)
- 14.1.5. Key Market Focus & Geographical Presence
- 14.1.6. Recent Developments
- 14.2. Conrad Hilton (Conrad Maldives Rangali Island)
- 14.3. Atlantis, The Palm
- 14.4. Utter Inn
- 14.5. InterContinental Shanghai Wonderland
- 14.6. The Poseidon Underwater Resort
- 14.7. Reefsuites, Whitsunday Islands
- 14.8. Jules' Undersea Lodge
- 14.9. Water Discus Hotel
- 14.10. Niyama Private Islands
Companies mentioned above DO NOT hold any order as per market share and can be changed as per information available during research work.
