|
|
市場調査レポート
商品コード
1619729
ウェブスケールネットワーク事業者の市場レビュー (2024年第3四半期):設備投資額は前年同期比58%増、12カ月累計を2,500億米ドル超へと押し上げる・展望は力強いが生成AIは現実を直視する必要があるWebscale Network Operators - 3Q24 Market Review: Capex Jumps 58% YoY in 3Q24, Pushing 12 mo. Total Over $250 Billion, Outlook Remains Strong, but Reality Check is Needed for GenAI |
||||||
|
|||||||
|
|||||||


| ウェブスケールネットワーク事業者の市場レビュー (2024年第3四半期):設備投資額は前年同期比58%増、12カ月累計を2,500億米ドル超へと押し上げる・展望は力強いが生成AIは現実を直視する必要がある |
|
出版日: 2024年12月13日
発行: MTN Consulting, LLC
ページ情報: 英文
納期: 即納可能
|

全表示
- 概要
- 図表
- 目次
2024年第3四半期の設備投資額は前年同期比58%増、12カ月累計で2,500億米ドル超に
ウェブスケールネットワークオペレーター (WNO) 21社を対象に調査を行った結果、直近の12カ月間 (2023年第4四半期-2024年第3四半期) において、ウェブスケール事業者の収益は2兆5,300億米ドル (前年同期比9.1%増) 、研究開発費は3,070億米ドル (同6.5%増) 、設備投資額は2,540億米ドル (同32.5%増) でした。2024年9月時点の帳簿上の現金・短期投資は6,310億米ドル (前年比11.3%減) 、負債総額は5,380億米ドル (前年比4.1%減) でした。また、2024年9月時点のウェブスケーラーの純PP&Eの帳簿価額は8,540億米ドルで、前年同月比25.9%増となっています。ウェブスケーラーの第3四半期末の従業員数は約422万6,000人で、2023年9月時点の413万人から2.3%増加しました。
本レポートでは、2011年以降のウェブスケールネットワークオペレーター (WNO) 市場の成長と発展をレビューします。
ビジュアル
レポートハイライト:
- 収益:2024年第3四半期の単期収益は6,386億米ドルで、前年同期比10.6%増。この結果、年間収益は2兆5,270億米ドルとなっています。トップラインの成長は、Alphabet、Amazon、Meta (FB)、Microsoftのビッグ4が牽引しています。これらの企業は5四半期連続で2桁の収益成長を記録し、他社を大きく引き離しています。2024年第3四半期の年率換算期間では、最も急成長したのはMetaで、2022第4四半期と2023年第3四半期の比で23.1%増、次いでMicrosoft (16.4%増) 、Alphabet (14.4%増) 、Amazon (11.9%増) となっています。2024年第3四半期の成長に最も大きな影響を与えたのはAmazonで、同社の単四半期収益は2023年第3四半期から158億米ドル増加し、2024年第3四半期は前年同期比11.0%増の1,589億米ドルとなっています。日本のITサービス&クラウドベンダーである富士通は、前年同期比4億9,200万米ドル (7.8%) 減の58億米ドルとなっています。
- 設備投資:2023年に5%減少したウェブスケールの設備投資は、2024年には驚くほど急速に、持続困難なペースで増加しています。2012年第3四半期の設備投資額は756億米ドルで、年換算の総額は前年同期比32.5%増の2,539億米ドルに達し、過去最高を更新しました。生成AIに対する投資家の関心は急速に広まり、データセンターにおけるGPU投資を牽引しています。
- 収益性:ウェブスケールのフリーキャッシュフローマージンは、2024年第3四半期の年率平均で17.6%となり、前年同期 (17.9%) よりやや低いものの、2022年第3四半期の14.1%より高い値となりました。2023年第4四半期から2024年第3四半期の平均純利益率は18.9%で、2023年第3四半期の16.9%をやや上回っています。いずれの収益性指標もCOVID前年とほぼ同水準です。
- 従業員数:ウェブスケール市場の従業員数は、2024年9月には423万人となり、2023年9月の413万人からわずかに増加しました。この差は、いくつかのウェブスケーラーの規模や、特にeコマースのスペシャリストの従業員数の変化の速さを考えれば、ごくわずかです。
- 地域動向:アジア太平洋地域は数四半期にわたり市場の足を引っ張っており、第3四半期もその傾向が続きました。南北アメリカ、欧州、中東・アフリカのウェブスケールの収益はここ数四半期2桁台前半の成長を続けているが、アジア太平洋地域は低調で、2024年第3四半期の売上成長率は前年同期比5%増と、ここ数四半期の1桁台前半の成長率と同水準でした。
調査対象
WNOトップ8社
|
|
その他のWNO
|
|
目次
- 1.レポートハイライト
- 2.展望
- 3.分析
- 4.主要統計
- 5.企業の詳細
- 6.WNOトップ8社
- 7.企業ベンチマーキング
- 8.地域別内訳
- 9.生データ
- 10.為替レート
- 11.本書について
List of Figures
- 1. Key Metrics: Growth rates, Annualized 3Q24/3Q23 vs. 2019-23
- 2. WNO Revenues: Single-quarter & annualized (US$M)
- 3. Top 8 WNOs: YoY revenue growth in 3Q24
- 4. Annualized profitability: WNOs
- 5. Free cash flow per employee, 3Q24 annualized (US$)
- 6. FCF Margins vs. Net Margins, 3Q24 annualized
- 7. Advertising revenues as % total (FY2023)
- 8. Annualized capex and R&D spending: WNOs (% revenues)
- 9. WNO capex by type, Annualized: 3Q15-3Q24 (US$M)
- 10. Network & IT capex as share of revenues, 3Q24 annualized
- 11. R&D expenses as % revenues, Top 8 WNOs (3Q24 annualized)
- 12. Acquisition spending vs. capex spending, annualized (US$M)
- 13. Net PP&E per employee (US$' 000) - 3Q24
- 14. Ranking the Webscale Network Operators: Revenues; R&D; Capex; Network & IT capex - 2023 & 3Q24 (US$B)
- 15. Annualized spending share for key webscalers since 2011 Capex: Network, IT and software
- 16. Share of webscale spending by company, 3Q24 and 3Q23 annualized (Capex: Network, IT and software)
- 17. Energy consumption vs. Net PP&E for key webscalers in 2023
- 18. USA: Webscale capex total ($M) and % of global market, 2011-23
- 19. Webscale vs. Telco Market: Annualized Capex (US$B)
- 20. Webscale vs. Telco Market: Annualized capital intensity
- 21. Revenues: annual, single-quarter, and annualized (US$M)
- 22. Profitability (Net Profit; Cash from operations; Free cash flow): annual, single-quarter, and annualized (US$M)
- 23. Spending (R&D; M&A; Capex; Network & IT capex; Lease): annual, single-quarter, and annualized (US$M)
- 24. Cash & Short-term Investments: annual and single-quarter (US$M)
- 25. Debt (Total debt; Net debt): annual and single-quarter (US$M)
- 26. Property, Plant & Equipment: annual and single-quarter (US$M)
- 27. Key Ratios: Net margin; R&D/revenues; Capex/revenues; Network & IT capex/revenues; Free cash flow/revenues; Lease costs/revenues - annual and annualized (%)
- 28. Total employees
- 29. Revenue per employee, annualized (US$K)
- 30. FCF per employee, annualized (US$K)
- 31. Net PP&E per employee, annualized (US$K)
- 32. Revenues & Spending (US$M)
- 33. Webscale Business Mix by Revenues (FY2023) - MTN Consulting estimates
- 34. Top 10 recent acquisitions & investments
- 35. Data center footprint
- 36. Revenues (US$M) & YoY revenue growth (%), single-quarter: by company
- 37. Revenues, annualized (US$M): by company
- 38. Annualized profitability margins: by company
- 39. Annualized capex and capital intensity: by company
- 40. Annualized capex and R&D spending as % of revenues: by company
- 41. Share of WNO network & IT capex, Annualized: by company
- 42. Total employees: by company
- 43. Annualized per-employee metrics (US$000s): by company
- 44. Net debt (debt minus cash & stock) (US$M): by company
- 45. Top 10 webscale employers in 3Q24: Global market
- 46. Headcount changes in 3Q24 (YoY %): Global market
- 47. Net PP&E: USA vs. RoW (by company)
- 48. Net PP&E: total in $M and % global webscale market (by company)
- 49. Energy consumption, MWh and % webscale total (by company)
- 50. Share of webscale energy consumption, net PP&E, and capex (by company)
- 51. Energy intensity relative to webscale average and select data center-focused CNNOs (by company)
- 52. Energy intensity in webscale sector, 2023: MWh consumed per $M in revenue
- 53. Capex/revenues (annualized): Company vs. Webscale average
- 54. Revenue per employee (US$000s) (annualized): Company vs. Webscale average
- 55. 2017 vs. 2023: company benchmark by KPI (Revenues, R&D, Net profit, Cash from operations, Capex, Free cash flow, Cash & short-term investments, Net PP&E, Total debt)
- 56. 2017 vs. 2023: company benchmark by key ratio (Capex/revenues; R&D/revenues; Net margin; FCF margin)
- 57. Top 8 WNO's share vs. Rest of the market: by KPI (Revenues, R&D, Net profit, Cash from operations, Capex, Free cash flow, Cash & short-term investments, Net PP&E, Total debt)
- 58. Top 8 WNOs benchmarking by Key ratio: Capex/revenues; R&D/revenues; Net margin; FCF margin)
- 59. Total WNO Market Revenues, by region: Latest CY; Latest Quarter; Annual trend (2011-23); Single quarter (3Q15-3Q24 )
- 60. WNO Market: Revenues, single-quarter (YoY % change)
- 61. Regional revenues by operator: Latest CY; Latest Quarter; Annual trend (2011-23); Single quarter (3Q15-3Q24)
- 62. Top 10 operators by region: Latest CY; Latest Quarter
Capex jumps 58% YoY in 3Q24, pushing 12 mo. total over $250 billion; outlook remains strong, but reality check is needed for GenAI
This report reviews the growth and development of the webscale network operator (WNO, or webscale) market since 2011. It covers 21 companies. In the most recent 12 months (4Q23-3Q24), webscalers represented $2.53 trillion (T) in revenues (+9.1% YoY), $307 billion (B) in R&D spending (+6.5% YoY), and $254B in capex (+32.5% YoY). They had $631B of cash and short-term investments (-11.3% YoY) on the books as of September 2024, and $538B in total debt (-4.1% YoY). The value of webscalers' net plant, property & equipment (net PP&E) on the books as of September 2024 was $854B, up 25.9% YoY. Webscalers employed approximately 4.226 million (M) people at the end of 3Q24, up 2.3% from the Sept. 2023 total of 4.130M.
VISUALS
Below are highlights from the report:
- Revenues: Single quarter revenues in 3Q24 were $638.6 billion (B), up 10.6% YoY. That pushed annualized revenues to $2.527 trillion. Topline growth has been driven by the big 4: Alphabet, Amazon, Meta (FB) and Microsoft. For five straight quarters, all of these companies have recorded double digit revenue growth, well above the rest of the pack. For the 3Q24 annualized period, the fastest growth came from Meta, up 23.1% versus 4Q22-3Q23, followed by Microsoft (+16.4%), Alphabet (14.4%), and Amazon (11.9%). The biggest dollar impact on growth in 3Q24 came from Amazon, as its single quarter revenues grew $15.8 billion from 3Q23 to end 3Q24 at $158.9B, up 11.0% YoY. The only curb on growth in 3Q24 was Japanese IT services & cloud vendor Fujitsu, which recorded 3Q24 revenues of $5.8B, down $492 million (M) YoY (-7.8%).
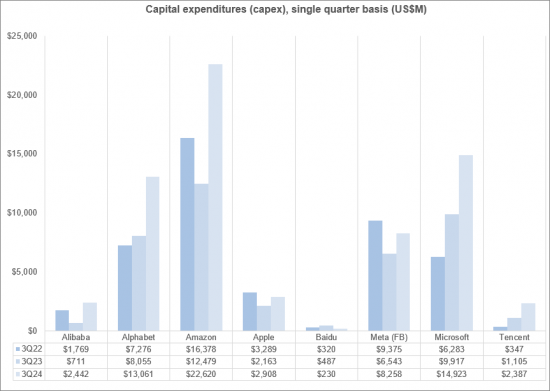
- Capex: After declining 5% in 2023, webscale capex has grown at incredibly fast, unsustainable rates in 2024: up by 25%, 51%, and 58% YoY in the first three quarters of the year. 3Q24 capex of $75.6B pushed the annualized total to $253.9B, up 32.5% YoY, and another all-time high. Investor interest in generative AI has spread rapidly, driving GPU spend in the data center. The current investment spike would seem to be inspired by a mix of hype and fear of missing out, as GenAI brings with it a plethora of legal & regulatory risks and relative lack of proven business models. Most recent webscale capex is focused on outfitting existing data centers: from 46% of annualized capex in 3Q22, Network/IT and software capex was 53% of total capex for the latest annualized period. The biggest capex outlays in 3Q24 came from Amazon ($22.6B), Microsoft ($14.9B), Alphabet ($13.1B), and Meta (FB) ($8.3B). These four account for about 80% of single quarter spending. They are the reason behind the unsustainable surge in the price of NVIDIA stock.
- Profitability: Webscale free cash flow margins averaged out to 17.6% for the 3Q24 annualized period, a bit lower than a year prior (17.9%) but higher than the 14.1% booked in 3Q22. Average net profit margin for 4Q23-3Q24 was 18.9%, a bit higher than 16.9% in 3Q23. Both profitability metrics are around the same level as in the year before COVID. Meta, Tencent and Microsoft are regularly near or at the top of the heap on both metrics, and this was again the case in 3Q24. The ecommerce specialists Amazon and Alibaba are the laggards, as usual. The biggest drops in free cash flow margins came at the companies with surging capex: Alphabet and Amazon. The biggest decline in net profitability was Apple, which was fined 13 billion Euros in September 2024 for taking illegal profits from a tax scheme in Ireland over two decades. This tax scheme has been widely known about and criticized for many years. While 13 billion sounds like a lot, it hardly impacted Apple's market trajectory at all. Apple's stock price is around 14% higher now than on 1 July 2024. Consumers and taxpayers are losing out, while big tech uses political friends to secure victories. This will get worse with new political leadership in the US.
- Employees: Headcount in the webscale market totaled to 4.23 million in September 2024, slightly up from 4.13 million in September 2023. This difference is negligible, considering the size of some of the webscalers and how quickly the ecommerce specialists in particular can change workforce levels. Amazon's workforce grew by 51,000 between September 2023 and 2024, for instance. Total webscale headcount has been approximately 4.1 to 4.2 million or so steadily since late 2021. Some of the biggest webscalers are investing heavily in AI and GenAI, with one clear goal being to improve their internal cost efficiencies. This inevitably will mean fewer employees. Even within the ecommerce space, there is a rising use of robots and autonomous vehicles in the logistics chain. Per our latest forecast, we expect webscale employment to rise slightly in 2025 but decline thereafter due to greater use of robotics, automation and AI.
- Regional trends: The Asia-Pacific region has been a drag on the market for several quarters, and that continued in 3Q24. Webscale revenues in the Americas, Europe, and MEA have been growing in the low double digit range for a few quarters, but AP has been weak: 3Q24 revenue growth was 5% YoY, in line with the last few quarters of low single digit percentage growth. Weak Asian currencies and a very competitive 'big tech' market in China account for the gap. Another factor is TikTok. This company, owned by ByteDance, has grown at explosive rates for the last few years, but remains private. We have no reasonable way to include TikTok figures in our database. The ByteDance surge also ate into the 2022-23 growth of some western webscalers, notably Meta (FB), but that effect has ebbed.
Coverage
Top 8 WNOs
|
|
Other WNOs
|
|
Table of Contents
- 1. Report highlights
- 2. Outlook
- 3. Analysis
- 4. Key Stats
- 5. Company Drilldown
- 6. Top 8 WNOs
- 7. Company Benchmarking
- 8. Regional Breakouts
- 9. Raw Data
- 10. Exchange Rates
- 11. About

