
|
市場調査レポート
商品コード
1851615
アンモニア:市場シェア分析、産業動向、統計、成長予測(2025年~2030年)Ammonia - Market Share Analysis, Industry Trends & Statistics, Growth Forecasts (2025 - 2030) |
||||||
カスタマイズ可能
適宜更新あり
|
|||||||
| アンモニア:市場シェア分析、産業動向、統計、成長予測(2025年~2030年) |
|
出版日: 2025年07月28日
発行: Mordor Intelligence
ページ情報: 英文 120 Pages
納期: 2~3営業日
|

概要
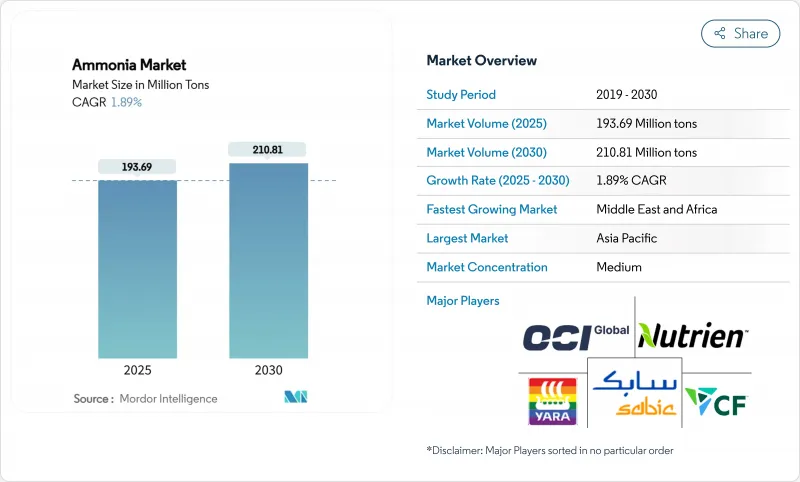
アンモニア市場規模は2025年に1億9,369万トンと推計され、2030年には2億1,081万トンに達すると予測され、予測期間(2025~2030年)のCAGRは1.89%です。
この堅調なトップラインは、脱炭素化目標の強化、天然ガス価格の不安定性の持続、低炭素海上燃料の普及に伴う、生産技術、原料戦略、川下用途の根本的な転換を裏付けるものです。グリーンおよびブルー設備への戦略的投資、中国における石炭からガスへのアップグレード、水素キャリアとしてのアンモニアの台頭により、サプライチェーンの位置づけが変わりつつある一方、安全要件の高まりと尿素の供給過剰により、短期的な価格は不安定なままです。低炭素原料を確保し、再生可能電力を確保し、技術提携を結ぶことができる生産者はコスト競争力を向上させているが、欧州のガス露出資産は依然としてマージン圧力下にあります。こうした構造的な力によってアンモニア市場が再構築されるにつれ、地域の成長率、製品構成、貿易フローは、主要トン数が示唆する以上に乖離しています。
世界のアンモニア市場の動向と洞察
アジア全域で低炭素肥料需要が急増
持続可能性に向けたアジアの農業の軸足は、低炭素肥料の導入を加速させています。中国は、再生可能な電力と炭素捕捉システムで石炭ベースの資産をアップグレードしており、再生可能な混合肥料への需要を高めています。インドネシアのGAIAプロジェクトは、天然ガスと電解水素を共同供給する初のハイブリッドプラントを導入し、移行施設のためのスケーラブルなテンプレートを提供しています。持続可能な投入資材に対する優遇融資制度や、従来型尿素プラントの排出規制強化などの政策インセンティブが、農家をプレミアム製品へと誘導しています。その波及効果は、モジュール式電解槽の設備受注や、肥料販売業者と再生可能電力開発業者との間の長期引取契約にすでに現れています。
海上バンカリング用水素キャリアとしての採用
海運セクターの脱炭素化誓約は、アンモニアを実用的な水素のベクトルとして位置づけています。日本と韓国は2024年に世界初のトラックから船への燃料補給を完了し、エンド・ツー・エンドでの取り扱いの安全性を実証し、港湾当局の信頼を強化しました。2050年までに船舶の排出量を半減させるという国際海事機関の目標が、グリーンなアンモニア供給契約を締結する意欲を船会社に与えました。船級協会によるアンモニア対応エンジンの承認と内航船設計の展開は、技術的リスクを低減し、炭素価格予測はプロジェクトの経済性を向上させています。
変動する天然ガス価格が欧州の生産コストを押し上げる
欧州の生産者は、天然ガスのスポット価格が2022年以前の水準を上回って推移しているため、慢性的なコストインフレに直面しています。CFインダストリーズ社とBASF社が運営する複数のプラントが生産を縮小し、最大700万トンの有効生産能力が削減されました。ロシア産尿素の輸入がそのギャップを埋めており、地域の政策目標を複雑にしています。エネルギー供給契約によって競争力のある価格が確保されるか、ブルーアンモニアの改修が迅速に進まない限り、欧州の供給は世界的な需要に遅れをとることが予想されます。
セグメント分析
2024年のアンモニア市場トン数の95%は液体製品です。この形態は、圧縮水素よりも体積エネルギー密度が高いという利点があり、海上バンカー・サプライヤーや長距離パイプライン・ブレンドのコスト効率の高い貯蔵を容易にします。このセグメントは、新しい港湾バンカリングハブ、現場冷凍システム、沿岸専用輸送船の稼動に伴い、アンモニア市場全体をやや上回る年率1.94%で成長すると予測されます。日本の大型沿岸輸送船のプロトタイプを含む技術の進歩は、トン当たりの配送コストを削減する、より大きな小包サイズをサポートします。極低温断熱材と検知システムへの投資は、ボイルオフ・ロスを軽減し、流動性の優位性をさらに強化します。
特定のポリマーやカプロラクタム合成など、即時ガス化を必要とするプロセスでは、気体セグメントが不可欠であることに変わりはないが、そのシェアは高いハンドリングコストによって制約されています。安全規制によって輸送圧力が制限され、肉厚のシリンダーが要求されるため、冷蔵液体輸送に比べて物流費が膨らみます。ニッチな石油化学プロセスでの成長が期待されるもの、2030年まで液体製品がアンモニア市場を独占し続けると思われます。
地域分析
2024年のアンモニア市場は、アジア太平洋地域が51.40%のシェアを占めました。中国の石炭ガス化改修とインドの日量750トンのHygencoプロジェクトが低炭素能力を拡大し、日本と韓国の港湾がバンカリング試験運用を開始しました。再生可能エネルギーによる電力融通や税制優遇措置を提供する地域政策パッケージは、供給コストをさらに引き下げます。インドネシアのアチェにおけるハイブリッド・プラントは、資源が豊富で電力に制約のある場所に適した移行経路を示しています。
中東・アフリカ地域は、2025~2030年のCAGRが2.67%と予測され、最も急成長している地域です。エジプトの330億米ドルの取引パイプライン、モロッコの10億米ドルのDakhlaプロジェクト、カタールの12億米ドルのブラウンフィールド拡張は、グリーンまたはブルーのアンモニア輸出を通じて太陽光や風力資源を収益化しようとする各国の野心を示しています。メキシコ湾岸のエンジニアリング会社と造船所の提携は、技術的専門知識を提供し、建設スケジュールを早める。
北米は、豊富なシェールガスと炭素捕捉ハブを活用し、限界生産コストを低く抑えます。CFインダストリーズ社の1,040万トンの生産能力と37の米国プロジェクト提案は、認可されればこの地域の生産量を年間2,100万トンから7,900万トンに引き上げる可能性があります。連邦政府によるクリーン水素税額控除は、青色施設の経済性を向上させ、メキシコ湾岸の港湾は欧州やアジア市場への深海アクセスを提供します。
欧州は、ガス価格の高騰と不透明な炭素関税に悩まされています。スポット価格が不安定なため、生産縮小が続いているが、技術プロバイダーは、最大99%のCO2回収率を持つブルーアンモニアの改修を加速させています。輸入依存度は上昇しており、ロシアの尿素流入の増加がその顕著な例です。欧州連合(EU)は国内のエネルギー安全保障を促進しようとしているが、資本配分は、新規の自国生産能力よりも、川下でのクリーン燃料引取契約を優先しています。
ラテンアメリカとオセアニアは、鉱業とバンカー燃料の需要によって、さらなる成長を遂げます。ブラジルのアクー港は、100万トンのグリーンーアンモニア施設用地を確保し、オーストラリアの鉄鉱石拡大は火薬消費を促進します。
その他の特典:
- エクセル形式の市場予測(ME)シート
- 3ヶ月間のアナリストサポート
よくあるご質問
目次
第1章 イントロダクション
- 調査の前提条件と市場の定義
- 調査範囲
第2章 調査手法
第3章 エグゼクティブサマリー
第4章 市場情勢
- 市場概要
- 市場促進要因
- アジア全域で低炭素肥料需要が急増
- アンモニア日本と韓国における海上バンカリング用水素キャリアとしての採用
- 中国の尿素プラントの石炭からガスへの転換がアンモニアのオフテイクを促進
- 火薬製造への利用の増加
- グリーンアンモニア需要の高まり
- 市場抑制要因
- 変動する天然ガス価格が欧州の生産コストを押し上げる
- 安全性と毒性への懸念がさまざまな産業での使用を遅らせる
- 尿素の過剰供給がスポットアンモニア需要を抑制
- バリューチェーン分析
- テクノロジーの展望
- ポーターのファイブフォース
- 供給企業の交渉力
- 買い手の交渉力
- 新規参入業者の脅威
- 代替品の脅威
- 競合の程度
第5章 市場規模と成長予測
- タイプ別
- 液体
- ガス
- 用途別
- 窒素肥料中間体
- 冷媒(産業用およびコールドチェーン用)
- 爆薬および鉱業用硝酸塩
- 医薬中間体
- その他(クリーニング・家庭用品、船舶用燃料・水素運搬船)
- 最終用途産業別
- 農業
- テキスタイル
- 鉱業
- 医薬品
- 参照
- その他(飲食品、ゴム、水処理、石油、紙パルプ産業)
- 地域別
- アジア太平洋地域
- 中国
- インド
- 日本
- 韓国
- ASEAN
- オーストラリア
- ニュージーランド
- その他アジア太平洋地域
- 北米
- 米国
- カナダ
- メキシコ
- 欧州
- ドイツ
- 英国
- フランス
- イタリア
- スペイン
- 北欧諸国
- その他欧州地域
- 南米
- ブラジル
- アルゼンチン
- その他南米
- 中東・アフリカ
- サウジアラビア
- アラブ首長国連邦
- カタール
- トルコ
- 南アフリカ
- エジプト
- ナイジェリア
- その他中東・アフリカ地域
- アジア太平洋地域
第6章 競合情勢
- 市場集中度
- 戦略的動向
- 市場シェア(%)/ランキング分析
- 企業プロファイル
- Acron PJSC
- BASF SE
- CF Industries Holdings Inc.
- CSBP
- Dyno Nobel
- EuroChem Group
- Group DF(Ostchem)
- Grupa Azoty
- IFFCO
- Industries Qatar
- JSC Togliattiazot
- Koch Fertilizer, LLC.
- LSB Industries
- Nutrien
- OCI
- Orica Limited
- PT Pupuk Sriwidjaja Palembang(Pusri)
- Rashtriya Chemicals and Fertilizers Limited
- SABIC
- Yara

