
|
市場調査レポート
商品コード
1441618
コメ貿易分析:市場シェア分析、業界動向と統計、成長予測(2024-2029)Rice Trade Analysis - Market Share Analysis, Industry Trends & Statistics, Growth Forecasts (2024 - 2029) |
||||||
カスタマイズ可能
適宜更新あり
|
|||||||
| コメ貿易分析:市場シェア分析、業界動向と統計、成長予測(2024-2029) |
|
出版日: 2024年02月15日
発行: Mordor Intelligence
ページ情報: 英文 102 Pages
納期: 2~3営業日
|

全表示
- 概要
- 目次
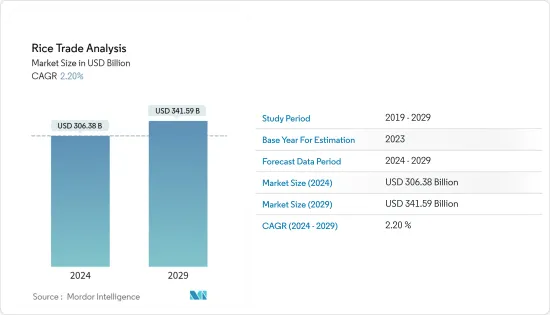
コメ市場規模は2024年に3,063億8,000万米ドルと推定され、2029年までに3,415億9,000万米ドルに達すると予測されており、予測期間(2024年から2029年)中に2.20%のCAGRで成長します。
主なハイライト
- 米は世界の多くの地域、特に東アジアや東南アジア諸国で主食です。主要な米生産国は中国、インド、インドネシア、バングラデシュなどです。米国農務省(USDA)の2022年の報告書によると、その年、世界は5億1,510万トンの米を生産すると予想されています。これは前年比で1.38%増加しました。
- USDAの報告書によると、2021年の米生産量は5億930万トンと評価されました。米の主な輸出国はビルマ、インド、パキスタン、ベトナムです。輸入の場合、主な輸入国は中国、欧州、中東、フィリピンです。
- ジャポニカなどの米品種では、米の国際貿易が最大の市場シェアを占めています。さらに、もち米の国際貿易は過去3年間で増加しています。コメの輸入シナリオはかなり細分化されており、2021年の輸入量上位5社が世界の輸入量の約36.7%を占めています。
- インドは2021年に世界のコメ輸出の45%を占めました。港湾取扱能力の拡大により、中国に次ぐ世界第2位のコメ生産国は記録的な量をアフリカやアジアのバイヤーに出荷できるようになった。インドは世界最大のコメ輸出国であり、タイ、ベトナム、パキスタンの三大輸出国よりも多くのコメを年間輸出しています。インドのコメ輸出は2020年から約46%増加し、2021年には2,100万トンに達しました。
- 米国は世界のコメの2%未満しか栽培していないにもかかわらず、主要な輸出国であり、世界の年間コメ貿易の約6%を占めており、これはかなりの量です。消費に関しては、中国、インド、バングラデシュが主な消費国です。 2019年から2021年までの中国の年間平均消費量は1億5,060万トンで、インドとバングラデシュがそれぞれ1億420万トンと3,610万トンとなりました。
- サハラ以南のアフリカは世界最大の米輸入国です。総輸入量は、世界の輸入量の約31%を占めるアジアの輸入量よりもわずかに多い程度です。中東も重要な輸入市場です。中国、フィリピン、サウジアラビアは米の最大の輸入国です。国連同貿易のデータによると、中国の米輸入量は2020年から68%増加し、2021年には490万トンに達する見込みです。
コメ貿易分析市場動向
有利な貿易政策
米は食糧安全保障において重要な役割を果たしています。そのため、政治的に敏感であり、ほぼ世界中で各国政府の政策行動や民間部門の思惑の影響を受けやすくなっています。国際的なコメ貿易政策は、輸入国と輸出国によって特徴づけられます。
輸入国が市場安定政策を追求する一方で、輸出国はコメの輸出促進政策を追求します。補助金、信用保証、国家管理の貿易独占、米輸入の禁止や割り当てなどは、国内市場を外部競合から隔離し、輸出を拡大するために各国が実施する多くの政策戦略のひとつです。たとえば、米国農務省(USDA)によると、世界の米の29.1%近くが中国で生産されており、中国では米が伝統的な主食となっています。世界トップの輸入国および消費国として、中国は2021年に422万トンの米を輸入しました。国内支援プログラムの結果として生じた中国の高い国内価格が、主に近隣諸国からの輸入を継続する重要な原動力となっています。
中国が世界貿易機関(WTO)に加盟した際、コメの関税割当枠(TRQ)を532万トンに設定し、長粒米とその他の米に均等に配分することに合意しました。植物検疫議定書とこの協定により、米国の米産業は中国に精米を輸出する重要な機会を持つことになります。より持続可能な農業および食料システムの一部としてのコメ部門の発展は、国のコメ政策をより良く調整し、地域貿易協定を実施するという各国の利益にもかかっています。各国政府は最低支援価格を設定し、調達、在庫、流通政策と併せて農場レベルで投入補助金を提供しており、これが世界のコメ貿易を推進しています。
ほとんどの貿易政策は輸出入を奨励しており、世界のコメの需要は増加しているため、コメ市場は成長する可能性があります。国連コムトレードによると、コメの国際貿易額は11.5%増加し、2021年には271億米ドルに達すると予想されています。インドの輸出量は2020年から45%増加し、2021年には2,120万トンとなり、輸出量は毎年一貫して増加しています。国や組織が採用した通商政策のプラスの影響は、世界貿易データに鮮明に表れています。これらの政策は、特に予測される数年間に需要が急増すると予想される場合に、供給と価格を規制し、市場の安定と成長を維持するからです。
インドが輸出市場を独占
インドはバスマティ米、ポンニ米、ジャヤ米などの品種が豊富で、中国に次ぐ世界有数の米の生産・消費国です。また、コメの最大の輸出国でもあります。全インド米輸出業者協会(AIREA)によると、2021年のインドのコメ輸出量は2,120万トンに達し、このうち1,660万トンの非バスマティ米が含まれています。米は必需品であるため、どの国もその輸入を制限していなかった。全体の生産量は、約1,600万トンの非バスマティ米の輸出を支えるのに十分な量でした。良好な気候条件と相まって、北米や欧州からのインド米の需要の高まりが市場の成長を支えています。インドからの高級品種の輸出は、バスマティ輸出市場の85%のシェアを占めています。 AIREAによると、バスマティ米の主な輸入国は中東です。 2021年には、サウジアラビアが103万トン、イランが70万トン、イラクが60万トンを輸入し、インドからのバスマティ輸出総額のほぼ50%を占めました。
AIREAによると、バスマティ米の輸出は2021年に4%増加したが、これは主にサウジアラビアがバスマティ米をより多く購入したためだといいます。 ITCのデータによると、2021年のインドの輸出は45.6%増加し、アジアからの需要の増加が総輸出の29%近くを占めました。
その他の特典
- エクセル形式の市場予測(ME)シート
- 3か月のアナリストサポート
目次
第1章 イントロダクション
- 調査の前提条件と市場の定義
- 調査範囲
第2章 調査手法
第3章 エグゼクティブサマリー
第4章 市場力学
- 市場概要
- 市場促進要因
- 市場抑制要因
第5章 市場セグメンテーション
- 地域(金額と数量による輸入分析、金額と数量による輸出分析)
- 北米
- 米国
- カナダ
- 欧州
- フランス
- 英国
- ドイツ
- イタリア
- スペイン
- アジア太平洋
- 中国
- インド
- タイ
- ベトナム
- パキスタン
- 南米
- ブラジル
- アルゼンチン
- アフリカ
- 南アフリカ
- 北米
第6章 市場機会と将来の動向
The Rice Market size is estimated at USD 306.38 billion in 2024, and is expected to reach USD 341.59 billion by 2029, growing at a CAGR of 2.20% during the forecast period (2024-2029).
Key Highlights
- Rice is a staple food for many parts of the world, especially in the east and southeast Asian countries; the significant rice producers are China, India, Indonesia, Bangladesh, etc. According to a report from the United States Department of Agriculture (USDA) for 2022, the world will produce 515.1 million metric tons of rice that year. This is 1.38% more than the previous year.
- According to reports from the USDA, rice production in 2021 was valued at 509.3 million metric tons. The major exporters of rice are Burma, India, Pakistan, and Vietnam. In the case of imports, the major importers are China, Europe, the Middle East, and the Philippines.
- For rice varieties like Japonica, the international rice trade has the largest market share.Further, international trade in glutinous rice has increased over the past three years. The rice import scenario is quite fragmented, with the top five importers accounting for approximately 36.7% of the global imports in 2021.
- India accounted for as much as 45 percent of global rice exports in 2021. Expanded port-handling capacity allowed the world's second-largest rice grower after China to ship record volumes to buyers across Africa and Asia. India is the world's biggest rice exporter, sending more rice annually than the three largest exporters, Thailand, Vietnam, and Pakistan. India's rice exports increased by almost 46% from 2020, reaching 21 million metric tons in 2021.
- Even though the United States only grows less than 2% of the world's rice, it is a major exporter and accounts for about 6% of the world's annual rice trade, which is a lot, according to a report from the USDA. In terms of consumption, China, India, and Bangladesh are the major consumers. From 2019 to 2021, the annual average consumption of China was 150.6 million metric tons, followed by India and Bangladesh with 104.2 million metric tons and 36.10 million metric tons, respectively.
- Sub-Saharan Africa is the largest importer of rice in the world. Its total imports are just a bit higher than those of Asia, which account for almost 31% of global imports. The Middle East is also an important import market. China, the Philippines, and Saudi Arabia are the biggest importers of rice. According to UN Comtrade data, China's rice imports will increase by 68% starting in 2020 and reach 4.9 million metric tons in 2021.
Rice Trade Analysis Market Trends
Favorable Trade Policies
Rice has a critical role in food security. Hence, it is politically sensitive and vulnerable to national government policy actions and private sector speculation almost worldwide. International rice trade policies can be characterized by importing and exporting countries.
While importing countries pursue market-stabilization policies, exporting countries pursue policies to promote rice exports. Subsidies, credit guarantees, state-controlled trading monopolies, bans or quotas on rice imports, etc., are among the many policy strategies that nations implement to isolate their domestic markets from external competition and boost exports. For instance, according to the United States Department of Agriculture (USDA), nearly 29.1% of the world's rice is produced in China, where it is a traditional staple food. As the top global importer and consumer, China imported 4.22 million metric tons of rice in 2021. China's high internal prices, resulting from its domestic support program, have been a critical driver of sustained imports, primarily from neighboring countries.
When China joined the World Trade Organization (WTO), it agreed to set a tariff-rate quota (TRQ) for rice of 5.32 million metric tons, which would be split evenly between long-grain rice and other rice.With the completion of the phytosanitary protocol and this agreement, the U.S. rice industry will now have more significant opportunities to export milled rice to China. The development of the rice sector as part of a more sustainable agricultural and food system also depends on the interests of the various countries in better coordinating national rice policies and implementing regional trade agreements. The governments of different countries set minimum support prices and provide input subsidies at the farm level, coupled with procurement, stocking, and distribution policies, which are driving the trade of rice globally.
Since most trade policies encourage exports and imports and the global demand for rice is going up, the rice market is likely to grow. According to UN Comtrade, the international trade value of rice will increase by 11.5% and reach USD 27.1 billion in 2021. India's export volume increased by 45% from 2020 to 21.2 million metric tons in 2021, and the export volume has been consistently growing yearly. The positive impact of the trade policies adopted by the countries and organizations is vivid in the global trade data, as these policies regulate the supply and the prices, especially when the demand is expected to skyrocket in the forecasted years, keeping the market stable and growing.
India Dominates the Market in Exports
With a wide variety of rice such as basmati, ponni, jaya, and so on, India is one of the top producers and consumers of rice, second only to China. It is also the top exporter of rice.According to the All India Rice Exporters Association (AIREA), Indian rice exports touched 21.2 million metric tons in 2021, including 16.6 million metric tons of non-Basmati rice. Rice being essential, no country imposed restrictions on its import. The overall production was ample enough to support exports of around 16 million metric tons of non-Basmati rice. Higher demand for Indian rice from North America and Europe, coupled with good climatic conditions, are supporting the growth of the market. Exports of the premium variety from India have an 85% share of the basmati export market. According to AIREA, major importers of basmati rice are from the Middle East; in 2021, Saudi Arabia imported 1.03 million metric tons, Iran imported 0.7 million metric tons, and Iraq imported 0.6 million metric tons, which constituted almost 50% of the total basmati exports from India.
AIREA says that exports of basmati rice grew by 4% in 2021, mostly because Saudi Arabia bought more of it. According to ITC data, India's exports increased by 45.6% in 2021, with increased demand from Asia accounting for nearly 29% of total exports.
Additional Benefits:
- The market estimate (ME) sheet in Excel format
- 3 months of analyst support
TABLE OF CONTENTS
1 INTRODUCTION
- 1.1 Study Assumptions and Market Definition
- 1.2 Scope of the Study
2 RESEARCH METHODOLOGY
3 EXECUTIVE SUMMARY
4 MARKET DYNAMICS
- 4.1 Market Overview
- 4.2 Market Drivers
- 4.3 Market Restraints
5 MARKET SEGMENTATION
- 5.1 Geography (Import Analysis by Value and Volume, Export Analysis by Value and Volume)
- 5.1.1 North America
- 5.1.1.1 United States
- 5.1.1.2 Canada
- 5.1.2 Europe
- 5.1.2.1 France
- 5.1.2.2 United Kingdom
- 5.1.2.3 Germany
- 5.1.2.4 Italy
- 5.1.2.5 Spain
- 5.1.3 Asia-Pacific
- 5.1.3.1 China
- 5.1.3.2 India
- 5.1.3.3 Thailand
- 5.1.3.4 Vietnam
- 5.1.3.5 Pakistan
- 5.1.4 South America
- 5.1.4.1 Brazil
- 5.1.4.2 Argentina
- 5.1.5 Africa
- 5.1.5.1 South Africa
- 5.1.1 North America

