
|
市場調査レポート
商品コード
1852011
アフリカのコメ:市場シェア分析、産業動向、統計、成長予測(2025年~2030年)Africa Rice - Market Share Analysis, Industry Trends & Statistics, Growth Forecasts (2025 - 2030) |
||||||
カスタマイズ可能
適宜更新あり
|
|||||||
| アフリカのコメ:市場シェア分析、産業動向、統計、成長予測(2025年~2030年) |
|
出版日: 2025年08月13日
発行: Mordor Intelligence
ページ情報: 英文 100 Pages
納期: 2~3営業日
|

概要
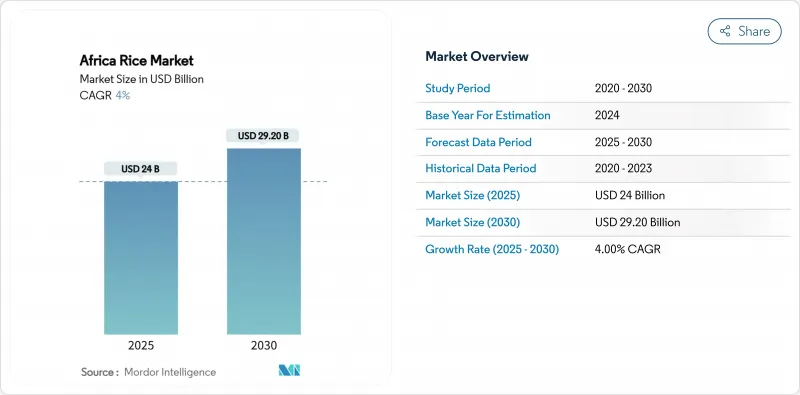
アフリカのコメ市場規模は2025年に240億米ドルに達し、2030年には292億米ドルに達すると予測され、予測期間中のCAGRは4.0%です。
都市人口の増加、便利な主食を好む食事パターンの変化、生産不足の持続がこの成長軌道を支えています。サハラ以南の地域では、消費の増加により輸入米と地元産精米への需要が旺盛です。灌漑の拡大、投入資材への補助金、太陽光発電システムや精密農業などの最新技術といった政府の取り組みが、国内生産の収量増加を後押ししています。しかし、アフリカのコメ市場ではアジアの輸出業者が大きなシェアを維持しており、現地の精米業者に効率と品質の改善を迫っています。アフリカ大陸自由貿易地域(AfCFTA)の下でのインフラ整備により、輸送コストが削減され、地域の水稲取引が増加すると予想されます。こうした変化は、アフリカの外部供給業者への依存度を低下させ、地域の米サプライチェーンを変革する可能性があります。
アフリカのコメ市場動向と洞察
カロリーの高い主食に対する都市部の需要の爆発的増加
アフリカにおける都市人口の増加は米の消費パターンを変化させ、贅沢品から日常的な主食へと変貌を遂げつつあります。ナイジェリアの家庭では、伝統的なアジアの米消費国と同様の米消費習慣が見られるようになりました。パーボイルド・ライスは、調理時間の短縮と熱帯条件下での保存安定性の高さから、都市部の消費者の間で人気を博しています。ガーナの主食輸出制限をはじめとする最近の政策変更は、国内需要と供給のギャップ拡大を浮き彫りにしています。都市部の市場は、高価格で取引される高級長粒種を導入することで対応しており、色彩選別機や精米機などの高度な米加工設備への投資を支援しています。都市部のスーパーマーケットに米を供給する精米業者は、現地での生産コストの上昇を補う利益率を達成できるようになりました。
小規模重力灌漑と太陽熱灌漑の拡大
アフリカの米の収量は、歴史的に不安定な降雨パターンに依存してきました。中国の農業インフラへの投資に支えられたタンザニアの灌漑システムへの移行は、体系的な水管理への大陸的なシフトを象徴しています。マリとセネガルでは、太陽電池式の灌漑ポンプを導入したことで、従来の雨に依存した農業に比べて水稲の収量が増加しました。マダガスカルの高地では、重力灌漑の運河システムを利用し、小規模農家の運営コストを削減しています。2024年、アフリカ開発銀行はガンビアの食糧安全保障プロジェクトに1,200万米ドルを割り当て、灌漑稲作を1,500ヘクタール拡大した。こうした灌漑開発により、年間を通じて継続的な栽培が可能になり、労働生産性が向上し、この地域の米の輸入依存度が低下します。
初歩的な乾燥・貯蔵システムによるポストハーベスト損失
アフリカのコメ生産は、農家の所得を減らし、消費者価格を上昇させるポストハーベスト・ロスによる大きな課題に直面しています。一般的な天日乾燥方式では、穀物が害虫や天候によるダメージにさらされ、麻袋での保管では水分の再吸収が起こり、カビや腐敗の原因となります。機械式乾燥機や密閉式サイロは効果的な解決策だが、初期投資コストが高いため、普及には限界があります。リベリアにおけるアフリカ開発銀行の取り組みは、乾燥、製粉、貯蔵施設を備えた統合加工ハブの設立を通じて、前向きな進展を示しています。都市部の小売業者が安定した品質の穀物を求め、品質にばらつきがあると罰則を課すため、このようなインフラの拡充は不可欠です。
その他の特典:
- エクセル形式の市場予測(ME)シート
- 3ヶ月間のアナリストサポート
よくあるご質問
目次
第1章 イントロダクション
- 調査の前提条件と市場の定義
- 調査範囲
第2章 調査手法
第3章 エグゼクティブサマリー
第4章 市場情勢
- 市場概要
- 市場促進要因
- カロリーの高い主食に対する都市部の需要の爆発的増加
- 小規模重力灌漑と太陽熱灌漑の拡大
- AfCFTA関税引き下げによりアフリカ域内の水稲貿易が加速
- 収量を回復させる公的肥料/種子助成プログラム
- 洪水耐性早生米遺伝子の採用
- 自主的炭素クレジットによる水田メタン削減の収益化
- 市場抑制要因
- 初歩的な乾燥・貯蔵システムによるポストハーベストロス
- 国内生産コストは依然としてアジア輸入平価を上回る
- 為替とディーゼル価格の変動が製粉マージンを圧迫
- 長期的な農場投資を制限する土地所有権の不安
- バリュー/サプライチェーン分析
- 規制情勢
- テクノロジーの展望
- PESTEL分析
第5章 市場規模と成長予測(金額および数量)
- 地域別(生産分析、消費分析(数量と金額)、輸入分析(数量と金額)、輸出分析(数量と金額)、価格動向分析)
- ナイジェリア
- タンザニア
- コートジボワール
- マダガスカル
- マリ
- ガーナ
- セネガル
- カメルーン
- ギニア
- シエラレオネ
- ニジェール
- 南アフリカ
第6章 競合情勢
- List of Stakeholders

