
|
市場調査レポート
商品コード
1693542
アジア太平洋の肥料:市場シェア分析、産業動向、成長予測(2025年~2030年)Asia-Pacific Fertilizers - Market Share Analysis, Industry Trends & Statistics, Growth Forecasts (2025 - 2030) |
||||||
カスタマイズ可能
適宜更新あり
|
|||||||
| アジア太平洋の肥料:市場シェア分析、産業動向、成長予測(2025年~2030年) |
|
出版日: 2025年03月18日
発行: Mordor Intelligence
ページ情報: 英文 354 Pages
納期: 2~3営業日
|

全表示
- 概要
- 目次
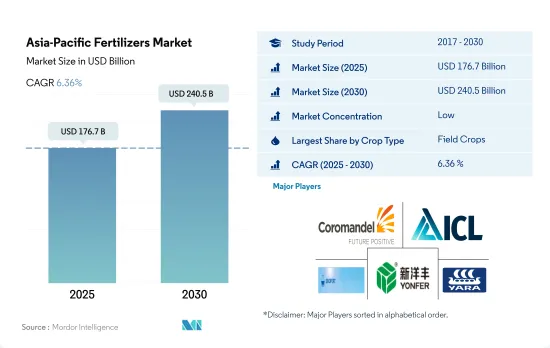
アジア太平洋の肥料市場規模は2025年に1,767億米ドルと推定され、2030年には2,405億米ドルに達すると予測され、予測期間中(2025~2030年)のCAGRは6.36%で成長します。
集約耕作と土壌養分の枯渇が肥料消費を増加させる
- アジア太平洋の肥料市場は畑作物が中心で、肥料市場全体の約81.5%を占めています。畑作物の生産は、この地域の総農地の90.0%以上を占めています。この地域で生産されている主要畑作物は、米、小麦、大豆、菜種/カノーラ、綿花です。一般に、畑作物は窒素肥料を最も多く消費します。穀物や穀類は集中的に栽培されるため、土壌養分を枯渇させ、それを補うために多くの肥料を使用する必要があります。
- 2022年には、園芸作物がこの地域の肥料市場額の17.9%を占めました。中国とインドがこの地域の園芸作物生産面積の70.0%以上を占めています。新鮮果物や野菜に対する需要の高まりは、この需要を満たす努力と相まって、園芸作物市場を推進する態勢を整えています。
- 中国とインドは、豊富な耕地と大規模な人口を有し、アジア太平洋における主要な農業参入企業として際立っています。農業の機械化と生産性向上に対する政府の多額の財政支援は、この成長軌道をさらに後押ししています。
- 同地域では耕作面積の増加が顕著で、2017~2022年にかけては1,050万haの拡大が見込まれています。農業はアジア太平洋の人口の5分の1を雇用し、国土の半分以上を占めているため、アジア太平洋経済に不可欠な貢献をしています。食糧安全保障の強化は、気候条件の変化や土壌養分の課題と相まって、この地域の肥料市場に拍車をかけることになります。
人口増加による食糧増産と生産性向上へのニーズが市場を牽引する可能性
- 米国農務省によると、世界最大の肥料生産・輸出国である中国は、世界の肥料生産量の25%を占めています。2022年、中国の肥料市場規模は703億米ドル、消費量は9,420万トンでした。
- 世界第2位の肥料消費国であるインドは、2022年に8,140万トンを消費します。インドは世界第3位の生産国であるにもかかわらず、年間尿素の25%、リンの55%、カリの100%を輸入に頼っています。
- インドネシアの農業セクタは大幅に拡大しており、耕地面積が増加しています。その結果、同国の農業生産は増加し、この地域の農業に欠かせない存在となっています。その結果、インドネシアは市場金額と消費量において第3位の消費国となり、この地域の市場金額の5.6%、消費量の6.7%を占めています。
- 2022年には、パキスタンがアジア太平洋の肥料市場で4.2%のシェアを占めていました。畑作物が肥料消費量の86.3%を占め、次いで園芸作物が13.5%、芝・観賞用作物はわずか0.1%です。この動向は、畑作物の栽培面積が大きいことに起因しています。
- 特に、耕作に利用できる面積が減少しているため、より高い食糧生産と生産性を求める人口の増加といった要因が市場を牽引すると予想されます。さらに、先進的な栽培方法の採用により、従来型肥料と特殊肥料の両方の使用量が増加します。
アジア太平洋の肥料市場動向
栽培面積の増加は国内と輸出需要の増加に起因する
- アジア太平洋では畑作物が栽培されており、総栽培面積の95%以上を占めています。米、小麦、トウモロコシがこの地域で生産される主要な畑作物で、2022年には合計で総栽培面積の約38%を占めます。耕作面積の増加は、同国における肥料使用の必要性を高めると予想されます。
- 中国、インド、パキスタン、オーストラリアを含むアジア太平洋は、世界最大の小麦生産国のひとつです。中国とインドは、世界最大の小麦生産国であり消費国でもあります。小麦はこの地域の主要な主食のひとつであり、需要と消費の増加を牽引しています。注目すべきは、小麦の栽培面積が2018~2022年にかけて63万8,600ha増加したことです。2022年、中国は1億3,800万トンの小麦生産を占め、世界最大の小麦生産国となり、インドは1億300万トンの小麦生産を記録しました。
- コメはこの地域で最大の畑作作物です。その栽培面積だけで2022年の全農地面積の約16.44%を占めています。コメはアジアと太平洋のほとんどの地域で主食となっています。中国は2022年に1億4,700万トンの米を生産し、インドは1億2,400万トンの米を収穫すると予測されています。また、インドは1億900万トンを消費する一方、世界最多の1,950万トンを輸出すると予想されました。
- 畑作物に対する国内外の需要の急増は、畑作物専用の耕作面積の拡大を促しています。この耕作地の大幅な増加は、2023~2030年の期間を通じてアジア太平洋の肥料市場に直接的かつプラスの影響を与えると予想されます。
世界の耕作地からの亜酸化窒素排出量の約28%は中国の耕作地によるものです。
- 中国の畑作物における一次養分(窒素、カリウム、リン)の平均施用量は、2022年には129.1kg/haとなりました。窒素が58.5%を占め、カリウムが25.3%、リンが16.1%と続きます。一次養分は主に土壌ベースの方法で施用されます。2022年には、従来の土壌ベースの一次多量栄養素肥料が一次多量栄養素肥料市場の69.2%という圧倒的なシェアを占めていました。
- アジアでは、一次栄養素、特に窒素肥料とカリ肥料に対する大きな需要が見られるが、これは同地域の土壌でこれらの栄養素が広く欠乏しているためです。特筆すべきは、広大な土地と人口を有するアジア太平洋が、世界の農薬生産と消費をリードしていることです。中国の農地だけで、世界の農地からの亜酸化窒素排出量の約28%を占めています。
- 畑作物の中で、小麦は2022年に214.9kg/haの平均一次養分施用量で最高を記録しました。一次養分の中では窒素がトップで、平均施用量は448.5 kg/haでした。この窒素需要の高さは、植物の代謝に重要な役割を果たし、葉緑素やアミノ酸に含まれていることに起因しています。
- 窒素とリンによる地表水と地下水の汚染は、施肥量に関する不適切な指導と、過剰な作物収量の可能性に関連しています。しかし、高効率肥料の採用へのシフトは顕著です。
アジア太平洋の肥料産業概要
アジア太平洋の肥料市場はセグメント化されており、上位5社で5.83%を占めています。この市場の主要企業は、Coromandel International Ltd.、ICL Group Ltd、Sinofert Holdings Limited、Xinyangfeng Agricultural Technology、Yara International ASAなどです。
その他の特典
- エクセル形式の市場予測(ME)シート
- 3ヶ月のアナリストサポート
目次
第1章 エグゼクティブサマリーと主要調査結果
第2章 レポートのオファー
第3章 イントロダクション
- 調査の前提条件と市場定義
- 調査範囲
- 調査手法
第4章 主要産業動向
- 主要作物の作付面積
- 畑作物
- 園芸作物
- 平均養分施用率
- 微量栄養素
- 畑作物
- 園芸作物
- 一次栄養素
- 畑作物
- 園芸作物
- 二次多量栄養素
- 畑作物
- 園芸作物
- 微量栄養素
- 灌漑農地
- 規制の枠組み
- バリューチェーンと流通チャネル分析
第5章 市場セグメンテーション
- タイプ
- 複合型
- ストレート
- 微量栄養素
- ホウ素
- 銅
- 鉄
- マンガン
- モリブデン
- 亜鉛
- その他
- 窒素
- 硝酸アンモニウム
- 無水アンモニア
- 尿素
- その他
- リン酸
- DAP
- MAP
- SSP
- TSP
- その他
- ポタシス
- MoP
- SoP
- その他
- 二次栄養素
- カルシウム
- マグネシウム
- 硫黄
- 形態
- 従来型
- 特殊
- CRF
- 液体肥料
- SRF
- 水溶性
- 施肥モード
- 施肥
- 葉面散布
- 土壌
- 作物タイプ
- 畑作物
- 園芸作物
- 芝・観賞用
- 生産国
- オーストラリア
- バングラデシュ
- 中国
- インド
- インドネシア
- 日本
- パキスタン
- フィリピン
- タイ
- ベトナム
- その他のアジア太平洋
第6章 競合情勢
- 主要な戦略動向
- 市場シェア分析
- 企業情勢
- 企業プロファイル
- Coromandel International Ltd.
- Grupa Azoty S.A.(Compo Expert)
- Haifa Group
- Hebei Sanyuanjiuqi Fertilizer Co., Ltd.
- ICL Group Ltd
- Sinofert Holdings Limited
- Sociedad Quimica y Minera de Chile SA
- Xinyangfeng Agricultural Technology Co., Ltd.
- Yara International ASA
- Zhongchuang xingyuan chemical technology co.ltd
第7章 CEOへの主要戦略的質問
第8章 付録
- 世界概要
- 概要
- ファイブフォース分析フレームワーク
- 世界のバリューチェーン分析
- 市場力学(DROs)
- 情報源と参考文献
- 図表一覧
- 主要な洞察
- データパック
- 用語集
The Asia-Pacific Fertilizers Market size is estimated at 176.7 billion USD in 2025, and is expected to reach 240.5 billion USD by 2030, growing at a CAGR of 6.36% during the forecast period (2025-2030).
Intensive cultivation and soil nutrient depletion increase fertilizer consumption
- The Asia-Pacific fertilizer market is dominated by field crops, which make up around 81.5% of the overall fertilizer market. Field crop production accounts for more than 90.0% of the region's total agricultural land. The major field crops produced in the region are rice, wheat, soybean, rapeseed/canola, and cotton. Generally, field crops consume the most nitrogen fertilizers. Because grains and cereals are grown intensively, they deplete soil nutrients, necessitating the use of more fertilizers to compensate.
- In 2022, horticultural crops constituted 17.9% of the region's fertilizer market value. China and India command over 70.0% of the horticultural crop production area in the region. The rising demand for fresh fruits and vegetables, coupled with efforts to meet this demand, is poised to propel the horticultural crop market.
- China and India, with their abundant arable land and sizable populations, stand out as key agricultural players in the Asia-Pacific. The government's significant financial support for agricultural mechanization and productivity enhancement further bolsters this growth trajectory.
- The region has witnessed a notable uptick in cultivation area, with a 10.5 million ha expansion from 2017 to 2022. Agriculture employs a fifth of the region's population and occupies more than half of its land, making it a vital contributor to the Asia-Pacific economy. The imperative to enhance food security, coupled with evolving climatic conditions and soil nutrient challenges, is poised to fuel the fertilizer market in the region.
The growing population's need for higher food production and productivity may drive the market
- According to the USDA, China, the world's largest fertilizer producer and exporter, accounted for 25% of global fertilizer production. In 2022, the Chinese fertilizer market was valued at USD 70.3 billion, with a consumption of 94.2 million metric tons.
- India, the world's second-largest fertilizer consumer, consumed 81.4 million metric tons in 2022. Despite being the third-largest global producer, India relies on imports for 25% of its urea, 55% of its phosphorus, and 100% of its potash annually.
- The Indonesian agricultural sector has been experiencing a considerable expansion, which has led to an increase in arable land. This, in turn, has boosted the country's agricultural production, making it an essential player in the region's agricultural industry. As a result, Indonesia has become the third-largest consumer in terms of market value and volume consumption, accounting for 5.6% of the value and 6.7% of volume in the region.
- In 2022, Pakistan held a 4.2% share in the Asia-Pacific fertilizer market. Field crops dominated fertilizer consumption, accounting for 86.3% of the volume, followed by horticultural crops at 13.5% and turf & ornamental crops at a negligible 0.1%. This trend can be attributed to the larger land area dedicated to field crops.
- The market is expected to be driven by factors such as the growing population's need for higher food production and productivity, especially since the area available for cultivation is decreasing. Additionally, the adoption of advanced cultivation methods will increase the usage of both conventional and specialty fertilizers.
Asia-Pacific Fertilizers Market Trends
The increase in cultivation area is attributed to the growing domestic and export demand
- Field crop cultivation dominates the Asia-Pacific region, accounting for more than 95% of the total crop area. Rice, wheat, and corn are the major field crops produced in the region, together accounting for about 38% of the total crop area in 2022. The rising area under cultivation is expected to increase the need for fertilizer usage in the country.
- The Asia-Pacific region, which includes China, India, Pakistan, and Australia, is among the world's largest wheat producers. China and India are also the world's largest wheat producers and consumers. Wheat is one of the major staple foods of this region, driving the increase in demand and consumption. Notably, the area under wheat cultivation increased by 638.6 thousand ha from 2018 to 2022. In 2022, China accounted for the production of 138 million metric tons of wheat, making it the largest wheat producer in the world, and India recorded wheat production of 103 million metric tons.
- Rice is the largest cultivated field crop in the region. Its cultivation alone accounted for about 16.44% of the total agricultural land in 2022. Rice is the staple food of Asia and most parts of the Pacific region. China was projected to produce 147 million tons of rice, and India was expected to harvest 124 million tons of rice in 2022. India was also expected to consume 109 million tons while exporting a world-leading 19.5 million tons.
- The surge in both domestic and international demand for field crops has prompted an expansion in the cultivation area dedicated to these crops. This significant increase in cultivated land is expected to have a direct and positive impact on the Asia-Pacific fertilizer market throughout the 2023-2030 period.
About 28% of nitrous oxide emissions from cropland globally are from Chinese agricultural lands
- The average application rate of primary nutrients (nitrogen, potassium, and phosphorus) in field crops in China stood at 129.1 kg/ha in 2022. Nitrogen dominated the mix, accounting for 58.5%, followed by potassium at 25.3% and phosphorus at 16.1%. The primary nutrients are predominantly applied through soil-based methods. In 2022, conventional soil-based primary macronutrient fertilizers held a commanding 69.2% share of the primary macronutrient fertilizer market.
- Asia witnesses a significant demand for primary nutrients, especially nitrogen and potassium fertilizers, owing to the prevalent deficiencies in these nutrients in the region's soils. Notably, the Asia-Pacific region, with its vast land area and population, leads the global agrochemical production and consumption. China's agricultural lands alone contribute to about 28% of the world's nitrous oxide emissions from croplands.
- Among field crops, wheat recorded the highest average primary nutrient application rate at 214.9 kg/ha in 2022. Nitrogen took the lead among primary nutrients, with an average application rate of 448.5 kg/ha. This high nitrogen demand is attributed to its crucial role in plant metabolism, as well as its presence in chlorophyll and amino acids.
- The contamination of surface and groundwater with nitrogen and phosphorus has been linked to inadequate guidance on fertilizer application rates and the potential for excessive crop yields. However, there is a noticeable shift toward the adoption of highly efficient fertilizers.
Asia-Pacific Fertilizers Industry Overview
The Asia-Pacific Fertilizers Market is fragmented, with the top five companies occupying 5.83%. The major players in this market are Coromandel International Ltd., ICL Group Ltd, Sinofert Holdings Limited, Xinyangfeng Agricultural Technology Co., Ltd. and Yara International ASA (sorted alphabetically).
Additional Benefits:
- The market estimate (ME) sheet in Excel format
- 3 months of analyst support
TABLE OF CONTENTS
1 EXECUTIVE SUMMARY & KEY FINDINGS
2 REPORT OFFERS
3 INTRODUCTION
- 3.1 Study Assumptions & Market Definition
- 3.2 Scope of the Study
- 3.3 Research Methodology
4 KEY INDUSTRY TRENDS
- 4.1 Acreage Of Major Crop Types
- 4.1.1 Field Crops
- 4.1.2 Horticultural Crops
- 4.2 Average Nutrient Application Rates
- 4.2.1 Micronutrients
- 4.2.1.1 Field Crops
- 4.2.1.2 Horticultural Crops
- 4.2.2 Primary Nutrients
- 4.2.2.1 Field Crops
- 4.2.2.2 Horticultural Crops
- 4.2.3 Secondary Macronutrients
- 4.2.3.1 Field Crops
- 4.2.3.2 Horticultural Crops
- 4.2.1 Micronutrients
- 4.3 Agricultural Land Equipped For Irrigation
- 4.4 Regulatory Framework
- 4.5 Value Chain & Distribution Channel Analysis
5 MARKET SEGMENTATION (includes market size in Value in USD and Volume, Forecasts up to 2030 and analysis of growth prospects)
- 5.1 Type
- 5.1.1 Complex
- 5.1.2 Straight
- 5.1.2.1 Micronutrients
- 5.1.2.1.1 Boron
- 5.1.2.1.2 Copper
- 5.1.2.1.3 Iron
- 5.1.2.1.4 Manganese
- 5.1.2.1.5 Molybdenum
- 5.1.2.1.6 Zinc
- 5.1.2.1.7 Others
- 5.1.2.2 Nitrogenous
- 5.1.2.2.1 Ammonium Nitrate
- 5.1.2.2.2 Anhydrous Ammonia
- 5.1.2.2.3 Urea
- 5.1.2.2.4 Others
- 5.1.2.3 Phosphatic
- 5.1.2.3.1 DAP
- 5.1.2.3.2 MAP
- 5.1.2.3.3 SSP
- 5.1.2.3.4 TSP
- 5.1.2.3.5 Others
- 5.1.2.4 Potassic
- 5.1.2.4.1 MoP
- 5.1.2.4.2 SoP
- 5.1.2.4.3 Others
- 5.1.2.5 Secondary Macronutrients
- 5.1.2.5.1 Calcium
- 5.1.2.5.2 Magnesium
- 5.1.2.5.3 Sulfur
- 5.2 Form
- 5.2.1 Conventional
- 5.2.2 Speciality
- 5.2.2.1 CRF
- 5.2.2.2 Liquid Fertilizer
- 5.2.2.3 SRF
- 5.2.2.4 Water Soluble
- 5.3 Application Mode
- 5.3.1 Fertigation
- 5.3.2 Foliar
- 5.3.3 Soil
- 5.4 Crop Type
- 5.4.1 Field Crops
- 5.4.2 Horticultural Crops
- 5.4.3 Turf & Ornamental
- 5.5 Country
- 5.5.1 Australia
- 5.5.2 Bangladesh
- 5.5.3 China
- 5.5.4 India
- 5.5.5 Indonesia
- 5.5.6 Japan
- 5.5.7 Pakistan
- 5.5.8 Philippines
- 5.5.9 Thailand
- 5.5.10 Vietnam
- 5.5.11 Rest of Asia-Pacific
6 COMPETITIVE LANDSCAPE
- 6.1 Key Strategic Moves
- 6.2 Market Share Analysis
- 6.3 Company Landscape
- 6.4 Company Profiles
- 6.4.1 Coromandel International Ltd.
- 6.4.2 Grupa Azoty S.A. (Compo Expert)
- 6.4.3 Haifa Group
- 6.4.4 Hebei Sanyuanjiuqi Fertilizer Co., Ltd.
- 6.4.5 ICL Group Ltd
- 6.4.6 Sinofert Holdings Limited
- 6.4.7 Sociedad Quimica y Minera de Chile SA
- 6.4.8 Xinyangfeng Agricultural Technology Co., Ltd.
- 6.4.9 Yara International ASA
- 6.4.10 Zhongchuang xingyuan chemical technology co.ltd
7 KEY STRATEGIC QUESTIONS FOR FERTILIZER CEOS
8 APPENDIX
- 8.1 Global Overview
- 8.1.1 Overview
- 8.1.2 Porter's Five Forces Framework
- 8.1.3 Global Value Chain Analysis
- 8.1.4 Market Dynamics (DROs)
- 8.2 Sources & References
- 8.3 List of Tables & Figures
- 8.4 Primary Insights
- 8.5 Data Pack
- 8.6 Glossary of Terms

