
|
市場調査レポート
商品コード
1693556
インドの肥料:市場シェア分析、産業動向・統計、成長予測(2025年~2030年)India Fertilizers - Market Share Analysis, Industry Trends & Statistics, Growth Forecasts (2025 - 2030) |
||||||
カスタマイズ可能
適宜更新あり
|
|||||||
| インドの肥料:市場シェア分析、産業動向・統計、成長予測(2025年~2030年) |
|
出版日: 2025年03月18日
発行: Mordor Intelligence
ページ情報: 英文 286 Pages
納期: 2~3営業日
|

全表示
- 概要
- 目次
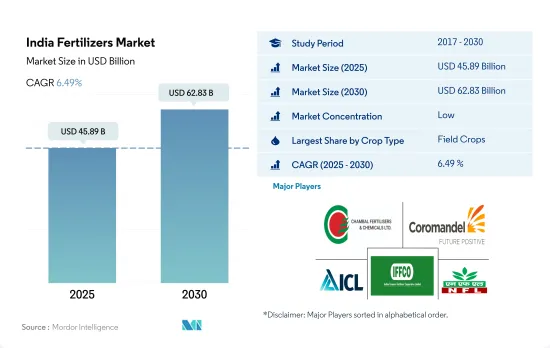
インドの肥料市場規模は2025年に458億9,000万米ドルと推定され、2030年には628億3,000万米ドルに達すると予測され、予測期間中(2025~2030年)のCAGRは6.49%で成長する見込みです。
米はNPKを消費する主要作物であり、国の肥料需要を牽引すると予想されます。
- 2022年には畑作用肥料が市場の89.2%を占め、2023~2030年のCAGRは9.8%を記録すると予測されます。主要な畑作物である米は栽培面積の大幅な急増を目の当たりにし、2022年の作付面積は4,700万ヘクタールと、2017年から93.1%増加しました。米がNPK肥料に大きく依存していることから、米は同国の肥料需要の主要な牽引役となることが予想されます。
- 畑作物の栽培面積は、2017年の1億8,700万ヘクタールから2022年には1億9,400万ヘクタールに拡大します。畑作物の中でも穀物が大きなシェアを占めています。増加する人口を養う必要性から畑作物の栽培が急増しており、インドの肥料市場を今後数年間押し上げると予想されます。
- 2022年、園芸作物用肥料はインドの肥料市場の10.5%を占め、50億2,000万米ドルと評価されました。園芸作物の栽培面積は緩やかに増加し、2017年の860万ヘクタールから2022年には890万ヘクタールに達します。このような園芸作物の栽培面積の増加は、収量の最大化を目的とした肥料消費量の並行的な増加を伴っています。
- インドの芝・観賞作物用肥料分野は、ごく一部ではあるが、2021年には7,480万米ドルと評価されました。政府は自給自足を重視しており、温室での観賞用花の生産を促進するなどの取り組みを行っており、この分野の潜在的成長を示唆しています。
- 主要な畑作物に対する需要の高まりと果物や芝の栽培面積の拡大により、このセグメントは大きく成長する態勢が整っています。2023~2030年のCAGR予測は、畑作物が6.4%、果物・芝が4.0%です。
インドの肥料市場動向
国内外の消費者需要の高まりがインドの作付面積増加の主要因
- 調査期間中、インドでは畑作物の栽培面積が6%増加しました。国内外の消費者需要による穀物、豆類、油糧種子の栽培の急増が、作付面積の拡大に重要な役割を果たしました。
- 作物別に見ると、2022年には米が25.4%、小麦が17.4%、大豆が7.5%を占め、インドの農業を支配しています。インドの主食である米は大きなシェアを占めており、作付面積全体の4分の1を占め、人口の半分近くを養っています。西ベンガル州、ウッタル・プラデシュ州、アンドラ・プラデシュ州、パンジャブ州、タミル・ナードゥ州を中心に、全国で栽培されています。しかし、インドの米生産量は2022年のカリフシーズンには6%(1億499万トン)減少しました。これは主に、降雨不足に悩むジャールカンド州、マディヤ・プラデシュ州、西ベンガル州などの水田面積が減少したためです。
- パンジャブ州、西ベンガル州、ハリヤナ州、ラジャスタン州がインドにおける主要な小麦耕作地として浮上します。2017年から2022年にかけて、インドの小麦栽培は5%増加しました。しかし、小麦生産量は前年の1億959万トンから2022年には1億774万トンに減少します。この減少は、インド北部、中部、西部の肥沃な平原を襲った豪雨と雹嵐に起因します。これらの自然災害は、小麦を含む成熟期の冬植え作物に大きな被害を与え、農家に大きな損失をもたらしました。
- インドの穀物栽培が堅調で、国内外の需要が急増していることから、インドの肥料市場は2023年から2030年にかけて成長する見込みです。
主要栄養素のうち、窒素は畑作で最も施用されている栄養素であり、平均施用量は1ヘクタール当たり223.5kgです。
- 2021年の一次栄養素の平均施用量は125.1kg/haでした。特筆すべきは窒素で、平均施用量は223.5kg/haでトップです。稲のような作物の集約的な栽培を考えれば、重要な栄養素である窒素が極めて重要な役割を果たすのは当然です。しかし、土壌中のこの栄養素の欠乏は、全国的に稲の生産性を妨げています。
- バイオ肥料と有機肥料の現状』報告書で強調されているように、インドの土壌の健全性は懸念材料です。それによると、化学肥料の消費量が増加傾向にあり、検査した土壌の97.0%、83.0%、71.0%がそれぞれ窒素、リン、カリウムの不足を示しています。
- 主要作物では、小麦、米、トウモロコシが2021年の養分施用量のトップで、それぞれ平均231kg/ha、156kg/ha、149kg/haでした。小麦と米は国内でも世界的にも主食であるが、複数の養分不足により収量と利益の大幅な減少に直面しています。これらの作物は、窒素、リン、カリウムのほかに、最適な生育のために硫黄、ホウ素、鉄、亜鉛などの微量栄養素にも依存しています。作物生産を成功させる上で養分管理が重要な役割を果たすことから、市場は成長を遂げています。
- 畑作物、特に穀物や穀類は、一次栄養素、特に窒素肥料を貪欲に必要とします。これらの作物の大規模な栽培により土壌の栄養分が枯渇しているため、2023年から2030年にかけて肥料の需要が急増し、市場の成長を牽引すると予想されます。
インドの肥料産業の概要
インドの肥料市場は細分化されており、上位5社で27.78%を占めています。この市場の主要企業は以下の通りです。 Chambal Fertilizers & Chemicals Ltd, Coromandel International Ltd., ICL Group Ltd, Indian Farmers Fertiliser Cooperative Limited and National Fertilizers Ltd(アルファベット順)
その他の特典
- エクセル形式の市場予測(ME)シート
- 3ヶ月のアナリストサポート
目次
第1章 エグゼクティブサマリーと主な調査結果
第2章 レポートのオファー
第3章 イントロダクション
- 調査の前提条件と市場定義
- 調査範囲
- 調査手法
第4章 主要産業動向
- 主要作物の作付面積
- 畑作物
- 園芸作物
- 平均養分施用率
- 微量栄養素
- 畑作物
- 園芸作物
- 一次栄養素
- 畑作物
- 園芸作物
- 二次多量栄養素
- 畑作物
- 園芸作物
- 微量栄養素
- 灌漑農地
- 規制の枠組み
- バリューチェーンと流通チャネル分析
第5章 市場セグメンテーション
- タイプ
- 複合型
- ストレート
- 微量栄養素
- ホウ素
- 銅
- 鉄
- マンガン
- モリブデン
- 亜鉛
- その他
- 窒素
- 尿素
- その他
- リン酸
- DAP
- MAP
- SSP
- その他
- カリウム
- MoP
- 二次栄養素
- カルシウム
- マグネシウム
- 硫黄
- 形態
- 従来型
- 特殊
- CRF
- 液体肥料
- SRF
- 水溶性
- 施肥モード
- 施肥
- 葉面散布
- 土壌
- 作物タイプ
- 畑作物
- 園芸作物
- 芝・観賞用
第6章 競合情勢
- 主要な戦略動向
- 市場シェア分析
- 企業情勢
- 企業プロファイル
- Chambal Fertilizers & Chemicals Ltd
- Coromandel International Ltd.
- Gujarat Narmada Valley Fertilizers & Chemicals Ltd
- Haifa Group
- ICL Group Ltd
- Indian Farmers Fertiliser Cooperative Limited
- National Fertilizers Ltd
- Rashtriya Chemicals & Fertilizers Ltd
- Sociedad Quimica y Minera de Chile SA
- Yara International ASA
第7章 CEOへの主な戦略的質問
第8章 付録
- 世界概要
- 概要
- ファイブフォース分析フレームワーク
- 世界のバリューチェーン分析
- 市場力学(DROs)
- 情報源と参考文献
- 図表一覧
- 主要洞察
- データパック
- 用語集
The India Fertilizers Market size is estimated at 45.89 billion USD in 2025, and is expected to reach 62.83 billion USD by 2030, growing at a CAGR of 6.49% during the forecast period (2025-2030).
Rice is a major NPK-consuming crop that is expected to drive the nation's fertilizer demand
- In 2022, field crop fertilizers dominated the market, accounting for 89.2%, and are projected to record a CAGR of 9.8% during 2023-2030. Rice, the leading field crop, witnessed a substantial surge in cultivation, with 47 million hectares planted in 2022, marking a 93.1% increase from 2017. Given rice's significant reliance on NPK fertilizers, it is poised to be a key driver of fertilizer demand in the country.
- The area dedicated to field crops expanded from 187 million hectares in 2017 to 194 million hectares by 2022. Cereals, within the field crop category, commanded a substantial share. This surge in field crop cultivation, driven by the need to feed a growing population, is expected to propel India's fertilizer market in the coming years.
- In 2022, horticultural crop fertilizers represented 10.5% of the Indian fertilizer market, valued at USD 5.02 billion. The area under horticulture cultivation witnessed a modest rise, reaching 8.9 million hectares in 2022 from 8.6 million hectares in 2017. This uptick in horticulture acreage is accompanied by a parallel rise in fertilizer consumption aimed at maximizing yields.
- The turf and ornamental crop fertilizer segment in India, though a small fraction, was valued at USD 74.8 million in 2021. The government's emphasis on self-sufficiency has led to initiatives like promoting greenhouse ornamental flower production, hinting at potential growth in this segment.
- With the rising demand for major field crops and the expansion of fruit and turf cultivation areas, this segment is poised for significant growth. The projected CAGR during 2023-2030 is 6.4% for field crops and 4.0% for fruits and turf.
India Fertilizers Market Trends
The rising consumer demand domestically and internationally is the major driving factor for the rising acreage in India
- During the study period, the country witnessed a 6% increase in field crop cultivation. This surge in the cultivation of cereals, pulses, and oilseeds, driven by both domestic and international consumer demand, played a pivotal role in expanding the acreage.
- Breaking down the crops, rice, wheat, and soybean dominated the country's agricultural landscape in 2022, accounting for 25.4%, 17.4%, and 7.5%, respectively. Rice, a staple in India, commands a significant share, covering a quarter of the total cropped area and feeding nearly half the population. It finds cultivation across the nation, with key states being West Bengal, Uttar Pradesh, Andhra Pradesh, Punjab, and Tamil Nadu. However, India's rice production dipped by 6% (104.99 million tons) in the kharif season of 2022, primarily due to reduced paddy acreage in states like Jharkhand, Madhya Pradesh, and West Bengal, grappling with rainfall deficits.
- Punjab, West Bengal, Haryana, and Rajasthan emerge as the primary wheat cultivators in India. From 2017 to 2022, wheat cultivation in India witnessed a 5% increase. However, the wheat output dipped to 107.74 million tonnes in 2022 from the previous year's 109.59 million tonnes. This decline can be attributed to heavy rainfall and hailstorms that battered the fertile plains of northern, central, and western India. These natural calamities inflicted significant damage on the maturing winter-planted crops, including wheat, leading to substantial losses for farmers.
- Given the robust cereal cultivation in India, bolstered by surging domestic and international demand, the Indian fertilizer market is poised for growth during 2023-2030.
Among the primary nutrients, nitrogen is the most-applied nutrient in field crops, with an average application rate of 223.5 kg per hectare
- In 2021, the average application rate for primary nutrients stood at 125.1 kg/ha. Notably, nitrogen topped the list with an average application rate of 223.5 kg/ha. Given the intensive cultivation of crops like rice in the country, it is no surprise that nitrogen, being a crucial nutrient, plays a pivotal role. However, the deficiency of this nutrient in the soil is hampering rice productivity nationwide.
- The soil health in India, as highlighted in the State of Biofertilizers and Organic Fertilizers report, is a cause for concern. It reveals a rising trend in the consumption of chemical fertilizers, with 97.0%, 83.0%, and 71.0% of tested soils showing deficiencies in nitrogen, phosphorous, and potassium, respectively.
- Among the major crops, wheat, rice, and corn/maize led the pack in nutrient application rates in 2021, with averages of 231, 156, and 149 kg/ha, respectively. Wheat and rice, being staple foods both domestically and globally, face significant yield and profit reductions due to multiple nutrient deficiencies. Apart from nitrogen, phosphorous, and potassium, these crops also rely on micronutrients like sulfur, boron, iron, and zinc for optimal growth. Given the critical role of nutrient management in successful crop production, the market is witnessing growth.
- Field crops, especially grains and cereals, have a voracious appetite for primary nutrients, particularly nitrogen fertilizers. With the extensive cultivation of these crops depleting the soil's nutrient content, the demand for fertilizers is expected to surge during 2023-2030, driving market growth.
India Fertilizers Industry Overview
The India Fertilizers Market is fragmented, with the top five companies occupying 27.78%. The major players in this market are Chambal Fertilizers & Chemicals Ltd, Coromandel International Ltd., ICL Group Ltd, Indian Farmers Fertiliser Cooperative Limited and National Fertilizers Ltd (sorted alphabetically).
Additional Benefits:
- The market estimate (ME) sheet in Excel format
- 3 months of analyst support
TABLE OF CONTENTS
1 EXECUTIVE SUMMARY & KEY FINDINGS
2 REPORT OFFERS
3 INTRODUCTION
- 3.1 Study Assumptions & Market Definition
- 3.2 Scope of the Study
- 3.3 Research Methodology
4 KEY INDUSTRY TRENDS
- 4.1 Acreage Of Major Crop Types
- 4.1.1 Field Crops
- 4.1.2 Horticultural Crops
- 4.2 Average Nutrient Application Rates
- 4.2.1 Micronutrients
- 4.2.1.1 Field Crops
- 4.2.1.2 Horticultural Crops
- 4.2.2 Primary Nutrients
- 4.2.2.1 Field Crops
- 4.2.2.2 Horticultural Crops
- 4.2.3 Secondary Macronutrients
- 4.2.3.1 Field Crops
- 4.2.3.2 Horticultural Crops
- 4.2.1 Micronutrients
- 4.3 Agricultural Land Equipped For Irrigation
- 4.4 Regulatory Framework
- 4.5 Value Chain & Distribution Channel Analysis
5 MARKET SEGMENTATION (includes market size in Value in USD and Volume, Forecasts up to 2030 and analysis of growth prospects)
- 5.1 Type
- 5.1.1 Complex
- 5.1.2 Straight
- 5.1.2.1 Micronutrients
- 5.1.2.1.1 Boron
- 5.1.2.1.2 Copper
- 5.1.2.1.3 Iron
- 5.1.2.1.4 Manganese
- 5.1.2.1.5 Molybdenum
- 5.1.2.1.6 Zinc
- 5.1.2.1.7 Others
- 5.1.2.2 Nitrogenous
- 5.1.2.2.1 Urea
- 5.1.2.2.2 Others
- 5.1.2.3 Phosphatic
- 5.1.2.3.1 DAP
- 5.1.2.3.2 MAP
- 5.1.2.3.3 SSP
- 5.1.2.3.4 Others
- 5.1.2.4 Potassic
- 5.1.2.4.1 MoP
- 5.1.2.5 Secondary Macronutrients
- 5.1.2.5.1 Calcium
- 5.1.2.5.2 Magnesium
- 5.1.2.5.3 Sulfur
- 5.2 Form
- 5.2.1 Conventional
- 5.2.2 Speciality
- 5.2.2.1 CRF
- 5.2.2.2 Liquid Fertilizer
- 5.2.2.3 SRF
- 5.2.2.4 Water Soluble
- 5.3 Application Mode
- 5.3.1 Fertigation
- 5.3.2 Foliar
- 5.3.3 Soil
- 5.4 Crop Type
- 5.4.1 Field Crops
- 5.4.2 Horticultural Crops
- 5.4.3 Turf & Ornamental
6 COMPETITIVE LANDSCAPE
- 6.1 Key Strategic Moves
- 6.2 Market Share Analysis
- 6.3 Company Landscape
- 6.4 Company Profiles
- 6.4.1 Chambal Fertilizers & Chemicals Ltd
- 6.4.2 Coromandel International Ltd.
- 6.4.3 Gujarat Narmada Valley Fertilizers & Chemicals Ltd
- 6.4.4 Haifa Group
- 6.4.5 ICL Group Ltd
- 6.4.6 Indian Farmers Fertiliser Cooperative Limited
- 6.4.7 National Fertilizers Ltd
- 6.4.8 Rashtriya Chemicals & Fertilizers Ltd
- 6.4.9 Sociedad Quimica y Minera de Chile SA
- 6.4.10 Yara International ASA
7 KEY STRATEGIC QUESTIONS FOR FERTILIZER CEOS
8 APPENDIX
- 8.1 Global Overview
- 8.1.1 Overview
- 8.1.2 Porter's Five Forces Framework
- 8.1.3 Global Value Chain Analysis
- 8.1.4 Market Dynamics (DROs)
- 8.2 Sources & References
- 8.3 List of Tables & Figures
- 8.4 Primary Insights
- 8.5 Data Pack
- 8.6 Glossary of Terms

