
|
市場調査レポート
商品コード
1693525
液体肥料:市場シェア分析、産業動向と統計、成長予測(2025年~2030年)Liquid Fertilizer - Market Share Analysis, Industry Trends & Statistics, Growth Forecasts (2025 - 2030) |
||||||
カスタマイズ可能
適宜更新あり
|
|||||||
| 液体肥料:市場シェア分析、産業動向と統計、成長予測(2025年~2030年) |
|
出版日: 2025年03月18日
発行: Mordor Intelligence
ページ情報: 英文 332 Pages
納期: 2~3営業日
|

全表示
- 概要
- 目次
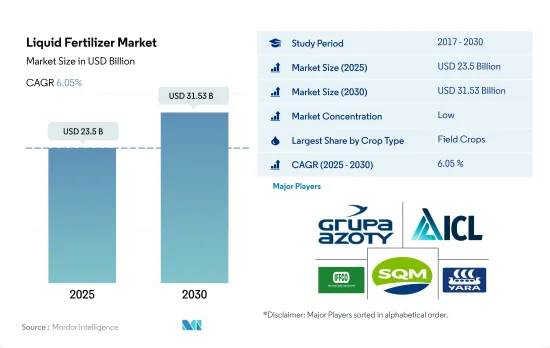
液体肥料市場規模は2025年に235億米ドルと推定・予測され、2030年には315億3,000万米ドルに達し、予測期間中(2025~2030年)のCAGRは6.05%で成長すると予測されます。
畑作物の液体肥料消費が増加
- 畑作物は世界の液体肥料市場を独占し、液体肥料消費量全体の約77.4%を占めました。畑作物の液体肥料消費量は2,060万トンで、2022年には206億米ドルに相当します。畑作物による液体肥料の消費量が多いのは、畑作物の栽培面積が広いためです。世界の農地の85.0%以上が畑作物の栽培に充てられています。
- 園芸作物は液体肥料を消費する第2位の作物であり、2022年の世界の液体肥料消費量の約19.2%を占めます。
- COVID-19の大流行後、健康と栄養への関心が高まるにつれ、果物や野菜のような高価値作物への需要が世界的に高まっています。トマト、ジャガイモ、タマネギ、キャベツ、カリフラワーといった需要の大きい野菜作物は、多量の肥料を消費し、年間を通して栽培されます。葉面散布は果実の品質を向上させることが知られているため、葉面液体肥料は果実作物で重要な役割を果たしています。
- 芝・観賞用作物は世界の液体肥料市場全体の約3.4%を占め、2022年には8億6,390万米ドルとなり、消費量は90万7,200トンとなりました。
- 芝生や観賞用作物の栽培面積は、公害への懸念、庭園における美的景観の重要性の高まり、世界のエコツーリズムによって増加しています。したがって、それぞれの作物タイプにおける液体肥料の世界消費量は、2023~2030年にかけてCAGR 5.1%を記録すると予想されます。
米国がこの地域の液体肥料消費で高い市場シェアを占める
- 2022年、アジア太平洋の液体肥料市場は、世界の液体肥料市場の総額シェアの約49.9%を占めました。同地域の生産者は、土壌に浸透しやすく、植物がより早く栄養分を吸収できるなど、液体肥料の利点への認識が高まっています。さらに、液体肥料は肥料の無駄を省き、地面にも葉にも散布できます。
- 液体肥料は2022年に北米の特殊肥料市場の21.8%を占めました。北米における液体肥料の消費国は米国がトップで、2022年のシェアは74.4%でした。同国の液体肥料市場は2022年に31億米ドルと評価され、消費量は330万トンでした。
- 欧州は世界第3位の液体肥料市場で、液体肥料市場全体の約15.6%を占めています。これは、この地域の灌漑システムが優れているためです。例えば、ドイツ、ロシア、英国、フランスなどの国では、灌漑地の55%以上がスプリンクラーやマイクロ灌漑システムで占められており、この地域の市場を牽引しています。
- この地域の各国政府は、価格補助金を通じてマイクロ灌漑システムの導入を継続的に推進しています。そのため、この地域では、先進的灌漑方法の採用が進むにつれて、液体肥料の採用が今後増加すると予想されます。
- それゆえ、施肥の容易さ、均一な分配、施肥コストの削減により、液体肥料の採用傾向が強まっています。これらの要因は、2023~2030年にかけて液体肥料市場を牽引する可能性があります。
世界の液体肥料市場動向
食糧需要の増加に対応するための農業への圧力の高まりは、畑作物の栽培面積を増加させると予想されます。
- 世界の農業セクタは現在、多くの課題に直面しています。国連によると、世界人口は2050年までに90億人を超える可能性が高いです。この人口増加は、すでに労働力不足や都市化の進展による農地の縮小で生産高が減少している農業に過重な負担をかける可能性があります。国連食糧農業機関によると、2050年までに世界人口の70%が都市に住むようになると予想されています。世界的に耕地が減少しているため、農業従事者は作物の収穫量を増やすために、より多くの肥料を利用する必要があります。
- アジア太平洋は世界最大の農産物生産地です。農業はこの地域の経済にとって不可欠であり、全労働人口の約20%を雇用しています。畑作がこの地域を支配しており、この地域の総作物栽培面積の95%以上を占めています。米、小麦、トウモロコシがこの地域で生産される主要な畑作物で、2022年の総作付面積の約24.3%を占めています。
- 北米は世界の総農地面積の中で2番目に大きな耕作可能地域です。北米の農場では、畑作物を中心に多様な作物が栽培されています。米国農務省によれば、トウモロコシ、綿花、米、大豆、小麦がこの地域の主要な畑作物のひとつです。米国は、調査期間中の作物栽培面積の46.2%を占め、市場を独占しています。同国の作物栽培面積は2017~2019年にかけて大幅に減少したが、これは主にテキサス州やヒューストンなどの地域で大洪水が発生した不利な環境条件によるものでした。
畑作物における一次養分の窒素、カリウム、リンの世界平均施用量は164.31 kg/ha
- トウモロコシ、菜種、綿花、ソルガム、稲、小麦、大豆は、世界中で主要な一次養分を消費する作物です。これらの畑作物の一次養分施用量は、それぞれ230.57 kg/ha、255.75 kg/ha、172.70 kg/ha、158.46 kg/ha、154.49 kg/ha、135.35 kg/ha、120.97 kg/haです。一次養分は、植物の代謝プロセスに不可欠な役割を果たし、細胞、細胞膜、葉緑素などの組織の形成を助けるため、作物にとって極めて重要です。リンは高品質の作物を育てるために不可欠であり、カリウムは植物の成長と開発に必要な酵素を活性化します。
- 畑作物における窒素、カリウム、リンの世界平均施用量は164.31kg/haです。窒素は畑作物で最も広く使用されている主栄養素肥料で、施用量は224.6 kg/ヘクタール、次いでカリ肥料が150.3 kg/ヘクタール、リンは2022年の施用量が117.9 kg/ヘクタールで3番目に消費量の多い肥料です。
- 2022年の窒素施用量は菜種が最も多く347.4kg/ヘクタールでした。同様に、リンの施用率はトウモロコシで最も高く156.3 kg/ヘクタール、カリウムの施用率はカノーラで最も高く248.6 kg/ヘクタールでした。世界の畑作物の栽培面積は、特に南米とアジア太平洋で増加しています。これらは肥料の潜在的成長市場です。特殊肥料はその効率性から、欧州、北米などの先進地域や、栄養不足が蔓延している地域で広く使用されています。これらの要因によって、2023~2030年の間に一次栄養肥料市場が牽引されると予想されます。
液体肥料産業概要
液体肥料市場は細分化されており、上位5社で15.48%を占めています。この市場の主要企業は、Grupa Azoty S.A.(Compo Expert)、ICL Group Ltd、Indian Farmers Fertiliser Cooperative Limited、Sociedad Quimica y Minera de Chile SA、Yara International ASAなどです。
その他の特典
- エクセル形式の市場予測(ME)シート
- 3ヶ月のアナリストサポート
目次
第1章 エグゼクティブサマリーと主要調査結果
第2章 レポートのオファー
第3章 イントロダクション
- 調査の前提条件と市場定義
- 調査範囲
- 調査手法
第4章 主要産業動向
- 主要作物の作付面積
- 畑作物
- 園芸作物
- 平均養分施用率
- 微量栄養素
- 畑作物
- 園芸作物
- 一次栄養素
- 畑作物
- 園芸作物
- 二次多量栄養素
- 畑作物
- 園芸作物
- 微量栄養素
- 灌漑農地
- 規制の枠組み
- バリューチェーンと流通チャネル分析
第5章 市場セグメンテーション
- タイプ
- 複合型
- ストレート
- 栄養素別
- 微量栄養素
- 窒素
- リン酸
- カリウム
- 二次多量栄養素
- 施用モード
- 施肥
- 葉面散布
- 作物タイプ
- 畑作物
- 園芸作物
- 芝・観賞用
- 地域
- アジア太平洋
- オーストラリア
- バングラデシュ
- 中国
- インド
- インドネシア
- 日本
- パキスタン
- フィリピン
- タイ
- ベトナム
- その他のアジア太平洋
- 欧州
- フランス
- ドイツ
- イタリア
- オランダ
- ロシア
- スペイン
- ウクライナ
- 英国
- その他の欧州
- 中東・アフリカ
- ナイジェリア
- サウジアラビア
- 南アフリカ
- トルコ
- その他の中東・アフリカ
- 北米
- カナダ
- メキシコ
- 米国
- その他の北米地域
- 南米
- アルゼンチン
- ブラジル
- その他の南米
- アジア太平洋
第6章 競合情勢
- 主要な戦略動向
- 市場シェア分析
- 企業情勢
- 企業プロファイル
- BMS Micro-Nutrients NV
- Grupa Azoty S.A.(Compo Expert)
- ICL Group Ltd
- Indian Farmers Fertiliser Cooperative Limited
- Nortox
- Safsulphur
- Sociedad Quimica y Minera de Chile SA
- Yara International ASA
第7章 CEOへの主要戦略的質問
第8章 付録
- 世界概要
- 概要
- ファイブフォース分析フレームワーク
- 世界のバリューチェーン分析
- 市場力学(DROs)
- 情報源と参考文献
- 図表一覧
- 主要な洞察
- データパック
- 用語集
The Liquid Fertilizer Market size is estimated at 23.5 billion USD in 2025, and is expected to reach 31.53 billion USD by 2030, growing at a CAGR of 6.05% during the forecast period (2025-2030).
Field crop consumption of liquid fertilizers is increasing
- Field crops dominated the global liquid fertilizer market, accounting for about 77.4% of the total liquid fertilizer consumption. Their volume consumption of liquid fertilizers was 20.6 million metric tons, worth USD 20.6 billion in 2022. The large consumption of liquid fertilizers by field crops is due to the large area under cultivation of these crops. More than 85.0% of the global agricultural land is dedicated to the cultivation of field crops.
- Horticultural crops are the second-largest crop type that consumes liquid fertilizers, accounting for about 19.2% of the global liquid fertilizer consumption in 2022.
- With increasing concerns for health and nutrition after the COVID-19 pandemic, the demand for high-value crops like fruits and vegetables is increasing worldwide. Vegetable crops with major demand, such as tomatoes, potatoes, onions, cabbage, and cauliflower, consume high amounts of fertilizer and are grown throughout the year. Foliar liquid fertilizers play an important role in fruit crops, as foliar spraying is known to improve the quality of fruits.
- Turf and ornamental crops accounted for a share of about 3.4% of the total global liquid fertilizer market and were valued at USD 863.9 million in 2022, with a volume consumption of 907.2 thousand metric tons.
- The area under cultivation of turf and ornamental crops is increasing with concerns over pollution, the growing importance of aesthetic landscaping in gardens, and ecotourism worldwide. Therefore, the global consumption of liquid fertilizers in respective crop types is anticipated to register a CAGR of 5.1% between 2023 and 2030.
The United States occupied the higher market share in liquid fertilizers consumption in the region
- In 2022, the Asia-Pacific liquid fertilizers market accounted for approximately 49.9% of the global liquid fertilizers market's total value share. Growers in the region are increasingly aware of the advantages of liquid fertilizers, such as their ability to penetrate the soil easily and enable plants to absorb nutrients more quickly. Additionally, liquid fertilizers help reduce fertilizer wastage and can be applied either to the ground or to the leaves.
- Liquid fertilizer represented 21.8% of the North American specialty market in 2022. The United States was the top consumer of liquid fertilizers in North America, with a share of 74.4% in 2022. The liquid fertilizer market in the country was valued at USD 3.1 billion in 2022, with a volume consumption of 3.3 million metric tons.
- Europe is the third-largest market for liquid fertilizers in the world, accounting for about 15.6% of the total liquid fertilizer market. This is due to the dominance of better irrigation systems in the region. For instance, countries like Germany, Russia, the United Kingdom, and France have more than 55% of their irrigated land covered by sprinklers or micro-irrigation systems, thus driving the market in the region.
- Governments across the region are continuously promoting the adoption of micro-irrigation systems through price subsidies. Therefore, the adoption of liquid fertilizers in the region is expected to increase in the future, with the increased adoption of advanced irrigation methods.
- Hence, there is an increasing trend toward the adoption of liquid fertilizers due to the ease of application, uniform distribution, and reduction in the cost of application. These factors may drive the liquid fertilizer market between 2023 and 2030.
Global Liquid Fertilizer Market Trends
The rising pressure on the agriculture industry to meet the increasing demand for food is expected to increase the area under field crop cultivation
- The global agricultural sector is currently facing many challenges. According to the UN, the world population is likely to exceed nine billion by 2050. This population growth may overburden the agricultural industry, which is already experiencing an output loss due to a lack of laborers and the shrinkage of agricultural fields caused by rising urbanization. According to the Food and Agriculture Organization, 70% of the global population is expected to live in cities by 2050. Due to the global loss of arable land, farmers now need to utilize more fertilizers to increase crop yields.
- Asia-Pacific is the world's largest producer of agricultural products. Agriculture is critical to the region's economy, as it employs about 20% of the total available workforce. Field crop cultivation dominates the region, accounting for more than 95% of the total crop area in the region. Rice, wheat, and corn are the major field crops produced in the region, which accounted for about 24.3% of the total crop area in 2022.
- North America is the second-largest arable region of the total agricultural land area in the world. Diverse varieties of crops are grown in North American farms, primarily field crops. As per the USDA, corn, cotton, rice, soybean, and wheat are among the region's dominant field crops. The United States dominated the market by accounting for 46.2% of the total area under crop cultivation during the study period, with field crops covering the majority of the area compared to other crop types. Crop acreage in the country fell significantly between 2017 and 2019, primarily due to unfavorable environmental conditions that resulted in heavy floods in areas such as Texas and Houston.
The global average application rate of primary nutrient nitrogen, potassium, and phosphorus in field crops is 164.31 kg/ha
- Corn, rapeseed, cotton, sorghum, rice, wheat, and soybean are some of the major primary nutrient-consuming crops worldwide. The primary nutrient application rates for these field crops are 230.57 kg/ha, 255.75 kg/ha, 172.70 kg/ha, 158.46 kg/ha, 154.49 kg/ha, 135.35 kg/ha, and 120.97 kg/ha, respectively. Primary nutrient fertilizers are crucial for crops because they play an essential role in plant metabolic processes and assist in forming tissues such as cells, cell membranes, and chlorophyll. Phosphorus is essential for growing high-quality crops; potassium activates the enzymes needed for plant growth and development.
- The global average application rate of nitrogen, potassium, and phosphorus in field crops is 164.31 kg/ha. Nitrogen is the most widely used primary nutrient fertilizer in field crops, accounting for an application rate of 224.6 kg/hectare, followed by potassic fertilizers with 150.3 kg/hectare, and phosphorus was the third most consumed fertilizer with an application rate of 117.9 kg/hectare in 2022.
- In 2022, the nitrogen application rate was highest in rapeseed at 347.4 kg/hectare. Similarly, the phosphorus application rate was highest in corn at 156.3 kg/hectare, and the potassium application rate was highest in canola at 248.6 kg/hectare. The global field crop cultivation area is increasing, particularly in South America and Asia-Pacific. These are the potential growing markets for fertilizers. Due to their efficiency, specialty fertilizers are widely used in developed regions such as Europe, North America, and other regions with widespread nutrient deficiencies. These factors are anticipated to drive the primary nutrient fertilizers market between 2023 and 2030.
Liquid Fertilizer Industry Overview
The Liquid Fertilizer Market is fragmented, with the top five companies occupying 15.48%. The major players in this market are Grupa Azoty S.A. (Compo Expert), ICL Group Ltd, Indian Farmers Fertiliser Cooperative Limited, Sociedad Quimica y Minera de Chile SA and Yara International ASA (sorted alphabetically).
Additional Benefits:
- The market estimate (ME) sheet in Excel format
- 3 months of analyst support
TABLE OF CONTENTS
1 EXECUTIVE SUMMARY & KEY FINDINGS
2 REPORT OFFERS
3 INTRODUCTION
- 3.1 Study Assumptions & Market Definition
- 3.2 Scope of the Study
- 3.3 Research Methodology
4 KEY INDUSTRY TRENDS
- 4.1 Acreage Of Major Crop Types
- 4.1.1 Field Crops
- 4.1.2 Horticultural Crops
- 4.2 Average Nutrient Application Rates
- 4.2.1 Micronutrients
- 4.2.1.1 Field Crops
- 4.2.1.2 Horticultural Crops
- 4.2.2 Primary Nutrients
- 4.2.2.1 Field Crops
- 4.2.2.2 Horticultural Crops
- 4.2.3 Secondary Macronutrients
- 4.2.3.1 Field Crops
- 4.2.3.2 Horticultural Crops
- 4.2.1 Micronutrients
- 4.3 Agricultural Land Equipped For Irrigation
- 4.4 Regulatory Framework
- 4.5 Value Chain & Distribution Channel Analysis
5 MARKET SEGMENTATION (includes market size in Value in USD and Volume, Forecasts up to 2030 and analysis of growth prospects)
- 5.1 Type
- 5.1.1 Complex
- 5.1.2 Straight
- 5.1.2.1 By Nutrient
- 5.1.2.1.1 Micronutrients
- 5.1.2.1.2 Nitrogenous
- 5.1.2.1.3 Phosphatic
- 5.1.2.1.4 Potassic
- 5.1.2.1.5 Secondary Macronutrients
- 5.2 Application Mode
- 5.2.1 Fertigation
- 5.2.2 Foliar
- 5.3 Crop Type
- 5.3.1 Field Crops
- 5.3.2 Horticultural Crops
- 5.3.3 Turf & Ornamental
- 5.4 Region
- 5.4.1 Asia-Pacific
- 5.4.1.1 Australia
- 5.4.1.2 Bangladesh
- 5.4.1.3 China
- 5.4.1.4 India
- 5.4.1.5 Indonesia
- 5.4.1.6 Japan
- 5.4.1.7 Pakistan
- 5.4.1.8 Philippines
- 5.4.1.9 Thailand
- 5.4.1.10 Vietnam
- 5.4.1.11 Rest of Asia-Pacific
- 5.4.2 Europe
- 5.4.2.1 France
- 5.4.2.2 Germany
- 5.4.2.3 Italy
- 5.4.2.4 Netherlands
- 5.4.2.5 Russia
- 5.4.2.6 Spain
- 5.4.2.7 Ukraine
- 5.4.2.8 United Kingdom
- 5.4.2.9 Rest of Europe
- 5.4.3 Middle East & Africa
- 5.4.3.1 Nigeria
- 5.4.3.2 Saudi Arabia
- 5.4.3.3 South Africa
- 5.4.3.4 Turkey
- 5.4.3.5 Rest of Middle East & Africa
- 5.4.4 North America
- 5.4.4.1 Canada
- 5.4.4.2 Mexico
- 5.4.4.3 United States
- 5.4.4.4 Rest of North America
- 5.4.5 South America
- 5.4.5.1 Argentina
- 5.4.5.2 Brazil
- 5.4.5.3 Rest of South America
- 5.4.1 Asia-Pacific
6 COMPETITIVE LANDSCAPE
- 6.1 Key Strategic Moves
- 6.2 Market Share Analysis
- 6.3 Company Landscape
- 6.4 Company Profiles
- 6.4.1 BMS Micro-Nutrients NV
- 6.4.2 Grupa Azoty S.A. (Compo Expert)
- 6.4.3 ICL Group Ltd
- 6.4.4 Indian Farmers Fertiliser Cooperative Limited
- 6.4.5 Nortox
- 6.4.6 Safsulphur
- 6.4.7 Sociedad Quimica y Minera de Chile SA
- 6.4.8 Yara International ASA
7 KEY STRATEGIC QUESTIONS FOR FERTILIZER CEOS
8 APPENDIX
- 8.1 Global Overview
- 8.1.1 Overview
- 8.1.2 Porter's Five Forces Framework
- 8.1.3 Global Value Chain Analysis
- 8.1.4 Market Dynamics (DROs)
- 8.2 Sources & References
- 8.3 List of Tables & Figures
- 8.4 Primary Insights
- 8.5 Data Pack
- 8.6 Glossary of Terms
