
シアノアクリレート系接着剤:市場シェア分析、産業動向・統計、成長予測(2025年~2030年)
Cyanoacrylate Adhesives - Market Share Analysis, Industry Trends & Statistics, Growth Forecasts (2025 - 2030)
- 発行日
- ページ情報
- 英文 314 Pages
- 納期
- 2~3営業日
- 商品コード
- 1693418
- カスタマイズ可能 お客様のご希望に応じて、既存データの加工や未掲載情報(例:国別セグメント)の追加などの対応が可能です。詳細はお問い合わせください。
- 適宜更新あり 本レポートは最新情報反映のため適宜更新し、内容構成変更を行う場合があります。ご検討の際はお問い合わせください。
- 翻訳ツール提供対象 PDF対応AI翻訳ツールの無料貸し出しサービスのご利用が可能です
概要
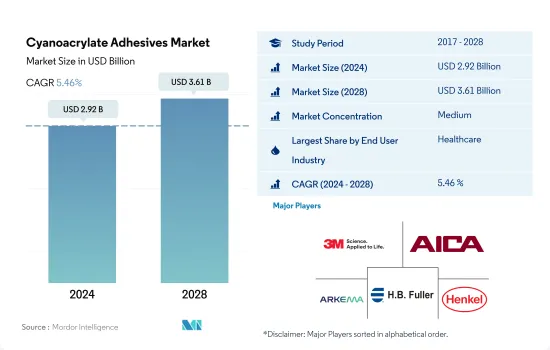
シアノアクリレート系接着剤の市場規模は2024年に29億2,000万米ドルと推計され、2028年には36億1,000万米ドルに達すると予測され、予測期間中(2024-2028年)のCAGRは5.46%で成長する見込みです。
ヘルスケア産業への投資の増加も、シアノアクリレート系接着剤の需要を今後牽引します。
- シアノアクリレート系接着剤は、通常は室温で素早く、または即座に硬化するなどのユニークな特性を持つため、さまざまなエンドユーザー産業で使用されています。
- シアノアクリレート系接着剤は、床材、屋根材、キッチン部品の組み立てなどの用途で建設業界で使用されています。建設業界は、2030年まで3.5%のCAGRで世界的に成長すると予想されています。世界各国の中では、中国、インド、米国、インドネシアが世界の建設成長の58.3%を占めると予想されています。
- シアノアクリレート系接着剤は、ガラス、金属、プラスチック、塗装面などの表面に適用できるため、自動車産業で広く使用されています。電気自動車のバッテリー組み立てなど、車体内装やエンジン部品の組み立てに使用されています。自動車産業の電気自動車分野は、成長経済圏での需要増加により、予測期間中に世界全体で17.75%のCAGRで推移すると予想されています。このため、予測期間中に自動車用シアノアクリレート系接着剤の需要が高まると予想されます。
- シアノアクリレート系接着剤は、電子機器や電気機器の製造に広く使用されています。センサーの取り付けや配線の鋲止めに使用されます。世界の電子機器産業と家電産業はそれぞれ2.51%と5.77%のCAGRで推移すると予想されており、予測期間2022-2028年にはシアノアクリレート系接着剤の需要が増加すると見られています。
- シアノアクリレート系接着剤は、無毒性で瞬時に硬化するため、ヘルスケア業界で組み立てや医療用テープなどの用途に使用されています。世界のヘルスケア投資の増加は、予測期間における需要の増加につながります。
UV硬化技術に基づくシアノアクリレート系接着剤が世界規模で成長率を牽引
- シアノアクリレート系接着剤は世界の接着剤市場全体の3%を占め、2021年の市場規模は547億米ドルです。シアノアクリレート系接着剤は、その迅速な接着特性のために人気があります。金属、ガラス、ポリマーを含む様々な基材間の接着を形成するのに必要な接着剤は少ないです。これらの接着剤は、主に自動車、エレクトロニクス、DIY、ヘルスケア、および世界中の他のいくつかの産業で消費されています。
- シアノアクリレート系接着剤の消費量は、主にCOVID-19の大流行により、2020年には2019年比で10.74%減少しました。世界の国家的封鎖により、生産施設の閉鎖、サプライチェーンの混乱、貿易交流のための国際国境の封鎖が発生しました。しかし、多くの国々での景気回復により、2021年のシアノアクリレート系接着剤の需要は2,520万kg増加しました。
- シアノアクリレート系接着剤は、中国、日本、インドなどの経済成長により、主にアジア太平洋地域で消費されています。これらの瞬間接着剤は、この地域の自動車、DIY、エレクトロニクス産業で広く使用されています。中国は自動車生産の最大国であり、これらの接着剤は同国で多く使用されています。自動車生産台数は、2021年の4,790万台から2027年には6,370万台に達すると予想されています。この地域における自動車生産の増加は、今後数年間シアノアクリレート系接着剤の需要を牽引すると予想されます。
- シアノアクリレート系接着剤は、反応性技術とUV硬化技術で使用されます。UV硬化技術は世界で最も急速に成長している技術であり、予測期間2022-2028年には数量ベースで4.83%のCAGRで推移すると予想されています。
シアノアクリレート系接着剤の世界動向
電気自動車を推進する有利な政府政策が自動車産業を後押し
- 2021年以降、世界の自動車産業は安定的に成長すると予想されているが、消費者の乗用車の個人所有への嗜好が低下し、移動における共有モビリティへの嗜好が高まっているため、そのペースは鈍化しています。世界の自動車産業の成長率は年率2%で、予測期間中の総収益の付加価値は1兆5,000億米ドルに達すると予想されます。
- 2020年には、COVID-19パンデミックの影響により、自動車販売台数は減少したが、2021年には急速に回復しました。自動車市場は通常、GDPに大きく貢献しているため、各国政府が経済支援策を講じたからです。自動車販売台数は、2019年の乗用車9,000万台から2020年には7,800万台に減少しました。
- 世界の電気自動車の導入は、その安価なエネルギーコスト、環境に優しい性質、効率的なモビリティ機能により、世界の自動車市場全体の収益に大きく貢献しています。また、政府のさまざまな政策や基準も、電気自動車の生産を増加させる原動力となっています。例えば、EUのCO2排出量基準は、2021年に電気自動車の需要を増加させました。IEAの持続可能なシナリオによれば、2030年までに2億3,000万台の電気自動車が燃焼燃料を使用する自動車に取って代わる必要があります。2021年には、最大のEVメーカーであるテスラが、電気自動車の製造台数で157%の増加を記録しました。電気自動車を好む消費者の動向は、予測期間中(2022~2028年)にさらに高まると予想されます。
家庭用・オフィス用家具の需要増加が業界の成長を後押し
- イケアが世界の家具市場で最大のオフライン小売企業である一方、近年はウェイフェアのようなeコマース大手が台頭してきています。消費者によるオンライン家具ショッピングの導入は世界的に勢いを増しており、家具市場全体におけるシェアは2017年の15%から2021年には18%に増加します。この動向はその後、その利便性と簡単な設置により家具の需要を押し上げています。家具の売上高が最も高いのは米国で、2021年には2,292億米ドルとなりました。
- 世界の木製家具市場は、寝室用家具、リビングルーム用家具、屋外用家具、ダイニング用家具に区分できます。このうち、リビングルーム用家具分野は、2020年のCOVID-19流行時に在宅ワーク文化が増加して以来、家具市場全体の40%近くを占め、最も高い収益シェアを占めています。パンデミックは2020-2021年のリビングルームまたはホームオフィス用家具の需要増につながり、このセグメントは世界全体で2,271億米ドルの市場価値を記録しました。
- 予測期間中(2022~2028年)、家具に対する一人当たり支出額が増加し、2020年のパンデミックにもかかわらず、2017年の72.85米ドルから2021年には89.30米ドルに上昇し、その間80.43米ドルにまで落ち込んだことから、市場は安定した成長が見込まれます。このように一人当たりの家具への支出が増加しているのは、人々の生活水準が向上しているためと考えられます。
シアノアクリレート系接着剤産業の概要
シアノアクリレート系接着剤市場は適度に統合されており、上位5社で43.97%を占めています。この市場の主要企業は以下の通りです。 3M, Aica Kogyo, Arkema Group, H.B. Fuller Company and Henkel AG & Co. KGaA(アルファベット順)
その他の特典
- エクセル形式の市場予測(ME)シート
- 3ヶ月のアナリストサポート
目次
第1章 エグゼクティブサマリーと主な調査結果
第2章 レポートのオファー
第3章 イントロダクション
- 調査の前提条件と市場定義
- 調査範囲
- 調査手法
第4章 主要産業動向
- エンドユーザー動向
- 航空宇宙
- 自動車
- 建築・建設
- 履物・皮革
- 木工・建具
- 規制の枠組み
- アルゼンチン
- オーストラリア
- ブラジル
- カナダ
- 中国
- EU
- インド
- インドネシア
- 日本
- マレーシア
- メキシコ
- ロシア
- サウジアラビア
- シンガポール
- 南アフリカ
- 韓国
- タイ
- 米国
- バリューチェーンと流通チャネル分析
第5章 市場セグメンテーション
- エンドユーザー産業
- 航空宇宙
- 自動車
- 建築・建設
- 履物・皮革
- ヘルスケア
- 木工・建具
- その他のエンドユーザー産業
- テクノロジー
- 反応性
- UV硬化型接着剤
- 地域
- アジア太平洋
- オーストラリア
- 中国
- インド
- インドネシア
- 日本
- マレーシア
- シンガポール
- 韓国
- タイ
- その他アジア太平洋地域
- 欧州
- フランス
- ドイツ
- イタリア
- ロシア
- スペイン
- 英国
- その他欧州
- 中東・アフリカ
- サウジアラビア
- 南アフリカ
- その他中東とアフリカ
- 北米
- カナダ
- メキシコ
- 米国
- その他北米地域
- 南米
- アルゼンチン
- ブラジル
- その他南米
- アジア太平洋
第6章 競合情勢
- 主要な戦略動向
- 市場シェア分析
- 企業情勢
- 企業プロファイル.
- 3M
- Aica Kogyo Co..Ltd.
- Arkema Group
- DELO Industrie Klebstoffe GmbH & Co. KGaA
- H.B. Fuller Company
- Henkel AG & Co. KGaA
- Hubei Huitian New Materials Co. Ltd
- Illinois Tool Works Inc.
- Jowat SE
- Kangda New Materials(Group)Co., Ltd.
- NANPAO RESINS CHEMICAL GROUP
- Permabond LLC.
- Pidilite Industries Ltd.
- Soudal Holding N.V.
- ThreeBond Holdings Co., Ltd.
第7章 CEOへの主な戦略的質問
第8章 付録
- 世界の接着剤とシーラント産業の概要
- 概要
- ファイブフォース分析フレームワーク(産業魅力度分析)
- 世界のバリューチェーン分析
- 促進要因、抑制要因、機会
- 情報源と参考文献
- 図表一覧
- 主要洞察
- データパック
- 用語集
目次
Product Code: 92477
The Cyanoacrylate Adhesives Market size is estimated at 2.92 billion USD in 2024, and is expected to reach 3.61 billion USD by 2028, growing at a CAGR of 5.46% during the forecast period (2024-2028).
Rising investments in the healthcare industry to also drive the demand for cyanoacrylate adhesives in the future
- Cyanoacrylate adhesives are used in different end-user industries because of their unique properties, such as quick or instant curing, usually at room temperature.
- Cyanoacrylate adhesives are used in the construction industry for their applications, such as flooring, roofing, and kitchen component assembly. The construction industry is expected to grow globally with a 3.5% CAGR up to 2030. Among the nations of the world, China, India, the United States, and Indonesia are expected to account for 58.3% of the global construction growth.
- Cyanoacrylate adhesives are widely used in the automotive industry because of their applicability to surfaces such as glass, metal, plastic, and painted surfaces. They are used to assemble body interiors and engine components, such as battery assembly in electric vehicles. The electric vehicles segment of the automotive industry is expected to record a 17.75% CAGR globally in the forecast period because of the increase in demand for the same in growing economies. This is expected to boost the demand for automotive cyanoacrylate adhesives in the forecast period.
- Cyanoacrylate adhesives are widely used in electronics and electrical equipment manufacturing. They are used for attaching sensors and tacking off wires. The global electronics and household appliances industries are expected to record CAGRs of 2.51% and 5.77%, respectively, which is expected to increase demand for cyanoacrylate adhesives in the forecast period 2022-2028.
- Cyanoacrylate adhesives are used in the healthcare industry for applications such as assembling and medical tapes because of their non-toxic nature and instant curing. The increase in healthcare investments worldwide will lead to a rise in their demand in the forecast period.
Cyanoacrylate adhesives based on the UV-cured technology leading the growth rates at the global scale
- Cyanoacrylate adhesives account for 3% of the total adhesives market worldwide, valued at USD 54.7 billion in 2021. Cyanoacrylate adhesives are popular because of their quick bonding properties. It requires less adhesive to form a bond between various substrates, including metals, glass, and polymers. These adhesives are majorly consumed in automotive, electronics, DIY, healthcare, and a few other industries across the globe.
- The consumption of cyanoacrylate adhesives declined in 2020 by 10.74% compared to 2019, mainly due to the COVID-19 pandemic. Nationwide lockdowns globally resulted in the shutdown of production facilities, supply chain disruptions, and sealed international borders for trade exchange. However, the economic recovery in many countries resulted in a growth in demand for cyanoacrylate adhesives by 25.2 million kg in 2021.
- Cyanoacrylate adhesives are consumed mainly in the Asia-Pacific region owing to growing economies such as China, Japan, and India. These instant adhesives are widely used in the region's automotive, DIY, and electronics industries. China is the largest country for automotive production, and these adhesives are used more in the country. Automotive production is expected to reach 63.7 million units by 2027 from 47.9 million units in 2021. The rising automotive production in the region is expected to drive the demand for cyanoacrylate adhesives over the coming years.
- Cyanoacrylate adhesives are used with reactive and UV-cured technology. UV-cured technology is the fastest-growing technology in the world and is expected to record a CAGR of 4.83% in volume terms in the forecast period 2022-2028.
Global Cyanoacrylate Adhesives Market Trends
Favorable government policies to promote electric vehicles will propel automotive industry
- Since 2021, the global automotive industry has been expected to grow steadily but at a slower pace because of the decline in consumers' preferences for individual ownership of passenger vehicles and their increased preference for shared mobility in transportation. The global automotive industry is expected to experience a growth rate of 2% annually, with an expected value addition of USD 1.5 trillion in total revenue during the forecast period.
- In 2020, due to the impact of the COVID-19 pandemic, vehicle sales declined but recovered rapidly in 2021 because the governments of various countries took measures to support their economies, as automotive markets usually contribute majorly to their GDP. Vehicle sales declined from 90 million units of passenger vehicles in 2019 to 78 million units in 2020.
- The introduction of electric vehicles worldwide has contributed significantly to the overall revenue of the global automotive market because of their cheaper energy costs, environmentally benign nature, and efficient mobility features. Various government policies and standards also work as driving factors to increase EV production. For instance, the EU standards for CO2 emissions increased the demand for electric vehicles in 2021. As per the IEA's Sustainable Scenario, 230 million electric vehicles are required to replace combustion fuel-based vehicles by 2030. In 2021, Tesla, the largest EV manufacturer, recorded a rise of 157% in the number of electric vehicles manufactured. This growing trend of consumers preferring electric vehicles is expected to rise further during the forecast period (2022-2028).
Rising demand for home & office furniture to aid the growth of the industry
- While IKEA is the largest offline retail player in the global furniture market, there has been a rise in e-commerce giants, such as Wayfair, in recent years. The adoption of online furniture shopping by consumers is gaining momentum globally, and its share in the overall furniture market increased from 15% in 2017 to 18% in 2021. This trend is subsequently boosting the demand for furniture due to its convenience and easy installation. The highest sales revenue for furniture was generated in the United States, with USD 229.2 billion, in 2021.
- The global wooden furniture market can be segmented into bedroom, living room, outdoor, and dining furniture. Among these, the living room furniture segment held the highest revenue share, accounting for nearly 40% of the overall furniture market since the increase in the work-from-home culture during the COVID-19 outbreak in 2020. The pandemic led to an increase in demand for living room or home office furniture in 2020-2021, and the segment registered a market value of USD 227.10 billion globally.
- The market is expected to witness steady growth during the forecast period (2022-2028) due to the increasing per capita expenditure on furniture, which rose from USD 72.85 in 2017 to USD 89.30 in 2021 despite the pandemic in 2020, during which it dipped to USD 80.43. This increasing per capita expenditure on furniture could be due to the improving living standards of people.
Cyanoacrylate Adhesives Industry Overview
The Cyanoacrylate Adhesives Market is moderately consolidated, with the top five companies occupying 43.97%. The major players in this market are 3M, Aica Kogyo Co..Ltd., Arkema Group, H.B. Fuller Company and Henkel AG & Co. KGaA (sorted alphabetically).
Additional Benefits:
- The market estimate (ME) sheet in Excel format
- 3 months of analyst support
TABLE OF CONTENTS
1 EXECUTIVE SUMMARY & KEY FINDINGS
2 REPORT OFFERS
3 INTRODUCTION
- 3.1 Study Assumptions & Market Definition
- 3.2 Scope of the Study
- 3.3 Research Methodology
4 KEY INDUSTRY TRENDS
- 4.1 End User Trends
- 4.1.1 Aerospace
- 4.1.2 Automotive
- 4.1.3 Building and Construction
- 4.1.4 Footwear and Leather
- 4.1.5 Woodworking and Joinery
- 4.2 Regulatory Framework
- 4.2.1 Argentina
- 4.2.2 Australia
- 4.2.3 Brazil
- 4.2.4 Canada
- 4.2.5 China
- 4.2.6 EU
- 4.2.7 India
- 4.2.8 Indonesia
- 4.2.9 Japan
- 4.2.10 Malaysia
- 4.2.11 Mexico
- 4.2.12 Russia
- 4.2.13 Saudi Arabia
- 4.2.14 Singapore
- 4.2.15 South Africa
- 4.2.16 South Korea
- 4.2.17 Thailand
- 4.2.18 United States
- 4.3 Value Chain & Distribution Channel Analysis
5 MARKET SEGMENTATION (includes market size in Value in USD and Volume, Forecasts up to 2028 and analysis of growth prospects)
- 5.1 End User Industry
- 5.1.1 Aerospace
- 5.1.2 Automotive
- 5.1.3 Building and Construction
- 5.1.4 Footwear and Leather
- 5.1.5 Healthcare
- 5.1.6 Woodworking and Joinery
- 5.1.7 Other End-user Industries
- 5.2 Technology
- 5.2.1 Reactive
- 5.2.2 UV Cured Adhesives
- 5.3 Region
- 5.3.1 Asia-Pacific
- 5.3.1.1 Australia
- 5.3.1.2 China
- 5.3.1.3 India
- 5.3.1.4 Indonesia
- 5.3.1.5 Japan
- 5.3.1.6 Malaysia
- 5.3.1.7 Singapore
- 5.3.1.8 South Korea
- 5.3.1.9 Thailand
- 5.3.1.10 Rest of Asia-Pacific
- 5.3.2 Europe
- 5.3.2.1 France
- 5.3.2.2 Germany
- 5.3.2.3 Italy
- 5.3.2.4 Russia
- 5.3.2.5 Spain
- 5.3.2.6 United Kingdom
- 5.3.2.7 Rest of Europe
- 5.3.3 Middle East & Africa
- 5.3.3.1 Saudi Arabia
- 5.3.3.2 South Africa
- 5.3.3.3 Rest of Middle East & Africa
- 5.3.4 North America
- 5.3.4.1 Canada
- 5.3.4.2 Mexico
- 5.3.4.3 United States
- 5.3.4.4 Rest of North America
- 5.3.5 South America
- 5.3.5.1 Argentina
- 5.3.5.2 Brazil
- 5.3.5.3 Rest of South America
- 5.3.1 Asia-Pacific
6 COMPETITIVE LANDSCAPE
- 6.1 Key Strategic Moves
- 6.2 Market Share Analysis
- 6.3 Company Landscape
- 6.4 Company Profiles (includes Global Level Overview, Market Level Overview, Core Business Segments, Financials, Headcount, Key Information, Market Rank, Market Share, Products and Services, and Analysis of Recent Developments).
- 6.4.1 3M
- 6.4.2 Aica Kogyo Co..Ltd.
- 6.4.3 Arkema Group
- 6.4.4 DELO Industrie Klebstoffe GmbH & Co. KGaA
- 6.4.5 H.B. Fuller Company
- 6.4.6 Henkel AG & Co. KGaA
- 6.4.7 Hubei Huitian New Materials Co. Ltd
- 6.4.8 Illinois Tool Works Inc.
- 6.4.9 Jowat SE
- 6.4.10 Kangda New Materials (Group) Co., Ltd.
- 6.4.11 NANPAO RESINS CHEMICAL GROUP
- 6.4.12 Permabond LLC.
- 6.4.13 Pidilite Industries Ltd.
- 6.4.14 Soudal Holding N.V.
- 6.4.15 ThreeBond Holdings Co., Ltd.
7 KEY STRATEGIC QUESTIONS FOR ADHESIVES AND SEALANTS CEOS
8 APPENDIX
- 8.1 Global Adhesives and Sealants Industry Overview
- 8.1.1 Overview
- 8.1.2 Porter's Five Forces Framework (Industry Attractiveness Analysis)
- 8.1.3 Global Value Chain Analysis
- 8.1.4 Drivers, Restraints, and Opportunities
- 8.2 Sources & References
- 8.3 List of Tables & Figures
- 8.4 Primary Insights
- 8.5 Data Pack
- 8.6 Glossary of Terms
シアノアクリレート系接着剤:市場シェア分析、産業動向・統計、成長予測(2025年~2030年)
- 発行日
- 発行
- Mordor Intelligence
- ページ情報
- 英文 314 Pages
- 納期
- 2~3営業日