
|
市場調査レポート
商品コード
1692029
ゼラチン:市場シェア分析、産業動向と統計、成長予測(2025年~2030年)Gelatin - Market Share Analysis, Industry Trends & Statistics, Growth Forecasts (2025 - 2030) |
||||||
カスタマイズ可能
適宜更新あり
|
|||||||
| ゼラチン:市場シェア分析、産業動向と統計、成長予測(2025年~2030年) |
|
出版日: 2025年03月18日
発行: Mordor Intelligence
ページ情報: 英文 369 Pages
納期: 2~3営業日
|

全表示
- 概要
- 目次
概要
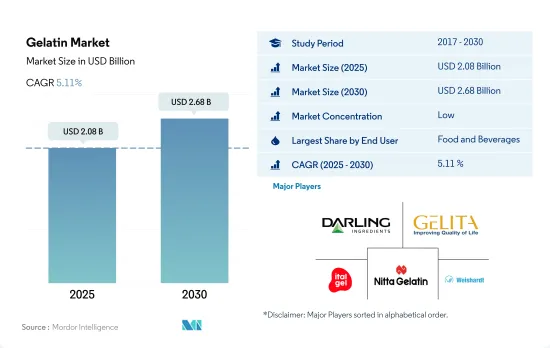
ゼラチンの市場規模は2025年に20億8,000万米ドルと推計され、2030年には26億8,000万米ドルに達すると予測され、予測期間(2025年~2030年)のCAGRは5.11%で成長します。
パーソナルケア重視の高まりにより、プロテインベースのスキンケアおよびヘアケア製品の需要が予測期間中に顕著になります。
- 用途別では、F&Bが世界のゼラチン市場の最大セグメントであり続けています。また、予測期間中、数量ベースで4.46%のCAGRで推移すると予測されます。この成長は主に、伝統的な食品からよりタンパク質ベースのソリューションへの嗜好のシフトによるものです。世界全体では、消費者の約93%が少なくとも数回は健康的な食事をしたいと考えており、63%はほとんど、あるいは常に健康的な食事を心がけています。消費者はまた、自分が摂取している食品や、製品に含まれる成分が健康にどのような影響を与えるかについて、より意識的になっています。ゼラチンに含まれるタンパク質は、腸の保護粘膜を作るなど、腸壁をサポートするのに役立ちます。
- COVID-19の大流行中、コンビニエンス・ミールの家庭内消費は2020年には26%に増加しました。ライフスタイルの選択としての健康の重要性がF&Bセクターの消費者に影響を与えました。しかし予測期間中、ゼラチンは他の乳製品タンパク質よりも平均タンパク質含有率が5%と高いため、パーソナルケアは金額ベースでCAGR 6.29%となり、市場で最も急成長するセグメントとなる見込みです。
- ゼラチンの用途がある他のセグメントは、パーソナルケアと化粧品セグメントだけです。この分野は予測期間中、数量ベースでCAGR 6.31%を記録すると予測されています。フェイスクリーム、ボディローション、シャンプー、ヘアスプレー、日焼け止め、入浴剤、泡風呂液など、数多くの化粧品にゲル化剤としてゼラチンが使用されています。皮膚に使用しても安全で、有害物質を含まず、クリームやローションの保湿剤としてよく働きます。皮膜形成作用があるため、髪のツヤや櫛通りの良さ、肌の滑らかさに効果があります。また、ヘアカラーやティントの顔料をより均一に吸収させる効果もあります。
栄養補助食品需要の高まりがゼラチンの用途を押し上げたため、2022年には欧州が大きなシェアを占める。
- アジア太平洋はゼラチンの最大かつ最も急成長している市場であり、次いで欧州です。両地域はゼラチンタンパク質需要全体の約78.6%を占めています。アジア太平洋地域では食肉産業が確立しているため、ゼラチンが大量に生産され、同地域でのゼラチン原料の入手が容易になっています。アジア太平洋地域、特に中国やインドなどで肥満が増加していることも、市場の成長を後押しする大きな要因となっています。インドでは、太りすぎの女性の割合が20.6%から24%に、男性では18.9%から2021年には22.9%に増加しています。バランスの取れた食生活の一環としてゼラチンベースの製品を摂取することは、ゼラチンの高タンパク低カロリー含有量による減量促進に役立つ可能性があります。
- 欧州では、ロシアが市場を独占し、地域市場の22.5%を占めています。2021年、ロシアのゼラチン売上高は2020年比で8.18%増加したが、これは様々な飲食品用途で牛由来ゼラチンの使用量が増加しているためです。同地域における栄養補助食品需要の高まりは、消費者の健康的でタンパク質が豊富な食生活への傾斜を物語っており、これがゼラチン市場の成長を促進すると期待されています。
- アフリカ地域は、同国における積極的な拡大戦略を反映した商業活動の増加により、ゼラチン市場で大きなシェアを占めています。F&B業界、特にベーカリーや飲料におけるゼラチンの高集積が市場を牽引しました。各社は、消費者の間で人気が高まっている透明な飲料に自然に適合するゼラチンの提供を推進しています。ゼラチンの約2~3%は、ヘイズの原因となる果汁の沈殿物の除去に有用です。
世界のゼラチン市場動向
欧州はパンとビスケットの需要が高い主要市場です。
- ベーカリー分野は、パンやビスケットへの旺盛な需要で繁栄しています。欧州は主要市場であり、ベーカリー製品は食生活の主食としてしっかりと根付いています。消費量のトップはパンで、次いでケーキ、ペストリー、スイートビスケット、クッキーと続きます。生産量は安定しており、ドイツ、フランス、イタリアが消費をリードしています。
- 消費者は、機能的な利点のある製品、天然の糖類、健康と気分を高める特性で有名な食材に引き寄せられます。この動向は、エネルギーの増強、気分の高揚、ストレスの軽減に重点を置いています。また、消費者のラベルに対する意識は高まっており、特にビスケットのラベルを吟味していることからも明らかです。2021年には、米国の成人の87%が食品パッケージの栄養成分表示を日常的にチェックしていました。このような警戒心が、多穀物パンやグルテンフリーパン、タンパク質強化ビスケット、ダイジェスティブ・ビスケットの需要を大きく促進しています。世界のベーカリー業界におけるその他の顕著な動向には、一口サイズのお菓子、オーガニックのビスケットやパンに対する需要の高まり、持続可能なパッケージの重視、ビーガンや植物由来の製品への嗜好の高まりなどがあります。
- 原料メーカーは、ビスケットメーカーが「フリーフロム」や「クリーンラベル」製品の需要に応えられるよう、技術革新を進めています。例えば、ベルギーを拠点とする製パン原料サプライヤー、ピュラトスは、2024年1月にクリーンラベル原料「Intens Soft &Fine」を発表しました。同社によると、この原料はモノグリセリドとジグリセリドに代わるもので、トースト用パン、ハンバーガー用パン、ブリオッシュ、パネトーネ、ドーナツなどの製品において、保存期間を通じて食感と品質を改善します。
ゼラチン製造業者の原料として主に使用されるのは肉です。
- ゼラチンの原料は、その産地によって異なります。動物性ゼラチンは骨、組織、その他の動物の部位から得られるが、海洋性ゼラチンは主に魚を使用します。そのため、と殺場や牛、豚、魚の養殖場からの原料に大きく依存しています。インドには2017年、政府公認のと殺場が72カ所あり、世界最大級の食肉生産国となっています。
- 牛、豚、魚の食肉生産は、パンデミック中にと畜場が閉鎖されたため減少し、すべての地域に影響を及ぼしました。COVID-19パンデミックがもたらした課題にもかかわらず、EUの養豚業界は中国からの旺盛な輸出需要を視野に入れ、母豚の頭数を増やして2020年を迎えました。しかし、欧州北西部ではと殺が制限されるなど、市場はパンデミックによる障害に直面しました。注目すべきは、ドイツにおける豚の価格が、中国の販売が減少する中でも急上昇し、2021年5月には約10セント上昇して1kgあたり1.54ユーロ(1.67米ドル)となったことです。過去50年間で、世界の食肉需要は急増し、生産量は3倍増の年間3億5,000万トンを超えました。顕著な変化として、アジア太平洋が世界最大の食肉生産国として台頭し、世界の状況を大きく変えています。
- 中国のような国々は、動物性タンパク質の自給に軸足を移しています。2021年12月、中国の国家農業農村委員会は、現在の生産量から35%増となる年間5,500万トンの豚肉生産という野心的な目標を発表しました。
ゼラチン産業の概要
ゼラチン市場は断片化されており、上位5社で10.96%を占めています。この市場の主要企業は以下の通り。 Darling Ingredients Inc., Gelita AG, Italgelatine SpA, Nitta Gelatin Inc. and SAS Gelatines Weishardt(sorted alphabetically).
その他の特典
- エクセル形式の市場予測(ME)シート
- 3ヶ月のアナリストサポート
目次
第1章 エグゼクティブサマリーと主な調査結果
第2章 イントロダクション
- 調査の前提条件と市場定義
- 調査範囲
- 調査手法
第3章 主要産業動向
- エンドユーザー市場規模
- ベビーフードおよび乳児用調製粉乳
- ベーカリー
- 飲料
- 朝食用シリアル
- 調味料/ソース
- 菓子類
- 乳製品および乳製品代替製品
- 高齢者栄養・医療栄養
- 肉・鶏肉・魚介類および肉代替製品
- RTE/RTC食品
- スナック
- スポーツ/パフォーマンス栄養
- 動物飼料
- パーソナルケアと化粧品
- タンパク質消費動向
- 動物
- 生産動向
- 動物
- 規制の枠組み
- 中国
- フランス
- ドイツ
- インド
- イタリア
- 日本
- 英国
- 米国
- バリューチェーンと流通チャネル分析
第4章 市場セグメンテーション
- 形態
- 動物性
- 海洋ベース
- エンドユーザー
- 食品・飲料
- サブエンドユーザー別
- ベーカリー
- 飲料
- 調味料/ソース
- 菓子類
- 乳製品・乳製品代替品
- RTE/RTC食品
- スナック
- パーソナルケアと化粧品
- サプリメント
- サブエンドユーザー別
- 食品・飲料
- 地域別
- アフリカ
- 形態別
- エンドユーザー別
- 国別
- ナイジェリア
- 南アフリカ
- その他のアフリカ
- アジア太平洋
- 形態別
- エンドユーザー別
- 国別
- オーストラリア
- 中国
- インド
- インドネシア
- 日本
- マレーシア
- ニュージーランド
- 韓国
- タイ
- ベトナム
- その他のアジア太平洋
- 欧州
- 形態別
- エンドユーザー別
- 国別
- ベルギー
- フランス
- ドイツ
- イタリア
- オランダ
- ロシア
- スペイン
- トルコ
- 英国
- その他の欧州
- 中東
- 形態別
- エンドユーザー別
- 国別
- イラン
- サウジアラビア
- アラブ首長国連邦
- その他の中東
- 北米
- 形態別
- エンドユーザー別
- 国別
- カナダ
- メキシコ
- 米国
- その他北米
- 南米
- 形態別
- エンドユーザー別
- 国別
- アルゼンチン
- ブラジル
- その他の南米
- アフリカ
第5章 競合情勢
- 主要な戦略動向
- 市場シェア分析
- 企業情勢
- 企業プロファイル.
- ASAHI GELATINE INDUSTRIAL Co. Ltd
- Darling Ingredients Inc.
- Gelita AG
- Italgelatine SpA
- Jellice Pioneer Private Limited
- Nippi. Inc.
- Nitta Gelatin Inc.
- SAS Gelatines Weishardt
第6章 CEOへの主な戦略的質問
第7章 付録
- 世界概要
- 概要
- ファイブフォース分析フレームワーク
- 世界のバリューチェーン分析
- 市場力学(DROs)
- 情報源と参考文献
- 図表一覧
- 主要洞察
- データパック
- 用語集
目次
Product Code: 90228
The Gelatin Market size is estimated at 2.08 billion USD in 2025, and is expected to reach 2.68 billion USD by 2030, growing at a CAGR of 5.11% during the forecast period (2025-2030).
Rising emphasis on personal care, demand for protein-based skincare and hair care products will gain prominence during the forecast period
- By application, F&B remained the largest segment in the global gelatin market. It is also anticipated to register a nominal CAGR of 4.46%, by volume, during the forecast period. This growth is primarily due to shifting preferences from traditional foods to more protein-based solutions. Globally, about 93% of consumers want to eat healthy at least a few times, with 63% trying to eat healthy most or all of the time. Consumers are also more conscious about the foods they are consuming and how the ingredients in any product affect their health. The proteins in gelatin can help support the intestinal wall, including building the protective mucus lining in the intestines.
- During the COVID-19 outbreak, in-home consumption of convenience meals increased to 26% in 2020. The importance of health as a lifestyle choice influenced consumers in the F&B sector. However, during the forecast period, personal care is expected to be the market's fastest-growing segment, with a CAGR of 6.29% by value, as gelatin has a higher average protein content of 5% than other dairy proteins.
- The only other segment with an application for gelatin is the personal care and cosmetics segment. The segment is projected to record a CAGR of 6.31%, by volume, during the forecast period. Numerous cosmetic products, such as face creams, body lotions, shampoos, hair sprays, sunscreens, bath salts, and bubble bath liquids, use gelatin as a gelling agent. It is safe for use on the skin, contains no toxic substances, and works well as a moisturizer in creams and lotions. It benefits the shine and combability of hair and the smoothness of skin due to its film-forming properties. It also ensures that pigments in hair colors and tints are absorbed more uniformly.
Europe holds significant share in 2022 due to growing demand for dietary supplements across the region drove the application of gelatin
- Asia-Pacific is the largest and fastest-growing market for gelatin, followed by Europe. Both regions account for approximately 78.6% of the overall gelatin protein demand. The established meat industry of the Asia-Pacific region yields immense gelatin, making it easier to access the ingredient in the region. The increasing obesity in the Asia-Pacific region, particularly in countries like China and India, has also been another major factor boosting the market's growth. In India, the percentage of overweight women rose from 20.6% to 24%, while in men, the number increased from 18.9% to 22.9% in 2021. Consuming gelatin-based products as part of a balanced diet may help promote weight loss due to gelatin's high protein and low-calorie contents.
- In Europe, Russia dominated the market and accounted for 22.5% of the regional market. In 2021, gelatin sales in Russia went up by 8.18% compared to 2020, attributed to the increasing usage of bovine-based gelatin in various food and beverage applications. The rising demand for dietary supplements in the region accounts for the shifting inclination of consumers toward healthy and protein-rich diets, which is expected to drive the growth of the gelatin market.
- The African region holds a significant share of the gelatin market due to increased commercial activity, reflecting an aggressive expansion strategy in the country. High gelatin integration in the F&B industry, particularly in bakeries and beverages, drove the market. Companies are promoting their gelatin offerings as a natural fit for clear beverages, which are becoming increasingly popular among consumers. About 2-3% of gelatin is useful for removing fruit juice precipitates that may cause haze.
Global Gelatin Market Trends
Europe is the leading market with a high demand for bread and biscuits
- The bakery segment thrives on strong demand for bread and biscuits, celebrated for celebrated for their snack convenience. Europe is the leading market, with bakery items firmly rooted as dietary staples. Bread tops the consumption list, followed by cakes, pastries, sweet biscuits, and cookies. Production remains consistent, with Germany, France, and Italy leading in consumption.
- Consumers gravitate toward products with functional benefits, natural sugars, and ingredients celebrated for their health and mood-boosting properties. This trend focuses on energy enhancement, mood elevation, and stress reduction. Also, consumers have a heightened consciousness of labels, particularly evident in their scrutiny of biscuit labels. In 2021, 87% of US adults routinely checked the nutrition facts label on food packages. This vigilance has significantly spurred demand for multigrain and gluten-free breads, protein-enriched biscuits, and digestive biscuits. Other prominent trends in the global bakery landscape encompass a rising demand for bite-sized treats, organic biscuits and breads, an emphasis on sustainable packaging, and an increasing preference for vegan and plant-based offerings.
- Ingredient manufacturers are innovating to help biscuit makers meet the demand for 'free-from' and 'clean-label' products. For instance, Puratos, a Belgium-based baking ingredient supplier, unveiled its clean-label ingredient, Intens Soft & Fine, in January 2024. According to the company, this ingredient replaces mono- and diglycerides, offering improved texture and quality throughout their shelf life for products such as toast bread, hamburger buns, brioche, panettone, and donuts.
Meat is majorly used as raw material by gelatin manufacturers
- The gelatin industry's raw materials differ depending on the source. Animal-based gelatin is derived from bones, tissues, and other animal parts, while marine-based gelatin primarily uses fish. As a result, companies rely significantly on raw materials from slaughterhouses and cattle, pig, and fish farms. India had 72 government-approved abattoirs in 2017, making it one of the largest meat-producing countries across the world.
- The production of bovine, porcine, and fish meat witnessed a decline as slaughterhouses shuttered during the pandemic, affecting all regions. Despite the challenges posed by the COVID-19 pandemic, the European Union's swine industry entered 2020 with a larger sow herd, eyeing robust export demand from China. However, the market faced hurdles due to the pandemic, including slaughter restrictions in Northwestern Europe. Notably, pig prices in Germany surged, even in the face of diminished Chinese sales, climbing by about 10 cents to EUR 1.54 (USD 1.67) per kg in May 2021. Over the past five decades, global meat demand has surged, with production tripling to exceed 350 million tonnes annually. In a notable shift, Asia-Pacific has emerged as the world's largest meat producer, significantly altering the global landscape.
- Countries like China are pivoting toward self-sufficiency in animal protein. A prime example is China's National Conference of Agricultural and Rural Affairs, which, in December 2021, unveiled an ambitious pork production target of 55 million tons annually, marking a 35% increase from its current output.
Gelatin Industry Overview
The Gelatin Market is fragmented, with the top five companies occupying 10.96%. The major players in this market are Darling Ingredients Inc., Gelita AG, Italgelatine SpA, Nitta Gelatin Inc. and SAS Gelatines Weishardt (sorted alphabetically).
Additional Benefits:
- The market estimate (ME) sheet in Excel format
- 3 months of analyst support
TABLE OF CONTENTS
1 EXECUTIVE SUMMARY & KEY FINDINGS
2 INTRODUCTION
- 2.1 Study Assumptions & Market Definition
- 2.2 Scope of the Study
- 2.3 Research Methodology
3 KEY INDUSTRY TRENDS
- 3.1 End User Market Volume
- 3.1.1 Baby Food and Infant Formula
- 3.1.2 Bakery
- 3.1.3 Beverages
- 3.1.4 Breakfast Cereals
- 3.1.5 Condiments/Sauces
- 3.1.6 Confectionery
- 3.1.7 Dairy and Dairy Alternative Products
- 3.1.8 Elderly Nutrition and Medical Nutrition
- 3.1.9 Meat/Poultry/Seafood and Meat Alternative Products
- 3.1.10 RTE/RTC Food Products
- 3.1.11 Snacks
- 3.1.12 Sport/Performance Nutrition
- 3.1.13 Animal Feed
- 3.1.14 Personal Care and Cosmetics
- 3.2 Protein Consumption Trends
- 3.2.1 Animal
- 3.3 Production Trends
- 3.3.1 Animal
- 3.4 Regulatory Framework
- 3.4.1 China
- 3.4.2 France
- 3.4.3 Germany
- 3.4.4 India
- 3.4.5 Italy
- 3.4.6 Japan
- 3.4.7 United Kingdom
- 3.4.8 United States
- 3.5 Value Chain & Distribution Channel Analysis
4 MARKET SEGMENTATION (includes market size in Value in USD and Volume, Forecasts up to 2030 and analysis of growth prospects)
- 4.1 Form
- 4.1.1 Animal Based
- 4.1.2 Marine Based
- 4.2 End User
- 4.2.1 Food and Beverages
- 4.2.1.1 By Sub End User
- 4.2.1.1.1 Bakery
- 4.2.1.1.2 Beverages
- 4.2.1.1.3 Condiments/Sauces
- 4.2.1.1.4 Confectionery
- 4.2.1.1.5 Dairy and Dairy Alternative Products
- 4.2.1.1.6 RTE/RTC Food Products
- 4.2.1.1.7 Snacks
- 4.2.2 Personal Care and Cosmetics
- 4.2.3 Supplements
- 4.2.3.1 By Sub End User
- 4.2.1 Food and Beverages
- 4.3 Region
- 4.3.1 Africa
- 4.3.1.1 By Form
- 4.3.1.2 By End User
- 4.3.1.3 By Country
- 4.3.1.3.1 Nigeria
- 4.3.1.3.2 South Africa
- 4.3.1.3.3 Rest of Africa
- 4.3.2 Asia-Pacific
- 4.3.2.1 By Form
- 4.3.2.2 By End User
- 4.3.2.3 By Country
- 4.3.2.3.1 Australia
- 4.3.2.3.2 China
- 4.3.2.3.3 India
- 4.3.2.3.4 Indonesia
- 4.3.2.3.5 Japan
- 4.3.2.3.6 Malaysia
- 4.3.2.3.7 New Zealand
- 4.3.2.3.8 South Korea
- 4.3.2.3.9 Thailand
- 4.3.2.3.10 Vietnam
- 4.3.2.3.11 Rest of Asia-Pacific
- 4.3.3 Europe
- 4.3.3.1 By Form
- 4.3.3.2 By End User
- 4.3.3.3 By Country
- 4.3.3.3.1 Belgium
- 4.3.3.3.2 France
- 4.3.3.3.3 Germany
- 4.3.3.3.4 Italy
- 4.3.3.3.5 Netherlands
- 4.3.3.3.6 Russia
- 4.3.3.3.7 Spain
- 4.3.3.3.8 Turkey
- 4.3.3.3.9 United Kingdom
- 4.3.3.3.10 Rest of Europe
- 4.3.4 Middle East
- 4.3.4.1 By Form
- 4.3.4.2 By End User
- 4.3.4.3 By Country
- 4.3.4.3.1 Iran
- 4.3.4.3.2 Saudi Arabia
- 4.3.4.3.3 United Arab Emirates
- 4.3.4.3.4 Rest of Middle East
- 4.3.5 North America
- 4.3.5.1 By Form
- 4.3.5.2 By End User
- 4.3.5.3 By Country
- 4.3.5.3.1 Canada
- 4.3.5.3.2 Mexico
- 4.3.5.3.3 United States
- 4.3.5.3.4 Rest of North America
- 4.3.6 South America
- 4.3.6.1 By Form
- 4.3.6.2 By End User
- 4.3.6.3 By Country
- 4.3.6.3.1 Argentina
- 4.3.6.3.2 Brazil
- 4.3.6.3.3 Rest of South America
- 4.3.1 Africa
5 COMPETITIVE LANDSCAPE
- 5.1 Key Strategic Moves
- 5.2 Market Share Analysis
- 5.3 Company Landscape
- 5.4 Company Profiles (includes Global Level Overview, Market Level Overview, Core Business Segments, Financials, Headcount, Key Information, Market Rank, Market Share, Products and Services, and Analysis of Recent Developments).
- 5.4.1 ASAHI GELATINE INDUSTRIAL Co. Ltd
- 5.4.2 Darling Ingredients Inc.
- 5.4.3 Gelita AG
- 5.4.4 Italgelatine SpA
- 5.4.5 Jellice Pioneer Private Limited
- 5.4.6 Nippi. Inc.
- 5.4.7 Nitta Gelatin Inc.
- 5.4.8 SAS Gelatines Weishardt
6 KEY STRATEGIC QUESTIONS FOR PROTEIN INGREDIENTS INDUSTRY CEOS
7 APPENDIX
- 7.1 Global Overview
- 7.1.1 Overview
- 7.1.2 Porter's Five Forces Framework
- 7.1.3 Global Value Chain Analysis
- 7.1.4 Market Dynamics (DROs)
- 7.2 Sources & References
- 7.3 List of Tables & Figures
- 7.4 Primary Insights
- 7.5 Data Pack
- 7.6 Glossary of Terms
