
|
市場調査レポート
商品コード
1910556
水素ガス:市場シェア分析、業界動向と統計、成長予測(2026年~2031年)Hydrogen Gas - Market Share Analysis, Industry Trends & Statistics, Growth Forecasts (2026 - 2031) |
||||||
カスタマイズ可能
適宜更新あり
|
|||||||
| 水素ガス:市場シェア分析、業界動向と統計、成長予測(2026年~2031年) |
|
出版日: 2026年01月12日
発行: Mordor Intelligence
ページ情報: 英文 120 Pages
納期: 2~3営業日
|

概要
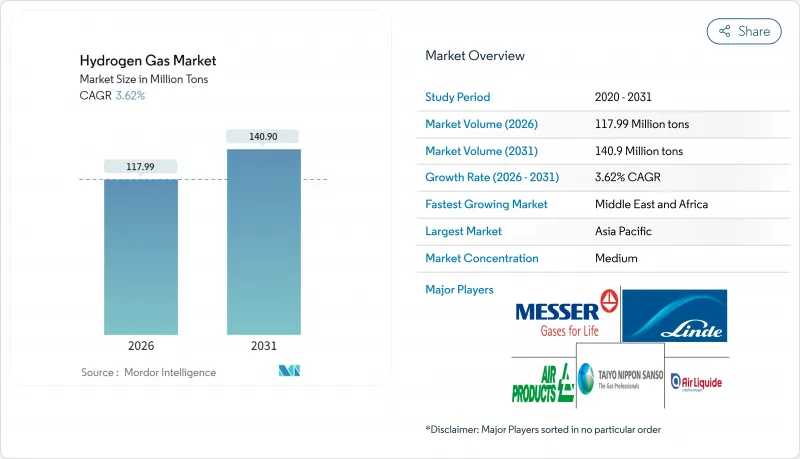
水素ガス市場は、2025年の1億1,386万トンから2026年には1億1,799万トンへ成長し、2026年から2031年にかけてCAGR3.62%で推移し、2031年までに1億4,090万トンに達すると予測されております。
コスト競争力に基づく地域間競争、政府補助金、脱炭素化義務が水素ガス市場を形作る主要な要因であり、日本は全国インフラ整備に200億米ドルを計上し、欧州連合(EU)は2030年までに天然ガス網への水素20%混合を推進しています。生産拠点と炭素排出量は戦略的配置を決定する要素となり、生産者は低コストの再生可能エネルギーや天然ガス資源の近くに電解施設やブルー水素製造施設を併設するよう促されています。中東やオーストラリアにおける新興輸出拠点は新たな貿易の次元を加え、燃料電池車の着実な普及は基盤需要を構築し、より広範な給油ネットワークを支える基盤となっています。
世界の水素ガス市場の動向と展望
低炭素アンモニア生産への需要
海運業界の脱炭素化がグリーンアンモニア需要を喚起し、輸送業者がカーボンニュートラルな燃料補給ソリューションを求める中で水素ガス市場の重要性が高まっています。国際海事機関(IMO)の2050年ネットゼロ公約は生産者の転換を加速させており、ヤラ社やアンジー社は再生可能エネルギーを肥料複合施設に接続し、炭素制約市場における輸出適格性を確保しています。競争優位性は、単なる原料価格ではなく水素の炭素強度にかかっており、アンモニア関連の水素量に長期的な構造的成長をもたらしています。
製油所脱硫規制
2020年のIMO硫黄規制上限および地域別燃料品質基準により、製油所向け水素需要は約15%増加し、水素ガス市場におけるベースロード需要の基盤が確立されました。高粘度原油の処理にはより高度な水素化処理が必要となるため、製油所隣接地でのブルー水素投資が促進されています。こうした専有統合モデルは需要の確実性を保証するとともに、共有ユーティリティを通じた炭素回収の経済性を合理化します。
グリーン/ブルー水素生産の高コスト
グリーン水素の生産コストは、再生可能電力価格と電解装置の性能により現在1kgあたり3~8米ドルの範囲であり、1~2米ドルのグレー水素を凌駕しています。ブルー水素はコスト差を縮めますが、炭素回収コストと規制当局の監視を伴います。現時点では炭素価格制度に準拠した高付加価値用途のみがこれらのコスト増を吸収可能であり、水素ガス市場全体での普及は一時的に制限されています。
セグメント分析
パイプラインネットワークは、大規模産業回廊が既存の用地権資産を活用する中、2025年に水素ガス市場シェアの58.36%を占め、この輸送方式は2031年までCAGR4.06%で拡大しています。欧州水素バックボーン計画の28,000kmに及ぶパイプライン網は、道路トレーラー輸送と比較して配送コストを30~50%削減し、水素ガス市場全体での規模の経済性を強化します。高圧チューブトレーラーは孤立した需要拠点や初期段階の導入において依然として重要であり、シリンダーは特殊用途や遠隔地のユーザー向けに使用されます。
既存ガス網のない新興市場では、チューブトレーラー物流が整備格差を埋める架け橋となり、輸送コストの高さにもかかわらず早期導入を促進します。欧米で認可手続きが加速する中、専用水素パイプラインは精製クラスターから鉄鋼・化学プラントへ拡大し、産業脱炭素化の深化と水素ガス市場の拡大に必要な基盤を提供します。
水素ガス市場レポートは、流通形態(パイプライン、高圧チューブトレーラー、シリンダー)、用途(アンモニア、メタノール、精製、直接還元鉄、燃料電池車、その他用途)、地域(アジア太平洋、北米、欧州、南米、中東・アフリカ)別に分析されています。市場予測は数量(トン)単位で提供されます。
地域別分析
2025年における水素ガス市場規模の34.12%をアジア太平洋地域が占めており、中国における重工業分野での導入拡大、日本の水素社会構想、韓国の燃料電池発電導入が牽引役となっております。中国のカーボンニュートラル公約と水素製鉄パイロットプロジェクトが、同地域の需要量を高い水準に維持しております。日本の200億米ドル規模の公的資金は供給・需要インフラ双方の整備を加速させており、韓国のK-ニューディールでは水素を電力・交通目標に統合しています。
欧州はREPowerEU計画のもと、ガス供給多様化の戦略的手段として水素を位置付け、国内電解装置建設と輸入ターミナル投資を促進しています。ドイツは電解設備容量で首位を走り、オランダはロッテルダムを世界水素輸送の欧州輸入拠点へと再構築中です。北欧の水力・風力資源はグリーン水素輸出の基盤となり、ノルウェーは欧州需要に対応するパイプライン・海上輸送ルートの開拓を進めています。
北米は豊富な天然ガス埋蔵量を活かしブルー水素の経済性を追求すると同時に、95億米ドル規模の水素ハブ計画でグリーン水素生産を拡大しています。カリフォルニア州の低炭素燃料基準はアジア以外で世界最大規模の充填ネットワークを支え、カナダはアジア向け液化水素輸出による輸出価格競争力の達成を目指しています。中東・アフリカ地域は4.03%という最速のCAGRを記録しており、サウジアラビアのNEOMプロジェクトやUAEの輸出ロードマップが牽引役となっています。これらの取り組みは、豊富な太陽光資源と大規模電解技術を結びつけ、地元産業と海外消費者の双方に供給することを目指しています。
その他の特典:
- エクセル形式の市場予測(ME)シート
- アナリストによる3ヶ月間のサポート
よくあるご質問
目次
第1章 イントロダクション
- 調査の前提条件と市場の定義
- 調査範囲
第2章 調査手法
第3章 エグゼクティブサマリー
第4章 市場情勢
- 市場概要
- 市場促進要因
- 低炭素アンモニア生産への需要
- 製油所脱硫規制
- グリーン水素に対する政府の奨励策
- 燃料電池車の導入拡大
- 水素ガス混入義務化
- 市場抑制要因
- グリーン/ブルー水素の生産コストの高さ
- 高コストな貯蔵・輸送ロジスティクス
- 新規水素パイプラインに対する地域住民の反対
- バリューチェーン分析
- ポーターのファイブフォース
- 供給企業の交渉力
- 買い手の交渉力
- 新規参入業者の脅威
- 代替品の脅威
- 競争企業間の敵対関係
第5章 市場規模と成長予測
- 流通別
- パイプライン
- 高圧チューブトレーラー
- シリンダー
- 用途別
- アンモニア
- メタノール
- 精製
- 直接還元鉄(DRI)
- 燃料電池自動車(FCV)
- その他の用途
- 地域別
- アジア太平洋地域
- 中国
- インド
- 日本
- 韓国
- ASEAN諸国
- その他アジア太平洋地域
- 北米
- 米国
- カナダ
- メキシコ
- 欧州
- ドイツ
- 英国
- フランス
- イタリア
- ロシア
- 北欧諸国
- その他欧州地域
- 南米
- ブラジル
- アルゼンチン
- その他南米
- 中東・アフリカ
- サウジアラビア
- 南アフリカ
- その他中東・アフリカ地域
- アジア太平洋地域
第6章 競合情勢
- 市場集中度
- 戦略的動向
- 市場シェア/順位分析
- 企業プロファイル
- Aditya Birla Chemicals
- Air Liquide
- Air Products and Chemicals, Inc.
- BASF SE
- Equinor ASA
- Gulf Cryo
- Iwatani Corp.
- Kawasaki Heavy Industries, Ltd.
- Linde plc
- MATHESON Tri-Gas, Inc.
- Messer SE & Co. KGaA
- TAIYO NIPPON SANSO CORPORATION

