
|
市場調査レポート
商品コード
1687282
シュガーフリーチューインガム:市場シェア分析、産業動向・統計、成長予測(2025年~2030年)Sugar-free Chewing Gum - Market Share Analysis, Industry Trends & Statistics, Growth Forecasts (2025 - 2030) |
||||||
カスタマイズ可能
適宜更新あり
|
|||||||
| シュガーフリーチューインガム:市場シェア分析、産業動向・統計、成長予測(2025年~2030年) |
|
出版日: 2025年03月18日
発行: Mordor Intelligence
ページ情報: 英文 294 Pages
納期: 2~3営業日
|

全表示
- 概要
- 目次
シュガーフリーチューインガム市場規模は2025年に86億1,000万米ドルと推定・予測され、2030年には104億5,000万米ドルに達し、予測期間(2025-2030年)のCAGRは3.94%で成長すると予測されます。
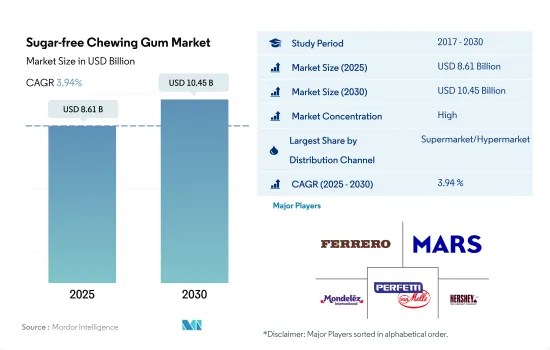
スーパーマーケットとハイパーマーケットは、製品のポジショニングというマーケティング戦略によって、市場の成長を後押ししています。
- 世界の小売セグメントでは、スーパーマーケットとハイパーマーケットが2023年に最大の小売セグメントを構成しました。菓子類の棚における戦略的な製品ポジショニングは、潜在的消費者の衝動購買行動に影響を与えます。Casino Supermarkets、Carrefour、Super U、Lidlは、この地域の大手食料品店経営者です。金額シェアでは、北米地域は数量ベースで29.71%のシェアを獲得しています。この地域では、スーパーマーケットとハイパーマーケットが北米のシュガーフリーチューインガム市場で最大のチャネルです。このチャネルは、2023年の北米のシュガーフリーチューインガム販売における流通チャネル全体のセグメントにおいて、金額ベースで44.21%の主要シェアを占めています。
- コンビニエンスストアは、消費者により便利な買い物体験を提供するため、世界の小売セグメントにおいて2番目に大きな小売業者です。数量ベースでは、アジア太平洋地域は世界の小売事業で2番目に大きいと考えられています。2023年、同地域は数量ベースで25.64%のシェアを獲得しました。コンビニエンスストア・セグメントは、同地域で2番目に大きな小売セグメントと考えられています。コンビニエンスストアを通じたシュガーフリーチューインガムの販売量は、2022年と比較して2024年には8.3%の成長率を記録すると推定されます。
- 他の小売業に比べ、オンライン小売業は最も急成長しているセグメントと考えられています。2021~2023年のCAGRは4.06%を維持しました。また、消費者はワンクリックで買い物ができるオンライン小売を好んでいます。この要因により、消費者は菓子に費やす平均買い物時間を容易に管理できます。
北米とアジア太平洋地域は合わせて世界市場の55%以上を占め、米国と中国が消費者数でトップに立っています。
- 北米地域は、2023年のシュガーフリーチューインガム販売において金額・数量ともに優位を占めています。北米の消費者の多くは、健康的なライフスタイルの一環として低カロリー摂取を優先しており、これがシュガーフリーチューインガムの消費を牽引しています。さらに、糖尿病患者は砂糖の摂取量を注意深く監視する必要があります。無糖ガムは、血糖値に影響を与えることなく、甘い味の選択肢を提供します。2021年には、アメリカ人の約10人に1人、約3,730万人が糖尿病を患っていました。糖尿病と肥満の高い有病率は、消費者が無糖ガムを購入することに影響を与えています。
- 肥満や歯の問題など、砂糖の過剰摂取に伴う健康リスクに対する意識の高まりは、欧州の消費者がガムを含む砂糖入り製品の代替品を求めるきっかけとなっています。さらに、ケト・ダイエットや低炭水化物ダイエットの人気が、チューインガムを含む無糖製品の需要を促進しています。これらのダイエットは、砂糖や炭水化物の消費を減らすことを重視しているからです。したがって、シュガーフリーチューインガムの販売額は2023年に前年比3.25%増加しました。
- 中東地域は、2023~2030年のCAGRが金額ベースで6.55%と最も速い成長を記録すると予想されます。この地域ではサウジアラビアがシュガーフリーチューインガムの消費量が最も多いです。この地域の可処分所得が増加するにつれて、砂糖を減らすような健康的なライフスタイルの選択に対する需要が出現します。チューインガム企業のマーケティング努力も需要に大きな影響を与えています。効果的な広告キャンペーンやプロモーションは消費者の認知度を高め、売上を促進します。さらに、市場プレーヤーがシュガーフリーチューインガムに使用する機能的な主張は、将来の売上を促進すると予想されます。
世界のシュガーフリーチューインガム市場動向
消費者の間で糖尿病や肥満などの健康問題が増加しているため、無糖ガムの需要が高まっています。
- 北米は無糖ガムの主要消費地域であり、アジア太平洋と欧州がこれに続きます。アメリカ人は一日中、息を爽やかにし、口腔衛生を維持するためにチューインガムを消費しています。北米では、砂糖不使用のチューインガムは、砂糖ベースのガムや砂糖ベースのキャンディーの代わりとして、肥満問題を抱える消費者に好まれています。
- フレーバーは、チューインガムを購入する際に最も重要な特性の一つです。人気のあるチューインガムのフレーバーには、ペパーミント、スペアミント、スイカ、シナモン、オリジナル・バブルガム、トロピカルなどがあります。
- 2023年のシュガーフリーチューインガムは売上高が増加しています。2023年、無糖製品は前年比1.34米ドルの成長を記録しました。製品価格の変動は、キシリトール、ガムベース、マルチトールシロップ、マンニトールなどの原材料価格の上下と関連しています。北米では2023年、無糖ガムの平均販売価格は1.54米ドルであり、砂糖ベースのガムの平均販売価格は1.29米ドルでした。無糖ガムの価格は、輸入、包装、風味などの外的要因にも左右されます。さまざまな価格帯でこれらの製品が入手できるため、消費者は好みや予算に応じて製品を購入することができます。北米の平均所得層の消費者は、主にシュガーフリーチューインガムをターゲットにしています。
- 北米では、シュガーフリーチューインガムの消費は一般的に健康の観点から見られています。また、シュガーフリーチューインガムの売上は、肥満者の間で無糖製品に対する需要が高まっていることにも依存しています。さまざまなフレーバーのシュガーフリーチューインガムが入手できるため、この地域の若い世代は健康的な菓子類として楽しんでいます。米国では、スナック・バーの消費という観点から、健康の観点から考慮すべき追加要因がいくつかあります。そのひとつが原材料の重要性です。キシリトールのような成分は、免疫系、消化、脂質、骨代謝を刺激するため、重要だと考えられています。様々なシュガーフリーチューインガムのフレーバーを専門とする主流ブランドが広く浸透していることも、消費者の嗜好を後押ししています。
シュガーフリーチューインガム産業の概要
シュガーフリーチューインガム市場はかなり統合されており、上位5社が85.10%を占めています。この市場の主要企業は以下の通りです。 Ferrero International SA, Mars Incorporated, Mondelez International Inc., Perfetti Van Melle BV and The Hershey Company(sorted alphabetically).
その他の特典:
- エクセル形式の市場予測(ME)シート
- 3ヶ月のアナリストサポート
目次
第1章 エグゼクティブサマリーと主な調査結果
第2章 レポートのオファー
第3章 イントロダクション
- 調査の前提条件と市場定義
- 調査範囲
- 調査手法
第4章 主要産業動向
- 規制の枠組み
- 消費者の購買行動
- 成分分析
- バリューチェーンと流通チャネル分析
第5章 市場セグメンテーション
- 流通チャネル
- コンビニエンスストア
- オンラインストア
- スーパーマーケット/ハイパーマーケット
- その他
- 地域
- アフリカ
- 国別
- エジプト
- ナイジェリア
- 南アフリカ
- その他のアフリカ
- アジア太平洋
- 国別
- オーストラリア
- 中国
- インド
- インドネシア
- 日本
- マレーシア
- ニュージーランド
- 韓国
- その他アジア太平洋地域
- 欧州
- 国別
- ベルギー
- フランス
- ドイツ
- イタリア
- オランダ
- ロシア
- スペイン
- スイス
- トルコ
- 英国
- その他欧州
- 中東
- 国別
- バーレーン
- クウェート
- オマーン
- カタール
- サウジアラビア
- アラブ首長国連邦
- その他中東
- 北米
- 国別
- カナダ
- メキシコ
- 米国
- その他北米地域
- 南米
- 国別
- アルゼンチン
- ブラジル
- その他南米
- アフリカ
第6章 競合情勢
- 主要な戦略動向
- 市場シェア分析
- 企業情勢
- 企業プロファイル
- Chewsy UK Ltd
- Ferndale Foods Limited
- Ferrero International SA
- Lotte Corporation
- Mars Incorporated
- Mazee LLC
- Mondelez International Inc.
- Peppersmith
- Perfetti Van Melle BV
- Simply Good Foods Co.
- Simply Gum Inc.
- The Hershey Company
- The PUR Company Inc.
第7章 CEOへの主な戦略的質問
第8章 付録
- 世界概要
- 概要
- ファイブフォース分析フレームワーク
- 世界のバリューチェーン分析
- 市場力学(DROs)
- 情報源と参考文献
- 図表一覧
- 主要洞察
- データパック
- 用語集
The Sugar-free Chewing Gum Market size is estimated at 8.61 billion USD in 2025, and is expected to reach 10.45 billion USD by 2030, growing at a CAGR of 3.94% during the forecast period (2025-2030).
Supermarkets and hypermarkets, with their marketing strategy of product positioning, are boosting the market to grow
- Under the global retailing segment, supermarkets and hypermarkets comprised the largest retailing segment in 2023. Strategic product positioning on the shelves for the confectionery category influences impulse purchase behavior among potential consumers. Casino Supermarkets, Carrefour, Super U, and Lidl are some of the leading grocery store operators in the region. By value share, the North American region acquired a share of 29.71% by volume. In this region, supermarkets and hypermarkets are the largest channels in the North American sugar-free chewing gum market. The channel held the major share of 44.21% by value in the overall distribution channels segment for North America's sugar-free chewing gum sales in 2023.
- Convenience stores are the second largest retailers in the global retailing segment since they offer consumers a more convenient shopping experience. By volume, the Asia-Pacific region is considered to be the second-largest in the global retailing business. In 2023, the region acquired a share of 25.64% by volume. The convenience store segment is considered the second-largest retailing segment across the region. The sales volume of sugar-free chewing through convenience stores is estimated to register an 8.3% growth rate in 2024 compared to 2022.
- Compared to the other retailers, online retailing is considered the fastest-growing segment. It maintained a CAGR of 4.06% from 2021-2023. Consumers also prefer the online retail segment as a one-click shopping platform. Due to this factor, consumers can easily manage the average shopping time spent on confections.
The North American and Asia-Pacific region together occupy over 55% of the global market, with the United States and China standing at the top with the largest number of consumers
- The North American region dominated in the sales of sugar-free chewing gums in both value and volume in 2023. Many consumers in North America prioritize low-calorie intake as a part of a healthy lifestyle, which in turn drives the consumption of sugar-free chewing gum. Moreover, people with diabetes need to monitor their sugar intake closely. Sugar-free gum provides a sweet-tasting option without affecting blood sugar levels. About 1 in 10 Americans, or around 37.3 million Americans, had diabetes in 2021. The high prevalence of diabetes and obesity are influencing consumers to purchase sugar-free gums.
- Increasing awareness of the health risks associated with excessive sugar consumption, such as obesity and dental problems, has led consumers in Europe to seek alternatives to sugared products, including gum. Moreover, the popularity of keto and low-carb diets has fueled demand for sugar-free products, including chewing gum, as these diets emphasize reducing sugar and carbohydrate consumption. Hence, the sales value of sugar-free chewing gums increased by 3.25% in 2023 compared to the previous year.
- The Middle Eastern region is anticipated to register the fastest growth with a CAGR of 6.55% by value during 2023-2030. Saudi Arabia has the highest consumption of sugar-free chewing gums in the region. As the disposable income in the region increases, the demand for healthy lifestyle choices such as reducing sugar emerges. The marketing efforts of chewing gum companies is also significantly impacting the demand. Effective advertising campaigns and promotions increase consumer awareness and drive sales. Moreover, the functional claims that the market players use for sugar-free chewing gum are anticipated to drive sales in the future.
Global Sugar-free Chewing Gum Market Trends
The growing number of health issues, such as diabetes and obesity among consumers, resulted in the growing demand for the sugar-free option
- North America is the leading sugar-free gum-consuming region, followed by Asia-Pacific and Europe. Americans consume chewing gums to freshen their breath and maintain oral hygiene throughout the day. In North America, sugar-free chewing gums are preferred by consumers who have obesity problems as a replacement for sugar-based gums and sugar-based candies.
- Flavor is one of the most significant attributes when it comes to buying chewing gum. Some popular chewing gum flavors include peppermint, spearmint, watermelon, cinnamon, original bubblegum, and tropical.
- Sugar-free chewing gums in 2023 have been witnessing a hike in their sales. In 2023, sugar-free products recorded a Y-o-Y growth of USD 1.34. The fluctuation in the product's price is connected with the rise and fall in the prices of its raw materials, including xylitol, gum base, maltitol syrup, and mannitol. In North America, in 2023, the average selling price of sugar-free gums was USD 1.54, while sugar-based gums were sold at an average price of USD 1.29. The prices of sugar-free chewing gums also depend upon external factors such as importation, packaging, and flavor. The availability of these products at varied price ranges enables the population to purchase the product according to their preferences and budget. The average-income consumers in North America mainly target sugar-free chewing gums.
- In North America, the consumption of sugar-free chewing gum is generally viewed from a health perspective. The sales of sugar-free chewing gum also depend on the growing demand for sugar-free products among obese individuals. With the availability of sugar-free chewing gum in different flavors, it is enjoyed as a healthy confectionery by the young generation in this region. In the United States, there are a few additional factors to consider from a health perspective in the context of snack bar consumption. One factor is ingredient significance. Ingredients such as xylitol are considered key as they stimulate the immune system, digestion, lipids, and bone metabolism. The widespead penetration of the mainstream brands that specialize in the variety of sugar-free chewing gum flavors also drives consumer preference.
Sugar-free Chewing Gum Industry Overview
The Sugar-free Chewing Gum Market is fairly consolidated, with the top five companies occupying 85.10%. The major players in this market are Ferrero International SA, Mars Incorporated, Mondelez International Inc., Perfetti Van Melle BV and The Hershey Company (sorted alphabetically).
Additional Benefits:
- The market estimate (ME) sheet in Excel format
- 3 months of analyst support
TABLE OF CONTENTS
1 EXECUTIVE SUMMARY & KEY FINDINGS
2 REPORT OFFERS
3 INTRODUCTION
- 3.1 Study Assumptions & Market Definition
- 3.2 Scope of the Study
- 3.3 Research Methodology
4 KEY INDUSTRY TRENDS
- 4.1 Regulatory Framework
- 4.2 Consumer Buying Behavior
- 4.3 Ingredient Analysis
- 4.4 Value Chain & Distribution Channel Analysis
5 MARKET SEGMENTATION (includes market size in Value in USD and Volume, Forecasts up to 2030 and analysis of growth prospects)
- 5.1 Distribution Channel
- 5.1.1 Convenience Store
- 5.1.2 Online Retail Store
- 5.1.3 Supermarket/Hypermarket
- 5.1.4 Others
- 5.2 Region
- 5.2.1 Africa
- 5.2.1.1 By Country
- 5.2.1.1.1 Egypt
- 5.2.1.1.2 Nigeria
- 5.2.1.1.3 South Africa
- 5.2.1.1.4 Rest of Africa
- 5.2.2 Asia-Pacific
- 5.2.2.1 By Country
- 5.2.2.1.1 Australia
- 5.2.2.1.2 China
- 5.2.2.1.3 India
- 5.2.2.1.4 Indonesia
- 5.2.2.1.5 Japan
- 5.2.2.1.6 Malaysia
- 5.2.2.1.7 New Zealand
- 5.2.2.1.8 South Korea
- 5.2.2.1.9 Rest of Asia-Pacific
- 5.2.3 Europe
- 5.2.3.1 By Country
- 5.2.3.1.1 Belgium
- 5.2.3.1.2 France
- 5.2.3.1.3 Germany
- 5.2.3.1.4 Italy
- 5.2.3.1.5 Netherlands
- 5.2.3.1.6 Russia
- 5.2.3.1.7 Spain
- 5.2.3.1.8 Switzerland
- 5.2.3.1.9 Turkey
- 5.2.3.1.10 United Kingdom
- 5.2.3.1.11 Rest of Europe
- 5.2.4 Middle East
- 5.2.4.1 By Country
- 5.2.4.1.1 Bahrain
- 5.2.4.1.2 Kuwait
- 5.2.4.1.3 Oman
- 5.2.4.1.4 Qatar
- 5.2.4.1.5 Saudi Arabia
- 5.2.4.1.6 United Arab Emirates
- 5.2.4.1.7 Rest of Middle East
- 5.2.5 North America
- 5.2.5.1 By Country
- 5.2.5.1.1 Canada
- 5.2.5.1.2 Mexico
- 5.2.5.1.3 United States
- 5.2.5.1.4 Rest of North America
- 5.2.6 South America
- 5.2.6.1 By Country
- 5.2.6.1.1 Argentina
- 5.2.6.1.2 Brazil
- 5.2.6.1.3 Rest of South America
- 5.2.1 Africa
6 COMPETITIVE LANDSCAPE
- 6.1 Key Strategic Moves
- 6.2 Market Share Analysis
- 6.3 Company Landscape
- 6.4 Company Profiles
- 6.4.1 Chewsy UK Ltd
- 6.4.2 Ferndale Foods Limited
- 6.4.3 Ferrero International SA
- 6.4.4 Lotte Corporation
- 6.4.5 Mars Incorporated
- 6.4.6 Mazee LLC
- 6.4.7 Mondelez International Inc.
- 6.4.8 Peppersmith
- 6.4.9 Perfetti Van Melle BV
- 6.4.10 Simply Good Foods Co.
- 6.4.11 Simply Gum Inc.
- 6.4.12 The Hershey Company
- 6.4.13 The PUR Company Inc.
7 KEY STRATEGIC QUESTIONS FOR CONFECTIONERY CEOS
8 APPENDIX
- 8.1 Global Overview
- 8.1.1 Overview
- 8.1.2 Porter's Five Forces Framework
- 8.1.3 Global Value Chain Analysis
- 8.1.4 Market Dynamics (DROs)
- 8.2 Sources & References
- 8.3 List of Tables & Figures
- 8.4 Primary Insights
- 8.5 Data Pack
- 8.6 Glossary of Terms
