
ソフトドリンク:市場シェア分析、産業動向・統計、成長予測(2025年~2030年)
Soft Drinks - Market Share Analysis, Industry Trends & Statistics, Growth Forecasts (2025 - 2030)- 発行日
- ページ情報
- 英文 525 Pages
- 納期
- 2~3営業日
- 商品コード
- 1684084
- カスタマイズ可能 お客様のご希望に応じて、既存データの加工や未掲載情報(例:国別セグメント)の追加などの対応が可能です。詳細はお問い合わせください。
- 適宜更新あり 本レポートは最新情報反映のため適宜更新し、内容構成変更を行う場合があります。ご検討の際はお問い合わせください。
- 翻訳ツール提供対象 PDF対応AI翻訳ツールの無料貸し出しサービスのご利用が可能です
概要
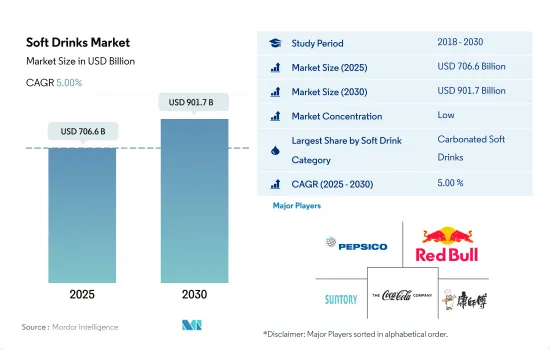
ソフトドリンク市場規模は2025年に7,066億米ドルと推定され、2030年には9,017億米ドルに達し、予測期間中(2025年~2030年)のCAGRは5.00%で成長すると予測されます。
より健康的で機能的な飲料への需要が地域間で高まっていることが、ソフトドリンクの成長を後押ししています。
- 2023年の世界市場は炭酸飲料が支配的でした。クリーンラベル、グルテンフリー、低カロリー、低炭水化物オプションに対する消費者の嗜好の高まりが、飲食品業界における低カロリー炭酸飲料セグメントの成長を促進しました。コカ・コーラやペプシのような主要企業は、より幅広い消費者層を惹きつけるために、ゼロカロリー製品にさまざまなフレーバーを導入し、積極的に革新を図っています。砂糖入り飲料の消費を抑制するため、増税などの財政措置を採用している国もあります。その結果、炭酸飲料市場は2019年から2023年にかけて金額ベースで14.68%の堅調な成長を遂げました。
- ジュース分野は市場第2位のカテゴリーとして重要な地位を占めています。ジュースに対する世界の消費者の嗜好は、健康とウェルネスの動向、製品の発売、パッケージの強化によって形成されています。米国では、ジュースとスムージーの消費者の40%が2023年にジュースの摂取量を増やすが、これは主にビタミンの摂取量を増やしたいという欲求によるものです。2022年には、中国の消費者の約半数が健康的なライフスタイルを優先し、32%が栄養価の高いジュースを含む健康に焦点を当てた製品を特に購入しています。
- RTD(レディ・トゥ・ドリンク)茶は、2024~2030年のCAGRが7.25%と予測され、最も急成長しているソフトドリンク・カテゴリーとして浮上しています。RTD茶の処方、特に健康志向の消費者へのアピールは極めて重要です。メーカー各社は低カロリーや無糖の製品を投入することで対応しており、消費者は過剰なカロリーを気にすることなく豊かなコーヒーの風味を味わうことができます。この戦略的な動きは、売上を強化し、今後数年間の市場成長を促進すると予想されます。
幅広い種類のソフトドリンクの入手可能性と継続的な技術革新が需要を牽引
- 2021年から2023年にかけて、ソフトドリンクの世界販売額は8.38%急増しました。炭酸飲料市場は、堅調な製品広告、持ち運びに便利な飲食品オプションへの嗜好、ますます忙しくなるライフスタイルに牽引され、長期的な成長が見込まれています。今日の健康志向の消費者は、飲料の選択において栄養と味の両方を優先しています。特筆すべきは、業界大手各社が積極的に生分解性包装材料に移行していることで、環境持続可能性へのコミットメントが反映されています。
- 開発途上地域であるアジア太平洋は、2023年から2026年にかけて19.88%の大幅な販売額成長が見込まれます。主要企業は、より幅広い消費者層を魅了するために、ゼロカロリー製品に新しいフレーバーを導入し、絶えず革新を続けています。低糖質・低カロリーの選択肢を求める消費者の需要が高まっており、一部の国では砂糖入り飲料の消費を効果的に抑制するため、増税などの財政措置を実施しています。
- 2024年から2030年にかけて、アフリカのソフトドリンク市場はCAGR 8.35%と予測され、最も急成長する地域に浮上します。可処分所得の増加、急速な都市化、金融セクターの拡大、ナイジェリアやケニアといった国々での大規模な製品発売といった要因が、業界の成長を促進すると予想されます。2020年の中東の飲料消費量は、乳製品が37億3,300万リットル、ジュース、ネクター、スティル飲料が26億4,600万リットル、コーヒーと紅茶が69億900万リットル、パック入り飲料水が113億1,000万リットル、炭酸飲料が29億8,100万リットルの合計278億5,700万リットルでした。この大幅な消費量は増加傾向にあり、飲料分野への市場参入と製品革新の十分な機会をもたらしています。
世界のソフトドリンク市場動向
消費者の嗜好の変化に対応する、ユニークなフォーメーションとフレーバーの絶え間ないイノベーション
- 2023年のソフトドリンク市場の1人当たり平均消費量は42.91リットルRTDコーヒー、RTD紅茶、RTDジュース、エナジードリンクは、便利で健康的な利点があるため需要が高いです。ソフトドリンクの消費量は、健康と快適さへの継続的な関心のおかげで急速に増加しています。
- 最近の動向は、健康志向を強める幅広い消費者に対応するために開発が続けられており、ペプシのようなブランドは最近、マンゴー風味のペプシ・ゼロ・シュガー・コーラ・ソフトドリンクを発売しました。しかし、ジュースとネクター、炭酸飲料、アイスティーは、2022年に最も発売されたソフトドリンクのサブカテゴリーです。
- 平均小売価格は、2019年の355ml当たり0.3米ドルから2023年には0.5米ドルに上昇しています。しかし、2023年のソフトドリンク市場の1人当たり収益は111.20米ドルです。世界比較では、炭酸飲料の売上が9.7%増の351億米ドルとなった米国(5月15日までの52週間、米国の多店舗合計)で最も多くの売上が生み出されています。
- ソフトドリンク水を飲むと、多くの人がエネルギーが一気に高まるのを経験しています。人の気持ちを高揚させ、エネルギーを回復させるのにも役立ちます。炭酸飲料を飲むと、吐き気が楽になります。さらに、水に加えてソフトドリンク水も、身体が最低限必要とする水分を満たしています。
ソフトドリンク業界の概要
ソフトドリンク市場は細分化されており、上位5社で15.14%を占めています。この市場の主要企業は以下の通り。 PepsiCo, Inc., Red Bull GmbH, Suntory Holdings Limited, The Coca-Cola Company and Tingyi(Cayman Islands)Holding Corporation(sorted alphabetically).
その他の特典
- エクセル形式の市場予測(ME)シート
- 3ヶ月のアナリストサポート
目次
第1章 エグゼクティブサマリーと主な調査結果
第2章 レポートのオファー
第3章 イントロダクション
- 調査の前提条件と市場定義
- 調査範囲
- 調査手法
第4章 主要産業動向
- 消費者の購買行動
- イノベーション
- ブランドシェア分析
- 規制の枠組み
第5章 市場セグメンテーション
- ソフトドリンクカテゴリー
- 炭酸飲料
- ソフトドリンクタイプ別
- ダイエットコーラ
- フルーツフレーバー炭酸飲料
- スタンダードコーラ
- その他のタイプ
- エナジードリンク
- ソフトドリンクタイプ別
- エナジーショット
- ナチュラル/オーガニック・エナジードリンク
- 無糖・低カロリー・エナジードリンク
- 伝統的エナジードリンク
- その他のエナジードリンク
- ジュース
- ソフトドリンクタイプ別
- 100%ジュース
- ジュース飲料(果汁24%以下)
- 濃縮ジュース
- ネクター(果汁25~99)
- RTDコーヒー
- ソフトドリンクタイプ別
- コールドブリューコーヒー
- アイスコーヒー
- その他RTDコーヒー
- RTDティー
- ソフトドリンクタイプ別
- 緑茶
- ハーブティー
- アイスティー
- その他RTDティー
- スポーツドリンク
- ソフトドリンクタイプ別
- 電解質強化水
- ハイパートニック
- ハイポトニック
- アイソトニック
- プロテインベースのスポーツドリンク
- 炭酸飲料
- 包装タイプ
- 無菌パッケージ
- 使い捨てカップ
- ガラス瓶
- 金属缶
- ペットボトル
- 流通チャネル
- オフトレード
- コンビニエンスストア
- オンラインショップ
- 専門店
- スーパーマーケット/ハイパーマーケット
- その他
- オン・トレード
- オフトレード
- 地域
- アフリカ
- エジプト
- ナイジェリア
- 南アフリカ
- その他のアフリカ
- アジア太平洋
- オーストラリア
- 中国
- インド
- インドネシア
- 日本
- マレーシア
- 韓国
- タイ
- ベトナム
- その他のアジア太平洋
- 欧州
- ベルギー
- フランス
- ドイツ
- イタリア
- オランダ
- ロシア
- スペイン
- トルコ
- 英国
- その他の欧州
- 中東
- カタール
- サウジアラビア
- アラブ首長国連邦
- その他の中東
- 北米
- カナダ
- メキシコ
- 米国
- その他の北米
- 南米
- アルゼンチン
- ブラジル
- その他の南米
- アフリカ
第6章 競合情勢
- 主要な戦略動向
- 市場シェア分析
- 企業情勢
- 企業プロファイル
- Asahi Group Holdings, Ltd.
- Eckes-Granini Group GmbH
- Hangzhou Wahaha Group Co., Ltd.
- Keurig Dr Pepper, Inc.
- Monster Beverage Corporation
- Nongfu Spring Co., Ltd.
- PepsiCo, Inc.
- Red Bull GmbH
- Refresco Group BV
- Suntory Holdings Limited
- The Coca-Cola Company
- Tingyi(Cayman Islands)Holding Corporation
- Uni-President Enterprises Corp.
第7章 CEOへの主な戦略的質問CEOへの主な戦略的質問
第8章 付録
- 世界概要
- 概要
- ファイブフォース分析フレームワーク
- 市場力学(DROs)
- 情報源と参考文献
- 図表一覧
- 主要洞察
- データパック
- 用語集
目次
The Soft Drinks Market size is estimated at 706.6 billion USD in 2025, and is expected to reach 901.7 billion USD by 2030, growing at a CAGR of 5.00% during the forecast period (2025-2030).
The growing demand for healthier, functional drinks across the regions is propelling the soft drink growth
- In 2023, the global market was dominated by carbonated soft drinks. The rising consumer preference for clean-label, gluten-free, low-calorie, and low-carb options fueled the growth of the low-calorie carbonated beverages segment in the food industry. Key players like Coca-Cola and Pepsi are actively innovating, introducing a range of flavors in their zero-calorie offerings to attract a wider consumer base. Some countries are employing fiscal measures, such as higher taxes, to curb sugary drink consumption. Consequently, the carbonated soft drinks market witnessed a robust 14.68% growth in value from 2019 to 2023.
- The juice segment holds a significant position as the second-largest category in the market. Global consumer preferences for juices are being shaped by health and wellness trends, product launches, and enhanced packaging. In the US, 40% of juice and smoothie consumers increased their juice intake in 2023, primarily driven by a desire to boost their vitamin intake. In 2022, around half of Chinese consumers prioritized a healthy lifestyle, with 32% specifically purchasing health-focused products, including nutritious juices.
- RTD (ready-to-drink) Tea is emerging as the fastest-growing soft drink category, with a projected value CAGR of 7.25% during 2024-2030. The formulation of RTD tea, especially its appeal to health-conscious consumers, is pivotal. Manufacturers are responding by introducing low-calorie and sugar-free variants, allowing consumers to savor the rich coffee flavor without worrying about excess calories. This strategic move is expected to bolster sales and drive market growth in the coming years.
Availability of soft drinks in a wide range and continuous innovations are driving demand
- From 2021 to 2023, the global sales value of soft drinks surged by 8.38%. The carbonated beverage market is poised for long-term growth, driven by robust product advertising, a preference for convenient on-the-go food options, and increasingly busy lifestyles. Today's health-conscious consumers prioritize both nutrition and taste in their beverage choices. Notably, major industry players are actively transitioning to biodegradable packaging materials, reflecting their commitment to environmental sustainability.
- Asia-Pacific, a developing region, is projected to witness a significant sales value growth of 19.88% from 2023 to 2026. Key players are continuously innovating, introducing new flavors in their zero-calorie offerings to entice a broader consumer base. There is a rising consumer demand for low-sugar and low-calorie options, prompting some countries to implement fiscal measures, such as higher taxes, to curb sugary drink consumption effectively.
- During 2024-2030, the African soft drink market is set to emerge as the fastest-growing region, with a projected CAGR of 8.35%. Factors such as increasing disposable incomes, rapid urbanization, expanding financial sectors, and significant product launches in countries like Nigeria and Kenya are expected to drive industry growth. In 2020, beverage consumption in the Middle East stood at 3,733 million liters of dairy, 2,646 million liters of juice, nectars, and still drinks, 6,909 million liters of coffee and tea, 11,310 million liters of packaged water, and 2,981 million liters of carbonated soft drinks, totaling 27,857 million liters. This substantial consumption volume is on the rise, presenting ample opportunities for market entry and product innovation in the beverage sector.
Global Soft Drinks Market Trends
Continous innovation in flavors along with unique formations are catering to changing consumer preferences
- The average volume per person in the Soft Drinks market amounted to 42.91 liters in 2023. RTD coffee, RTD tea, RTD juices, energy drinks are high in demand due to their convenient and health benefits. The soft drink consumption is increasing rapidly owing to continued attention on health and comfort.
- Products are constantly being developed to cater to a wide range of consumers who are getting more health-conscious, brands like Pepsi recently released Pepsi Zero Sugar Cola Soft Drink with Mango Flavor. However, juices and nectars, carbonated beverages, and iced tea were the most launched soft drink subcategories in 2022.
- The average retail prices has increased from USD 0.3 per 355 ml in 2019 to USD 0.5 per 355 ml in 2023. However, the soft drinks market per person revenues of USD 111.20 are generated in 2023. In global comparison, most revenue is generated in the United States where carbonated beverage sales were up 9.7% totaling USD 35.1 billion for the 52 weeks ending May 15, in total U.S. multi-outlets.
- Many people have experienced a quick boost in their energy after consuming soft drinks. It boosts a person's mind and also helps in regaining energy. Drinking carbonated soft drinks can make consumer feel better in nausea. Furthermore, soft drinks in addition to water also meets the minimum fluid requirement by the body.
Soft Drinks Industry Overview
The Soft Drinks Market is fragmented, with the top five companies occupying 15.14%. The major players in this market are PepsiCo, Inc., Red Bull GmbH, Suntory Holdings Limited, The Coca-Cola Company and Tingyi (Cayman Islands) Holding Corporation (sorted alphabetically).
Additional Benefits:
- The market estimate (ME) sheet in Excel format
- 3 months of analyst support
TABLE OF CONTENTS
1 EXECUTIVE SUMMARY & KEY FINDINGS
2 REPORT OFFERS
3 INTRODUCTION
- 3.1 Study Assumptions & Market Definition
- 3.2 Scope of the Study
- 3.3 Research Methodology
4 KEY INDUSTRY TRENDS
- 4.1 Consumer Buying Behaviour
- 4.2 Innovations
- 4.3 Brand Share Analysis
- 4.4 Regulatory Framework
5 MARKET SEGMENTATION (includes market size in Value in USD and Volume, Forecasts up to 2030 and analysis of growth prospects)
- 5.1 Soft Drink Category
- 5.1.1 Carbonated Soft Drinks
- 5.1.1.1 By Soft Drink Type
- 5.1.1.1.1 Diet Cola
- 5.1.1.1.2 Fruit Flavored Carbonates
- 5.1.1.1.3 Standard Cola
- 5.1.1.1.4 Other Types
- 5.1.2 Energy Drinks
- 5.1.2.1 By Soft Drink Type
- 5.1.2.1.1 Energy Shots
- 5.1.2.1.2 Natural/Organic Energy Drinks
- 5.1.2.1.3 Sugar-free or Low-calories Energy Drinks
- 5.1.2.1.4 Traditional Energy Drinks
- 5.1.2.1.5 Other Energy Drinks
- 5.1.3 Juices
- 5.1.3.1 By Soft Drink Type
- 5.1.3.1.1 100% Juice
- 5.1.3.1.2 Juice Drinks (up to 24% Juice)
- 5.1.3.1.3 Juice concentrates
- 5.1.3.1.4 Nectars (25-99% Juice)
- 5.1.4 RTD Coffee
- 5.1.4.1 By Soft Drink Type
- 5.1.4.1.1 Cold Brew Coffee
- 5.1.4.1.2 Iced coffee
- 5.1.4.1.3 Other RTD Coffee
- 5.1.5 RTD Tea
- 5.1.5.1 By Soft Drink Type
- 5.1.5.1.1 Green Tea
- 5.1.5.1.2 Herbal Tea
- 5.1.5.1.3 Iced Tea
- 5.1.5.1.4 Other RTD Tea
- 5.1.6 Sport Drinks
- 5.1.6.1 By Soft Drink Type
- 5.1.6.1.1 Electrolyte-Enhanced Water
- 5.1.6.1.2 Hypertonic
- 5.1.6.1.3 Hypotonic
- 5.1.6.1.4 Isotonic
- 5.1.6.1.5 Protein-based Sport Drinks
- 5.1.1 Carbonated Soft Drinks
- 5.2 Packaging Type
- 5.2.1 Aseptic packages
- 5.2.2 Disposable Cups
- 5.2.3 Glass Bottles
- 5.2.4 Metal Can
- 5.2.5 PET Bottles
- 5.3 Distribution Channel
- 5.3.1 Off-trade
- 5.3.1.1 Convenience Stores
- 5.3.1.2 Online Retail
- 5.3.1.3 Specialty Stores
- 5.3.1.4 Supermarket/Hypermarket
- 5.3.1.5 Others
- 5.3.2 On-trade
- 5.3.1 Off-trade
- 5.4 Region
- 5.4.1 Africa
- 5.4.1.1 Egypt
- 5.4.1.2 Nigeria
- 5.4.1.3 South Africa
- 5.4.1.4 Rest of Africa
- 5.4.2 Asia-Pacific
- 5.4.2.1 Australia
- 5.4.2.2 China
- 5.4.2.3 India
- 5.4.2.4 Indonesia
- 5.4.2.5 Japan
- 5.4.2.6 Malaysia
- 5.4.2.7 South Korea
- 5.4.2.8 Thailand
- 5.4.2.9 Vietnam
- 5.4.2.10 Rest of Asia-Pacific
- 5.4.3 Europe
- 5.4.3.1 Belgium
- 5.4.3.2 France
- 5.4.3.3 Germany
- 5.4.3.4 Italy
- 5.4.3.5 Netherlands
- 5.4.3.6 Russia
- 5.4.3.7 Spain
- 5.4.3.8 Turkey
- 5.4.3.9 United Kingdom
- 5.4.3.10 Rest of Europe
- 5.4.4 Middle East
- 5.4.4.1 Qatar
- 5.4.4.2 Saudi Arabia
- 5.4.4.3 United Arab Emirates
- 5.4.4.4 Rest of Middle East
- 5.4.5 North America
- 5.4.5.1 Canada
- 5.4.5.2 Mexico
- 5.4.5.3 United States
- 5.4.5.4 Rest of North America
- 5.4.6 South America
- 5.4.6.1 Argentina
- 5.4.6.2 Brazil
- 5.4.6.3 Rest of South America
- 5.4.1 Africa
6 COMPETITIVE LANDSCAPE
- 6.1 Key Strategic Moves
- 6.2 Market Share Analysis
- 6.3 Company Landscape
- 6.4 Company Profiles
- 6.4.1 Asahi Group Holdings, Ltd.
- 6.4.2 Eckes-Granini Group GmbH
- 6.4.3 Hangzhou Wahaha Group Co., Ltd.
- 6.4.4 Keurig Dr Pepper, Inc.
- 6.4.5 Monster Beverage Corporation
- 6.4.6 Nongfu Spring Co., Ltd.
- 6.4.7 PepsiCo, Inc.
- 6.4.8 Red Bull GmbH
- 6.4.9 Refresco Group BV
- 6.4.10 Suntory Holdings Limited
- 6.4.11 The Coca-Cola Company
- 6.4.12 Tingyi (Cayman Islands) Holding Corporation
- 6.4.13 Uni-President Enterprises Corp.
7 KEY STRATEGIC QUESTIONS FOR SOFT DRINK CEOS
8 APPENDIX
- 8.1 Global Overview
- 8.1.1 Overview
- 8.1.2 Porter's Five Forces Framework
- 8.1.3 Market Dynamics (DROs)
- 8.2 Sources & References
- 8.3 List of Tables & Figures
- 8.4 Primary Insights
- 8.5 Data Pack
- 8.6 Glossary of Terms
- 発行日
- 発行
- Mordor Intelligence
- ページ情報
- 英文 525 Pages
- 納期
- 2~3営業日