
|
市場調査レポート
商品コード
1684074
インドネシアのセメント:市場シェア分析、産業動向・統計、成長予測(2025年~2030年)Indonesia Cement - Market Share Analysis, Industry Trends & Statistics, Growth Forecasts (2025 - 2030) |
||||||
カスタマイズ可能
適宜更新あり
|
|||||||
| インドネシアのセメント:市場シェア分析、産業動向・統計、成長予測(2025年~2030年) |
|
出版日: 2025年03月18日
発行: Mordor Intelligence
ページ情報: 英文 194 Pages
納期: 2~3営業日
|

全表示
- 概要
- 目次
概要
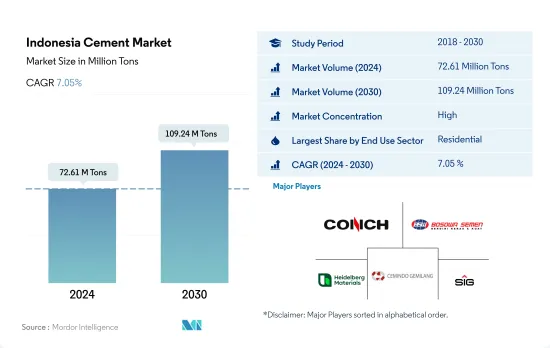
インドネシアのセメント市場規模は2024年に7,261万トンと推定され、2030年には1億924万トンに達し、予測期間中(2024~2030年)のCAGRは7.05%で成長すると予測されます。
政府投資に支えられたインドネシアの産業建設セクターがセメント生産を強化すると予測される
- 建設に欠かせない結合剤であるセメントは、石、レンガ、タイルなどの建材に付着して固まる。住宅、商業、インフラ、工業プロジェクトで幅広く使用されています。2022年、インドネシアのセメント市場量は前年比14.19%減となりました。過剰生産能力と原料価格(特に石炭と原油)の高騰が、同国の建設部門におけるセメント需要を減退させました。しかし、2023年にはプラスに転じ、市場は数量ベースで21.63%の成長が見込まれます。
- 2022年のインドネシアのセメント市場では、住宅建設が3,060万トンを占め、圧倒的な地位を占めていました。2023年には、手頃な価格の住宅イニシアティブ、可処分所得の増加を伴う人口の急増、旺盛な購買力といった要因が新築住宅需要を牽引し、市場は成長する態勢を整えました。2023年の住宅建設床面積は、2022年と比較して5,600万平方フィート増加すると予測され、それに対応してインドネシアの住宅建設用セメント市場は、数量で21.63%成長すると予測されます。
- インドネシアの産業建設用セメント市場は、予測期間中、数量ベースで9.61%の最速CAGRが見込まれています。同国は製造業中心の経済へと着実に移行しており、2045年までに電気自動車と石油化学製品のASEANハブとしての地位を確立することを目指しています。国産品の利用拡大(P3DN)」のようなイニシアチブは、この工業化推進をさらに後押しし、製造ユニットの建設増加とそれに伴うセメント需要の増加につながります。
インドネシアのセメント市場動向
インドネシアの商業用不動産市場規模は2028年までに1兆3,900億米ドルに達すると予測され、商業セクターの需要を増大させる可能性が高いです。
- 2022年、インドネシアの新規商業床面積は前年比9.7%減となりました。この落ち込みは、COVID-19パンデミック時の建築活動の落ち込みから平常に戻った結果です。パンデミック以前から、インドネシアの商業ビルの年間エネルギー原単位は低下傾向を示しており、その割合は年率2.64%でした。しかし、2023年には回復が見られ、新しいオフィス、倉庫、小売スペースを必要とする外国直接投資(FDI)の急増が原動力となって、新しい商業床面積が5.7%増加しました。
- COVID-19が大流行する中、2020年と2021年にインドネシアは、約960万平方フィートを占める新規商業床面積の大幅な急増を示しました。政府が経済活性化に注力した結果、民間・公共プロジェクトともに建設関連の検疫が緩和されるなどの措置がとられました。これにより、従業員は現場での仕事を再開し、企業は事業を継続できるようになりました。特筆すべきは、インドネシアの完成工事高が2020年には約1兆3,200億IDRに達し、2021年には1兆4,200億IDRに増加することです。
- インドネシアの新規商業床面積は、2023年比で2030年までに約58.72%の大幅な伸びが予測されています。この急増は、ショッピングモール、オフィス、その他の商業スペースに対する需要の高まりによるものです。小売不動産セグメントは、同国で特に魅惑的なセクターとして浮上しています。例えば、商業用不動産市場の規模は、2028年までに1兆3,900億米ドルに達すると予想されています。インドネシアの商業用新設床面積は、予測期間中にCAGR 6.82%を記録し、安定した成長を維持すると予想されます。
住宅需要の増加が住宅セクターの成長を促進する可能性が高い
- 2022年、インドネシアの住宅新設床面積は2021年比で7.10%の伸びを示しました。この急増は、人口増加、富裕化、都市化に起因しています。政府主導の住宅支援は2022年に29兆インドルピーに達し、住宅融資流動性ファシリティ・スキームの下、2023年には32兆インドルピーに増加すると予測されました。このイニシアチブは、少なくとも22万戸の住宅建設を目指しています。住宅建設セクターは著しい成長を遂げる見込みです。2023年には前年比で約5,600万平方フィートに増加すると推定されます。
- 2020年、インドネシアの住宅新築床面積は2019年比で7.06%増加しました。これは政府による戦略的な動きで、景気後退を緩和し、収入減に悩む家計を支援するために建設を優先させました。その結果、検疫を含む建設活動の制限が大幅に緩和されました。しかし、2021年には動向が逆転し、住宅着工床面積は約12.54%減少しました。これは主に、建設部門への外国直接投資(FDI)の落ち込みに起因します。2021年の建設へのFDIは前年比51%減となりました。
- インドネシアの住宅新設床面積は、予測期間中、数量ベースでCAGR 6.08%の成長が見込まれます。この成長は、政府のイニシアティブと国内外の投資によって後押しされた、同国の都市化の進展に起因します。これらの要因は、直接的・間接的に、同国における住宅ニーズの高まりを強調し、最終的に住宅建設を促進します。急増する需要を満たすには、2030年までに年間82万戸から100万戸の住宅が必要になるとの予測もあります。
インドネシアのセメント産業の概要
インドネシアのセメント市場はかなり統合されており、上位5社で94.25%を占めています。この市場の主要企業は以下の通り。 Anhui Conch Cement Company Limited, Bosowa Semen, Heidelberg Materials, PT Cemindo Gemilang Tbk and SIG(sorted alphabetically).
その他の特典
- エクセル形式の市場予測(ME)シート
- 3ヶ月のアナリスト・サポート
目次
第1章 エグゼクティブサマリーと主な調査結果
第2章 レポートのオファー
第3章 イントロダクション
- 調査の前提条件と市場定義
- 調査範囲
- 調査手法
第4章 主要産業動向
- 最終用途セクターの動向
- 商業
- 産業・施設
- インフラ
- 住宅
- 主要インフラプロジェクト(現在および発表済み)
- 規制の枠組み
- バリューチェーンと流通チャネル分析
第5章 市場セグメンテーション(市場規模、2030年までの予測、成長見通し分析を含む)
- 最終用途セクター
- 商業
- 産業・施設
- インフラ
- 住宅
- 製品
- 混合セメント
- 繊維セメント
- 普通ポルトランドセメント
- 白色セメント
- その他のタイプ
第6章 競合情勢
- 主要な戦略的動き
- 市場シェア分析
- 企業情勢
- 企業プロファイル
- Anhui Conch Cement Company Limited
- Bosowa Semen
- Heidelberg Materials
- PT Cemindo Gemilang Tbk
- PT. HAOHAN CEMENT INDONESIA
- PT. Jui Shin Indonesia
- PT. SEMEN JAKARTA
- PT. Sinar Tambang Arthalestari
- SCG
- SIG
第7章 CEOへの主な戦略的質問
第8章 付録
- 世界概要
- 概要
- ファイブフォース分析フレームワーク(産業魅力度分析)
- 世界のバリューチェーン分析
- 市場力学(DROs)
- 情報源と参考文献
- 図表一覧
- 主要洞察
- データパック
- 用語集
目次
Product Code: 50002027
The Indonesia Cement Market size is estimated at 72.61 million Tons in 2024, and is expected to reach 109.24 million Tons by 2030, growing at a CAGR of 7.05% during the forecast period (2024-2030).
Indonesia's industrial construction sector, supported by government investments, is predicted to bolster cement production
- Cement, a crucial binding agent for construction, hardens to adhere to building materials like stones, bricks, and tiles. It finds extensive use in residential, commercial, infrastructure, and industrial projects. In 2022, Indonesia's cement market volume dipped by 14.19% compared to the previous year. Overcapacity and surging prices of raw materials, notably coal and crude oil, dampened cement demand in the country's construction sector. However, a positive shift was expected in 2023, with the market projected to grow by 21.63% in volume.
- In 2022, residential construction held a dominant position in Indonesia's cement market, accounting for a significant 30.6 million tons. In 2023, the market was poised for growth, with factors such as affordable housing initiatives, a burgeoning population with rising disposable incomes, and robust purchasing power set to drive demand for new residential units. The increase in new floor area for residential construction in 2023, compared to 2022, was projected to amount to 56 million sq. ft. Correspondingly, the Indonesian cement market for residential construction was anticipated to grow by 21.63% in volume.
- Indonesia's cement market for industrial construction is expected to witness the fastest CAGR of 9.61% in volume during the forecast period. The country is steadily transitioning into a manufacturing-focused economy and aims to position itself as an ASEAN hub for electric vehicles and petrochemicals by 2045. Initiatives like "Increase the Use of Domestic Products (P3DN)" further bolster this industrialization drive, leading to increased construction of manufacturing units and a subsequent rise in cement demand.
Indonesia Cement Market Trends
Indonesian commercial real estate market volume is projected to reach USD 1.39 trillion by 2028 and is likely to augment the demand for commercial sector
- In 2022, Indonesia witnessed a 9.7% decline in the volume of new commercial floor area compared to the previous year. This drop was a result of a return to normalcy following a decline in building activities during the COVID-19 pandemic. Even before the pandemic, commercial buildings in Indonesia were already showing a downward trend in annual energy intensity, accounting for a rate of 2.64% per year. However, in 2023, the country saw a rebound, registering a 5.7% increase in the volume of new commercial floor area, driven by a surge in foreign direct investment (FDI) necessitating new offices, warehouses, and retail spaces.
- Amidst the COVID-19 pandemic, in 2020 and 2021, Indonesia witnessed a significant surge in the volume of new commercial floor area, accounting for approximately 9.6 million square feet. The government's focus on revitalizing the economy led to measures such as easing construction-related quarantines, both in private and public projects. This allowed employees to resume work on-site and companies to continue their operations. Notably, the value of completed constructions in Indonesia stood at around IDR 1.32 quadrillion in 2020 and rose to IDR 1.42 quadrillion in 2021.
- The volume of new commercial floor area in Indonesia is projected to witness a robust growth of around 58.72% by 2030 compared to 2023. This surge is driven by a rising demand for shopping malls, offices, and other commercial spaces. The retail real estate segment is emerging as a particularly captivating sector in the country. For instance, the volume of the commercial real estate market is anticipated to reach USD 1.39 trillion by 2028. The commercial new floor area in Indonesia is expected to maintain steady growth, registering a CAGR of 6.82% during the forecast period.
Increase in demand for housing units is likely to augment the residential sector's growth
- In 2022, Indonesia witnessed a 7.10% volume growth in residential new floor area compared to 2021. This surge can be attributed to increased population, wealth, and urbanization. The government-led housing aid reached IDR 29 trillion in 2022, which was projected to increase to IDR 32 trillion in 2023 under the Housing Financing Liquidity Facility scheme. This initiative aims to construct at least 220 thousand houses. The residential construction sector is poised to witness a significant growth rate. It was estimated to increase to approximately 56 million square feet in 2023 compared to the preceding year.
- In 2020, the volume of residential new floor areas in Indonesia grew by 7.06% compared to 2019. This was a strategic move by the government, prioritizing construction to mitigate the economic downturn and support households grappling with reduced incomes. Consequently, restrictions on construction activities, including quarantines, were significantly eased. However, in 2021, the trend reversed, with a decline of about 12.54% in residential new floor area, primarily attributed to a dip in foreign direct investment (FDI) in the construction sector. FDI for construction plummeted by 51% in 2021 compared to the previous year.
- The residential new floor area in Indonesia is projected to witness a CAGR of 6.08% in volume during the forecast period. This growth stems from the country's increasing urbanization, bolstered by government initiatives and foreign and domestic investments. These factors, directly and indirectly, underscore the mounting housing needs in the nation, ultimately driving residential building construction. Projections indicate that to meet the escalating demand, the country would require between 820,000 and 1 million housing units annually by 2030.
Indonesia Cement Industry Overview
The Indonesia Cement Market is fairly consolidated, with the top five companies occupying 94.25%. The major players in this market are Anhui Conch Cement Company Limited, Bosowa Semen, Heidelberg Materials, PT Cemindo Gemilang Tbk and SIG (sorted alphabetically).
Additional Benefits:
- The market estimate (ME) sheet in Excel format
- 3 months of analyst support
TABLE OF CONTENTS
1 EXECUTIVE SUMMARY & KEY FINDINGS
2 REPORT OFFERS
3 INTRODUCTION
- 3.1 Study Assumptions & Market Definition
- 3.2 Scope of the Study
- 3.3 Research Methodology
4 KEY INDUSTRY TRENDS
- 4.1 End Use Sector Trends
- 4.1.1 Commercial
- 4.1.2 Industrial and Institutional
- 4.1.3 Infrastructure
- 4.1.4 Residential
- 4.2 Major Infrastructure Projects (current And Announced)
- 4.3 Regulatory Framework
- 4.4 Value Chain & Distribution Channel Analysis
5 MARKET SEGMENTATION (includes market size, forecasts up to 2030 and analysis of growth prospects.)
- 5.1 End Use Sector
- 5.1.1 Commercial
- 5.1.2 Industrial and Institutional
- 5.1.3 Infrastructure
- 5.1.4 Residential
- 5.2 Product
- 5.2.1 Blended Cement
- 5.2.2 Fiber Cement
- 5.2.3 Ordinary Portland Cement
- 5.2.4 White Cement
- 5.2.5 Other Types
6 COMPETITIVE LANDSCAPE
- 6.1 Key Strategic Moves
- 6.2 Market Share Analysis
- 6.3 Company Landscape
- 6.4 Company Profiles
- 6.4.1 Anhui Conch Cement Company Limited
- 6.4.2 Bosowa Semen
- 6.4.3 Heidelberg Materials
- 6.4.4 PT Cemindo Gemilang Tbk
- 6.4.5 PT. HAOHAN CEMENT INDONESIA
- 6.4.6 PT. Jui Shin Indonesia
- 6.4.7 PT. SEMEN JAKARTA
- 6.4.8 PT. Sinar Tambang Arthalestari
- 6.4.9 SCG
- 6.4.10 SIG
7 KEY STRATEGIC QUESTIONS FOR CONCRETE, MORTARS AND CONSTRUCTION CHEMICALS CEOS
8 APPENDIX
- 8.1 Global Overview
- 8.1.1 Overview
- 8.1.2 Porter's Five Forces Framework (Industry Attractiveness Analysis)
- 8.1.3 Global Value Chain Analysis
- 8.1.4 Market Dynamics (DROs)
- 8.2 Sources & References
- 8.3 List of Tables & Figures
- 8.4 Primary Insights
- 8.5 Data Pack
- 8.6 Glossary of Terms
