
アジア太平洋のセメント-市場シェア分析、産業動向、成長予測(2025年~2030年)
Asia-Pacific Cement - Market Share Analysis, Industry Trends & Statistics, Growth Forecasts (2025 - 2030)- 発行日
- ページ情報
- 英文 221 Pages
- 納期
- 2~3営業日
- 商品コード
- 1684057
- カスタマイズ可能 お客様のご希望に応じて、既存データの加工や未掲載情報(例:国別セグメント)の追加などの対応が可能です。詳細はお問い合わせください。
- 適宜更新あり 本レポートは最新情報反映のため適宜更新し、内容構成変更を行う場合があります。ご検討の際はお問い合わせください。
- 翻訳ツール提供対象 PDF対応AI翻訳ツールの無料貸し出しサービスのご利用が可能です
概要
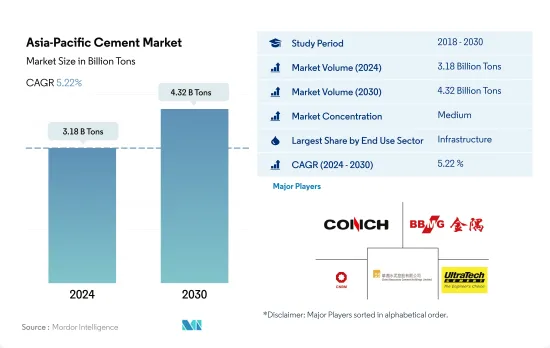
アジア太平洋のセメント市場規模は2024年に31億8,000万トンと推計され、2030年には43億2,000万トンに達し、予測期間中(2024年~2030年)のCAGRは5.22%で成長すると予測されます。
アジア太平洋のインフラ支出は1兆7,400億米ドルに達すると予想され、セメント需要を牽引する可能性が高いです。
- 2022年、この地域のセメント消費量は前年比6.37%減となりました。この減少は主に、商業、住宅、産業・施設セクターにおける新規床面積の減少によるものです。特に、産業・施設部門と住宅部門の2022年の新設床面積は、2021年と比較してそれぞれ5.63%と5.39%減少しました。2023年までに、アジア太平洋は世界のセメント市場の約72.53%を占めました。
- インフラ部門がこの地域最大のセメント消費者として浮上し、2022年には約39.48%を占める。インフラ事業への投資の増加に伴い、このセクターのセメント需要は増加すると予想されます。例えば、インドは2030年までに4兆5,000億米ドルのインフラ投資を目標としています。予測によると、この地域のインフラ投資は2030年までに1兆7,400億米ドルに達し、セメントセクターは2023年から2030年にかけて16.03%の成長を遂げます。
- 商業セクターは、予測期間中のCAGRが6.48%と予測され、この地域で最も急成長するセメント消費者となります。同地域では、ショッピングモールやオフィスなどの商業スペースの需要が大幅に増加する見通しです。2025年には、前年比1億7,800万平方フィートの商業床面積が新たに追加され、この地域は顕著に急増すると予測されています。例えば、インドネシアでは2025年までに6つのショッピングモールプロジェクトが完成予定で、総面積は29万2,000平方メートルに達します。こうした動向から、同地域の商業用セメント市場は、2022年の約3億3,600万トンから、2030年には5億2,300万トンに達するとみられます。
ベトナムが最も急成長している国である一方、中国は予測期間中もアジア太平洋におけるトップの座を維持すると予想されます。
- 2022年、アジア太平洋のセメント需要は前年比6.4%減となったが、これは主に同地域の覇者である中国の需要が11.3%減少したことによる。同地域のいくつかの国では2023年の需要が若干落ち込むと予想され、全体の伸びは2022年比で-0.4%とマイナスになると予測されました。
- 常に高い建設生産高を誇る中国は、アジア太平洋最大のセメント消費国です。特に、2022年には、インフラ部門だけでアジア太平洋のセメント総需要の79%を占める。しかし、中国のセメント需要は、不動産業界の課題と新規インフラプロジェクトの減少により、予測期間中(2023年~2030年)に減少すると予想されます。
- 中国に次いで、インドがアジア太平洋で2番目に大きなセメント消費国として浮上しています。インドの住宅セクターはセメント需要の主要なシェアを占めており、2022年にはセクター全体の需要の61%を占める。他の地域と異なり、インドでは建築物を主にコンクリートに頼っているため、セメント需要が増加しています。
- この地域の国々の中では、ベトナムがセメント需要の最も高い伸びを示すと予測されており、予測期間中に数量ベースで7.46%のCAGRで推移すると予想されています。この需要の急増は、不動産開発を後押しする新しい土地政策や、2030年までに100万戸の手頃な価格の住宅を建設するという政府の野心的な計画に起因していると思われます。
アジア太平洋のセメント市場の動向
インドなどで小売店やオフィススペースが増加し、アジア太平洋の商業建設セクターを後押し
- 2022年、アジア太平洋の商業施設の新設床面積は前年比3.23%減少しました。この後退は、規制の圧力、インフレ率の上昇、住宅ローン金利の急上昇といった要因によるものです。2023年には、この地域は回復し、商業施設の新設床面積は約1億4,600万平方フィート増加しました。この急増は主に外国直接投資(FDI)の増加によるもので、新しいオフィス、倉庫、小売店、その他の施設の需要に拍車をかけた。特に、ベトナムの建設部門は2023年に7,144万米ドルのFDI資本を誘致しました。
- 2020年、アジア太平洋は商業施設の新設床面積で大幅な後退を経験し、2019年比で21.92%の数量減となりました。この減少の主な原因は、政府による封鎖が広まり、プロジェクト作業が中断され、サプライチェーン、設備、労働力に深刻な影響を与えたことです。しかし、規制が緩和されるにつれ、同地域は目覚ましい回復を見せ、2021年の商業施設の新設床面積は20.98%急増し、約5億2,600万平方フィートの床面積に達しました。
- アジア太平洋の商業用新設床面積は大幅な成長が見込まれ、2023年と比較して2030年には14億1,000万平方フィート増加すると推定されます。この急増は、ショッピングモール、オフィススペース、小売店などに対する需要の高まりに後押しされています。アジア太平洋は世界の小売大国として台頭しており、世界の小売成長の4分の3近くに寄与しています。例えば、インドのグレードAオフィス市場は、上位7都市で2026年までに10億平方フィート、さらに2030年までに12億平方フィートまで拡大する可能性があります。全体として、アジア太平洋の商業施設の新設床面積は、予測期間中にCAGR5.16%を記録すると予測されています。
インドでは2030年までに2,500万戸に達する可能性があるなど、手頃な価格の住宅が増加し、同地域の住宅建設が拡大します。
- 2022年、アジア太平洋の住宅着工床面積は前年比約5.39%減少しました。この落ち込みは、COVID-19の大流行時に建築活動が急増した後、セクターが正常化した結果です。この地域の住宅セクターは、人口の増加、富裕層の増加、急速な都市化によって牽引されています。同地域の住宅新築床面積は、2023年には2022年比で4億1,000万平方フィート増加すると予想されました。
- 2020年、アジア太平洋の住宅新設床面積は2019年比で約5.06%減少しました。これは主に、政府による封鎖、サプライチェーンの混乱、労働力不足、建設生産性の低下、外国投資の低迷によるものでした。しかし、規制が緩和されるにつれて、この地域では大幅な回復が見られ、2021年には住宅新設戸数の増加により住宅新設床面積が約14億平方フィート急増しました。例えば、2021年だけでも、インドの住宅不動産市場は上位7都市で約16万3,000戸の新築住宅を導入します。
- アジア太平洋の住宅新築床面積は、予測期間中にCAGR 3.98%を記録すると予測されます。この成長は、住宅需要、投資の増加、有利な政府政策によるものです。より手頃な価格の住宅建設に注力することで、同地域の住宅建設セクターは活気を取り戻し、回復に向かうと予想されます。2030年までには、インド人口の40%以上が都市部に居住するようになると推定され、さらに2,500万戸の手頃な価格の住宅需要が見込まれます。この需要の急増により、インドの住宅用不動産市場は2030年までに150万戸に達すると予想されます。
アジア太平洋のセメント産業の概要
アジア太平洋のセメント市場は適度に統合されており、上位5社で50.04%を占めています。この市場の主要企業は以下の通り。 Anhui Conch Cement Company Limited, BBMG Corporation, China National Building Material Group Corporation, China Resource Cement Holdings and UltraTech Cement Ltd.(sorted alphabetically).
その他の特典
- エクセル形式の市場予測(ME)シート
- 3ヶ月のアナリストサポート
目次
第1章 エグゼクティブサマリーと主な調査結果
第2章 レポートのオファー
第3章 イントロダクション
- 調査の前提条件と市場定義
- 調査範囲
- 調査手法
第4章 主要産業動向
- 最終用途分野の動向
- 商業
- 産業・施設
- インフラ
- 住宅
- 主要インフラプロジェクト(現在および発表済み)
- 規制の枠組み
- バリューチェーンと流通チャネル分析
第5章 市場セグメンテーション
- 最終用途セクター
- 商業
- 産業・施設
- インフラ
- 住宅
- 製品
- 混合セメント
- 繊維セメント
- 普通ポルトランドセメント
- 白色セメント
- その他
- 国名
- オーストラリア
- 中国
- インド
- インドネシア
- 日本
- マレーシア
- 韓国
- タイ
- ベトナム
- その他のアジア太平洋
第6章 競合情勢
- 主要な戦略動向
- 市場シェア分析
- 企業情勢
- 企業プロファイル
- Adani Group
- Anhui Conch Cement Company Limited
- BBMG Corporation
- China National Building Material Group Corporation
- China Resource Cement Holdings
- SCG
- SIG
- TAIWAN CEMENT LTD.
- UltraTech Cement Ltd.
- Vietnam National Cement Corporation
第7章 CEOへの主な戦略的質問CEOへの主な戦略的質問
第8章 付録
- 世界概要
- 概要
- ファイブフォース分析フレームワーク(産業魅力度分析)
- 世界・バリューチェーン分析
- 市場力学(DROs)
- 情報源と参考文献
- 図表一覧
- 主要洞察
- データパック
- 用語集
目次
The Asia-Pacific Cement Market size is estimated at 3.18 billion Tons in 2024, and is expected to reach 4.32 billion Tons by 2030, growing at a CAGR of 5.22% during the forecast period (2024-2030).
Infrastructure spending in Asia-Pacific is expected to reach USD 1.74 trillion and is likely to drive the demand for cement
- In 2022, the cement consumption volume in the region saw a 6.37% decline from the previous year. This drop was primarily driven by reduced new floor area constructions in the commercial, residential, and industrial & institutional sectors. Notably, the industrial & institutional, and residential sectors saw a 5.63% and 5.39% decrease in new floor area, respectively, in 2022, compared to 2021. By 2023, Asia-Pacific accounted for approximately 72.53% of the global cement market.
- The infrastructure sector emerged as the region's largest cement consumer, representing about 39.48% in 2022. With increased investments in infrastructure projects, this sector's cement demand is expected to rise. For instance, India has set its sights on a USD 4.5 trillion infrastructure investment by 2030. Projections indicate that infrastructure spending in the region will hit USD 1.74 trillion by 2030, propelling the cement sector to a 16.03% growth from 2023 to 2030.
- The commercial sector is poised to be the region's fastest-growing cement consumer, with a projected CAGR of 6.48% during the forecast period. The region is poised to experience a significant uptick in demand for commercial spaces, including shopping malls and offices. In 2025, the region is projected to witness a notable surge, adding 178 million sq. ft of new commercial floor area, compared to the previous year. For example, Indonesia has six shopping mall projects slated for completion by 2025, adding up to a total of 292 thousand sq. meters. These trends indicate that the cement market for the commercial sector in the region is set to reach 523 million tons in 2030, up from around 336 million tons in 2022.
Vietnam is the fastest-growing country, while China is expected to maintain its leading position in Asia-Pacific during the forecast period
- In 2022, the demand for cement in Asia-Pacific dropped by 6.4% compared to the previous year, primarily driven by an 11.3% decline in demand from China, which is the region's dominant player. Several countries in the region were expected to see a slight dip in demand in 2023, and the overall growth was projected to be negative, at -0.4%, compared to 2022.
- China, with its consistently high construction output, stands as the largest cement consumer in Asia-Pacific. Notably, in 2022, its infrastructure sector alone accounted for 79% of the region's total cement demand in that sector. However, China's cement demand is anticipated to decline during the forecast period (2023-2030) due to challenges in the real estate industry and a decrease in new infrastructure projects.
- Following China, India emerges as the second-largest consumer of cement in Asia-Pacific. The residential sector in India holds the major share of cement demand, representing 61% of the total demand across sectors in 2022. Unlike some of its regional counterparts, India predominantly relies on concrete for its buildings, driving up the demand for cement.
- Among the countries in the region, Vietnam is projected to witness the highest growth in the demand for cement, and it is expected to register a CAGR of 7.46% by volume during the forecast period. This surge in demand is likely to be attributed to new land policies that bolster real estate development and the government's ambitious plan to construct 1 million affordable housing units by 2030.
Asia-Pacific Cement Market Trends
Rising retail and office spaces in countries such as India to boost the Asia-Pacific commercial construction sector
- In 2022, Asia-Pacific witnessed a 3.23% decline in its commercial new floor area compared to the previous year. This setback was attributed to factors such as regulatory pressures, higher inflation, and a surge in mortgage rates. In 2023, the region rebounded, with commercial construction new floor area increasing by approximately 146 million sq. ft. This surge was primarily driven by a rise in foreign direct investment (FDI), which spurred the demand for new offices, warehouses, retail outlets, and other facilities. Notably, the Vietnamese construction sector attracted an FDI capital of USD 71.44 million in 2023.
- In 2020, the Asia-Pacific region experienced a significant setback in commercial new floor area, with a volume decline of 21.92% compared to 2019. This decline was primarily due to widespread government lockdowns, which disrupted project work and severely impacted supply chains, equipment, and labor. However, as restrictions eased, the region witnessed a remarkable rebound, with its commercial new floor area surging by 20.98% in 2021, reaching a volume of approximately 526 million sq. ft.
- Asia-Pacific's commercial new floor area is projected to witness substantial growth, with an estimated increase of 1.41 billion sq. ft by 2030 compared to 2023. This surge is fueled by a rising demand for shopping malls, office spaces, retail outlets, and more. The Asia-Pacific region is emerging as a global retail powerhouse, contributing to nearly three-quarters of the worldwide retail growth. For instance, the Indian Grade A office market in its top seven cities may to expand to 1 billion sq. ft by 2026 and further to 1.2 billion sq. ft. by 2030. Overall, the commercial new floor area in Asia-Pacific is projected to witness a volume CAGR of 5.16% during the forecast period.
Rising affordable housing units, such as India's likely to reach 25 million by 2030, to augment the residential constructions in the region
- In 2022, the residential new floor area in the Asia-Pacific region saw a volume decline of approximately 5.39% from the previous year. This dip was a result of the sector normalizing after a surge in building activity during the COVID-19 pandemic. The region's residential sector is driven by a growing population, increasing wealth, and rapid urbanization. The residential new floor area in the region was expected to rise by 410 million sq. ft in 2023 compared to 2022.
- In 2020, the residential new floor area in Asia-Pacific declined in volume by around 5.06% compared to 2019. This was primarily due to government-imposed lockdowns, disruptions in the supply chain, labor shortages, reduced construction productivity, and low foreign investments. However, as restrictions eased, the region saw a significant rebound, with the residential new floor area surging by about 1.4 billion sq. ft in 2021, driven by the addition of new residential housing units. For instance, in 2021 alone, the Indian residential real estate market introduced approximately 163 thousand new residential units across its top seven cities.
- The residential new floor area in the Asia-Pacific region is projected to witness a CAGR of 3.98% during the forecast period. This growth can be attributed to the demand for housing, increased investments, and favorable government policies. The focus on constructing more affordable housing units is expected to rejuvenate the residential construction sector in the region, aiding its recovery. By 2030, it is estimated that over 40% of India's population will reside in urban areas, leading to a demand for an additional 25 million affordable housing units. This surge in demand is expected to push the Indian residential real estate market to reach 1.5 million units by 2030.
Asia-Pacific Cement Industry Overview
The Asia-Pacific Cement Market is moderately consolidated, with the top five companies occupying 50.04%. The major players in this market are Anhui Conch Cement Company Limited, BBMG Corporation, China National Building Material Group Corporation, China Resource Cement Holdings and UltraTech Cement Ltd. (sorted alphabetically).
Additional Benefits:
- The market estimate (ME) sheet in Excel format
- 3 months of analyst support
TABLE OF CONTENTS
1 EXECUTIVE SUMMARY & KEY FINDINGS
2 REPORT OFFERS
3 INTRODUCTION
- 3.1 Study Assumptions & Market Definition
- 3.2 Scope of the Study
- 3.3 Research Methodology
4 KEY INDUSTRY TRENDS
- 4.1 End Use Sector Trends
- 4.1.1 Commercial
- 4.1.2 Industrial and Institutional
- 4.1.3 Infrastructure
- 4.1.4 Residential
- 4.2 Major Infrastructure Projects (current And Announced)
- 4.3 Regulatory Framework
- 4.4 Value Chain & Distribution Channel Analysis
5 MARKET SEGMENTATION (includes market size, forecasts up to 2030 and analysis of growth prospects.)
- 5.1 End Use Sector
- 5.1.1 Commercial
- 5.1.2 Industrial and Institutional
- 5.1.3 Infrastructure
- 5.1.4 Residential
- 5.2 Product
- 5.2.1 Blended Cement
- 5.2.2 Fiber Cement
- 5.2.3 Ordinary Portland Cement
- 5.2.4 White Cement
- 5.2.5 Other Types
- 5.3 Country
- 5.3.1 Australia
- 5.3.2 China
- 5.3.3 India
- 5.3.4 Indonesia
- 5.3.5 Japan
- 5.3.6 Malaysia
- 5.3.7 South Korea
- 5.3.8 Thailand
- 5.3.9 Vietnam
- 5.3.10 Rest of Asia-Pacific
6 COMPETITIVE LANDSCAPE
- 6.1 Key Strategic Moves
- 6.2 Market Share Analysis
- 6.3 Company Landscape
- 6.4 Company Profiles
- 6.4.1 Adani Group
- 6.4.2 Anhui Conch Cement Company Limited
- 6.4.3 BBMG Corporation
- 6.4.4 China National Building Material Group Corporation
- 6.4.5 China Resource Cement Holdings
- 6.4.6 SCG
- 6.4.7 SIG
- 6.4.8 TAIWAN CEMENT LTD.
- 6.4.9 UltraTech Cement Ltd.
- 6.4.10 Vietnam National Cement Corporation
7 KEY STRATEGIC QUESTIONS FOR CONCRETE, MORTARS AND CONSTRUCTION CHEMICALS CEOS
8 APPENDIX
- 8.1 Global Overview
- 8.1.1 Overview
- 8.1.2 Porter's Five Forces Framework (Industry Attractiveness Analysis)
- 8.1.3 Global Value Chain Analysis
- 8.1.4 Market Dynamics (DROs)
- 8.2 Sources & References
- 8.3 List of Tables & Figures
- 8.4 Primary Insights
- 8.5 Data Pack
- 8.6 Glossary of Terms
- 発行日
- 発行
- Mordor Intelligence
- ページ情報
- 英文 221 Pages
- 納期
- 2~3営業日