
普通ポルトランドセメント:市場シェア分析、産業動向、成長予測(2025年~2030年)
Ordinary Portland Cement - Market Share Analysis, Industry Trends & Statistics, Growth Forecasts (2025 - 2030)- 発行日
- ページ情報
- 英文 295 Pages
- 納期
- 2~3営業日
- 商品コード
- 1684033
- カスタマイズ可能 お客様のご希望に応じて、既存データの加工や未掲載情報(例:国別セグメント)の追加などの対応が可能です。詳細はお問い合わせください。
- 適宜更新あり 本レポートは最新情報反映のため適宜更新し、内容構成変更を行う場合があります。ご検討の際はお問い合わせください。
- 翻訳ツール提供対象 PDF対応AI翻訳ツールの無料貸し出しサービスのご利用が可能です
概要
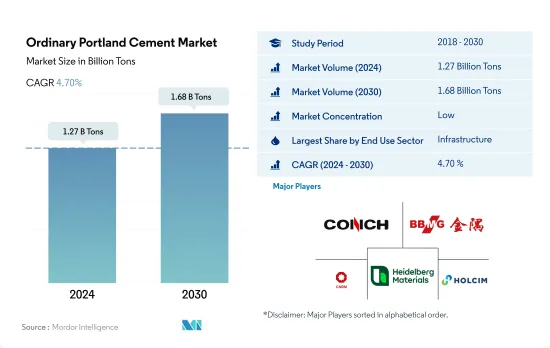
普通ポルトランドセメントの市場規模は2024年に12億7,000万トンと推定され、2030年には16億8,000万トンに達し、予測期間中(2024年~2030年)のCAGRは4.70%で成長すると予測されます。
インフラ支出の増加が普通ポルトランドセメントの需要を牽引する可能性が高いです。
- 2022年の世界セメント市場では、普通ポルトランドセメント(OPC)が29.18%の大きな市場シェアを獲得しています。2023年のOPC消費量は、住宅とインフラ建設セクターの需要増に牽引され、0.81%成長すると予測されました。
- 2022年には、インフラがOPCの主要消費者に浮上し、市場のほぼ半分(47.91%)を占めました。2023年の世界インフラ支出は、投資増に後押しされて2兆7,800億米ドルに達する見込みです。特に米国は、インフラ投資・雇用促進法(Infrastructure Investment and Jobs Act)による5,500億米ドルを含め、2025年までに1兆2,000億米ドルの割り当てを計画しています。これらの資金は、道路、橋、鉄道、スマートインフラ、ブロードバンド、電気自動車など、多様なプロジェクトに投入されます。その結果、インフラ部門向けのOPC需要は、2023年の5億7,676万トンから2030年には7億7,892万トンに急増すると予測されます。
- OPCの消費者として最も急成長するのは商業分野で、予測期間中のCAGRは6.30%と堅調に推移します。ショッピングモール、オフィス、その他の商業施設に対する需要の高まりにより、2024年には世界の商業スペースの新設床面積は3億100万平方フィート増加すると予測されています。例えば、インドネシアでは2025年までに6つのショッピングモールプロジェクトが完成予定で、合計面積は29万2,000平方メートルに達します。その結果、世界のOPC需要は2030年までに、2023年の水準から5,652万トン増加すると予想されます。
予測期間中、普通ポルトランドセメントの消費量は中東・アフリカがリードすると予想される
- 2022年の普通ポルトランドセメントの世界消費量は、前年比3.14%減少しました。この減少は、アジア太平洋地域の消費量が5.72%減少したことが主因です。建設業界は逆風に直面し、インフレの高騰、原材料価格の高騰、差し迫った景気後退に悩まされました。こうした要因に加え、投資の後退やプロジェクトの遅れが普通ポルトランドセメントの需要を押し下げました。しかし、2023年には緩やかな回復が見込まれ、消費量は0.81%増加すると予測されています。この増加の主な要因は、欧州からの需要が5.69%急増すると予測されることです。
- 2022年には、アジア太平洋が普通ポルトランドセメントの圧倒的な消費国となり、世界需要の70.71%を占める。特筆すべきは、中国、日本、インドといった国々がこの需要の形成に極めて重要な役割を果たしたことです。中国の輸送インフラへの投資は、2021年の1,576億米ドルから2022年には1,656億米ドルに増加しました。日本は製造施設建設の急増を示し、インドは道路、鉄道、高速道路プロジェクトを通じて接続性の強化に注力しました。
- 中東・アフリカは、普通ポルトランドセメント消費量が最も急速に伸び、予測期間中のCAGRは6.98%と予測されます。アラブ首長国連邦が突出しており、2021年から2022年にかけてインフラ投資が82%急増しました。2022年には、サウジアラビアとUAEがそれぞれ世界消費の11%と3%を占める。特に、サウジアラビアの野心的なビジョン2030と、投資ファンドに対する約26億6,000万米ドル相当の協定は、商業、観光、住宅プロジェクトの開発に対するサウジアラビアのコミットメントを強調しています。
世界の普通ポルトランドセメント市場の動向
アジア太平洋における大規模オフィスビル建設プロジェクトの急増により、世界の商業建築専用床面積が増加する見込みです。
- 2022年、世界の商業建築用床面積は前年比0.15%の小幅な伸びにとどまりました。欧州は12.70%の大幅な伸びで際立っており、これは2030年の二酸化炭素排出目標に合わせてエネルギー効率の高いオフィスビルを推進する動きが原動力となっています。従業員のオフィス復帰に伴い、欧州企業はリース契約を再開し、2022年には450万平方フィートの新規オフィス建設に拍車をかけた。この勢いは2023年も続き、世界の成長率は4.26%と予測されています。
- COVID-19の流行は労働力と資材の不足を引き起こし、商業施設の建設プロジェクトのキャンセルと遅延を招いた。しかし、閉鎖が緩和され、建設活動が再開されるにつれて、2021年の世界の商業施設の新設床面積は11.11%急増し、アジア太平洋が20.98%の成長率でリードしました。
- 今後、世界の商業施設の新設床面積のCAGRは4.56%となります。アジア太平洋地域のCAGRは5.16%と予測され、他地域を凌駕すると予想されます。この成長の原動力となっているのは、中国、インド、韓国、日本における商業施設建設プロジェクトの活発化です。特に、北京、上海、香港、台北といった中国の主要都市では、Aグレードのオフィススペース建設が加速しています。さらに、インドでは2023年から2025年にかけて、上位7都市で約2,325万平方フィートに及ぶ約60のショッピングモールがオープンする予定です。アジア太平洋全域のこうした取り組みを合計すると、2030年までに商業施設の新規床面積は2022年比で15億6,000万平方フィート増加すると予想されます。
世界の住宅セクターを後押しする手頃な価格の住宅計画への政府投資の増加により、南米の住宅建設が最も急成長すると推定されます。
- 2022年、世界の住宅建築の新規床面積は2021年比で約2億8,900万平方フィート減少しました。これは、土地不足、労働力不足、建設資材価格の持続不可能な高騰が原因で発生した住宅危機に起因します。この危機はアジア太平洋に深刻な影響を与え、2022年の新設床面積は2021年比で5.39%減少しました。しかし2023年には、2030年までに30億人を収容できる手頃な価格の住宅を新たに建設するための資金を調達できる政府投資により、世界の新設床面積は2022年比で3.31%増加すると予測され、より明るい見通しが期待されます。
- COVID-19の流行は景気減速を引き起こし、そのため多くの住宅建設プロジェクトが中止または延期され、2020年の世界の新設床面積は2019年に比べて4.79%減少しました。2021年に規制が解除され、住宅プロジェクトに対する鬱積した需要が解放されると、新設床面積は2020年比で11.22%増加し、欧州が18.28%と最も高い伸びを示し、次いで南米が2021年に2020年比で17.36%増加しました。
- 世界の住宅用新設床面積は予測期間中にCAGR 3.81%を記録し、南米が最も速いCAGR 4.05%で発展すると予測されます。ブラジルのMinha Casa Minha Vidaは2023年に発表され、政府が19億8,000万米ドルを投資して低所得世帯に手頃な住宅を提供する計画であり、チリのFOGAESも2023年に発表され、初期投資額は5,000万米ドルです。
普通ポルトランドセメント産業の概要
普通ポルトランドセメント市場は細分化されており、上位5社で34.16%を占めています。この市場の主要企業は以下の通り。 Anhui Conch Cement Company Limited, BBMG Corporation, China National Building Material Group Corporation, Heidelberg Materials and Holcim.
その他の特典
- エクセル形式の市場予測(ME)シート
- 3ヶ月のアナリストサポート
目次
第1章 エグゼクティブサマリーと主な調査結果
第2章 レポートのオファー
第3章 イントロダクション
- 調査の前提条件と市場定義
- 調査範囲
- 調査手法
第4章 主要産業動向
- 最終用途分野の動向
- 商業
- 産業・施設
- インフラ
- 住宅
- 主要インフラプロジェクト(現在および発表済み)
- 規制の枠組み
- バリューチェーンと流通チャネル分析
第5章 市場セグメンテーション
- 最終用途セクター
- 商業
- 産業・施設
- インフラ
- 住宅
- 地域
- アジア太平洋
- 国別
- オーストラリア
- 中国
- インド
- インドネシア
- 日本
- マレーシア
- 韓国
- タイ
- ベトナム
- その他のアジア太平洋
- 欧州
- 国別
- フランス
- ドイツ
- イタリア
- ロシア
- スペイン
- 英国
- その他の欧州
- 中東・アフリカ
- 国別
- サウジアラビア
- アラブ首長国連邦
- その他の中東・アフリカ
- 北米
- 国別
- カナダ
- メキシコ
- 米国
- 南米
- 国別
- アルゼンチン
- ブラジル
- その他の南米
- アジア太平洋
第6章 競合情勢
- 主要な戦略動向
- 市場シェア分析
- 企業情勢
- 企業プロファイル
- Anhui Conch Cement Company Limited
- BBMG Corporation
- CEMEX, S.A.B. de C.V.
- China National Building Material Group Corporation
- Dangote Cement Plc.
- Heidelberg Materials
- Holcim
- SIG
- UltraTech Cement Ltd.
- Votorantim Cimentos
第7章 CEOへの主な戦略的質問CEOへの主な戦略的質問
第8章 付録
- 世界概要
- 概要
- ファイブフォース分析フレームワーク(産業魅力度分析)
- 世界・バリューチェーン分析
- 市場力学(DROs)
- 情報源と参考文献
- 図表一覧
- 主要洞察
- データパック
- 用語集
目次
The Ordinary Portland Cement Market size is estimated at 1.27 billion Tons in 2024, and is expected to reach 1.68 billion Tons by 2030, growing at a CAGR of 4.70% during the forecast period (2024-2030).
Rising infrastructure spending is likely to drive the demand for ordinary Portland cement
- In 2022, the global cement market saw ordinary Portland cement (OPC) dominate, capturing a significant 29.18% market share. The consumption of OPC was projected to grow by 0.81% in 2023, driven by rising demand from the residential and infrastructure construction sectors.
- Infrastructure emerged as the leading consumer of OPC in 2022, accounting for nearly half (47.91%) of the market. Global infrastructure spending was set to hit USD 2.78 trillion in 2023, buoyed by increased investments. Notably, the United States plans to allocate USD 1.2 trillion by 2025, including USD 550 billion from the Infrastructure Investment and Jobs Act. These funds will be channeled into diverse projects like roads, bridges, rail, smart infrastructure, broadband, and electric vehicles. Consequently, OPC demand for the infrastructure sector is projected to surge from 576.76 million tons in 2023 to 778.92 million tons in 2030.
- The commercial segment is poised to be the fastest-growing consumer of OPC, with a robust CAGR of 6.30% during the forecast period. The global new floor area for commercial spaces is projected to rise by 301 million sq. ft in 2024, driven by heightened demand for shopping malls, offices, and other commercial establishments. For instance, Indonesia has six shopping mall projects slated for completion by 2025, adding up to a combined area of 292 thousand sq. meters. Consequently, the global OPC demand for the commercial sector is anticipated to climb by 56.52 million tons by 2030, compared to the levels seen in 2023.
The Middle East & Africa is expected to lead in terms of consumption volume of ordinary Portland cement during the forecast period
- In 2022, the global consumption of ordinary Portland cement dipped by 3.14% compared to the previous year. This decline was largely driven by a 5.72% drop in consumption from Asia-Pacific. The construction industry faced headwinds, grappling with surging inflation, soaring raw material prices, and an impending recession. These factors, coupled with a pullback in investments and project delays, weighed on the demand for ordinary Portland cement. However, in 2023, they anticipated a modest rebound, with consumption projected to inch up by 0.81%. This uptick is primarily driven by a projected 5.69% surge in demand from Europe.
- Asia-Pacific emerged as the dominant consumer of ordinary Portland cement in 2022, accounting for a significant 70.71% of the global demand. Notably, countries like China, Japan, and India played pivotal roles in shaping this demand. China's investment in transport infrastructure rose from USD 157.6 billion in 2021 to USD 165.6 billion in 2022. Japan witnessed a surge in manufacturing facility constructions, while India focused on bolstering its connectivity through road, rail, and highway projects.
- The Middle East & Africa is poised to witness the swiftest growth in ordinary Portland cement consumption, with a projected CAGR of 6.98% during the forecast period. The United Arab Emirates stood out, with an 82% surge in infrastructure investments from 2021 to 2022. In 2022, Saudi Arabia and the UAE accounted for 11% and 3% of global consumption, respectively. Notably, Saudi Arabia's ambitious Vision 2030 and its agreements, including those worth nearly USD 2.66 billion for investment funds, underscore its commitment to developing commercial, tourism, and residential projects.
Global Ordinary Portland Cement Market Trends
Asia-Pacific's surge in large-scale office building projects is set to elevate the global floor area dedicated to commercial construction
- In 2022, the global new floor area for commercial construction witnessed a modest growth of 0.15% from the previous year. Europe stood out with a significant surge of 12.70%, driven by a push for high-energy-efficient office buildings to align with its 2030 carbon emission targets. As employees returned to offices, European companies, resuming lease decisions, spurred the construction of 4.5 million square feet of new office space in 2022. This momentum is poised to persist in 2023, with a projected global growth rate of 4.26%.
- The COVID-19 pandemic caused labor and material shortages, leading to cancellations and delays in commercial construction projects. However, as lockdowns eased and construction activities resumed, the global new floor area for commercial construction surged by 11.11% in 2021, with Asia-Pacific taking the lead with a growth rate of 20.98%.
- Looking ahead, the global new floor area for commercial construction is set to achieve a CAGR of 4.56%. Asia-Pacific is anticipated to outpace other regions, with a projected CAGR of 5.16%. This growth is fueled by a flurry of commercial construction projects in China, India, South Korea, and Japan. Notably, major Chinese cities like Beijing, Shanghai, Hong Kong, and Taipei are gearing up for an uptick in Grade A office space construction. Additionally, India is set to witness the opening of approximately 60 shopping malls, spanning 23.25 million square feet, in its top seven cities between 2023 and 2025. Collectively, these endeavors across Asia-Pacific are expected to add a staggering 1.56 billion square feet to the new floor area for commercial construction by 2030, compared to 2022.
South America's estimated fastest growth in residential constructions due to increasing government investments in schemes for affordable housing to boost the global residential sector
- In 2022, the global new floor area for residential construction declined by around 289 million square feet compared to 2021. This can be attributed to the housing crisis generated due to the shortage of land, labor, and unsustainably high construction materials prices. This crisis severely impacted Asia-Pacific, where the new floor area declined 5.39% in 2022 compared to 2021. However, a more positive outlook is expected in 2023 as the global new floor area is predicted to grow by 3.31% compared to 2022, owing to government investments that can finance the construction of new affordable homes capable of accommodating 3 billion people by 2030.
- The COVID-19 pandemic caused an economic slowdown, due to which many residential construction projects got canceled or delayed, and the global new floor area declined by 4.79% in 2020 compared to 2019. As the restrictions were lifted in 2021 and pent-up demand for housing projects was released, new floor area grew 11.22% compared to 2020, with Europe having the highest growth of 18.28%, followed by South America, which rose 17.36% in 2021 compared to 2020.
- The global new floor area for residential construction is expected to register a CAGR of 3.81% during the forecast period, with South America predicted to develop at the fastest CAGR of 4.05%. Schemes and initiatives like the Minha Casa Minha Vida in Brazil announced in 2023 with a few regulatory changes, for which the government plans an investment of USD 1.98 billion to provide affordable housing units for low-income families, and the FOGAES in Chile also publicized in 2023, with an initial investment of USD 50 million, are aimed at providing mortgage loans to families for affordable housing and will encourage the construction of new residential units.
Ordinary Portland Cement Industry Overview
The Ordinary Portland Cement Market is fragmented, with the top five companies occupying 34.16%. The major players in this market are Anhui Conch Cement Company Limited, BBMG Corporation, China National Building Material Group Corporation, Heidelberg Materials and Holcim (sorted alphabetically).
Additional Benefits:
- The market estimate (ME) sheet in Excel format
- 3 months of analyst support
TABLE OF CONTENTS
1 EXECUTIVE SUMMARY & KEY FINDINGS
2 REPORT OFFERS
3 INTRODUCTION
- 3.1 Study Assumptions & Market Definition
- 3.2 Scope of the Study
- 3.3 Research Methodology
4 KEY INDUSTRY TRENDS
- 4.1 End Use Sector Trends
- 4.1.1 Commercial
- 4.1.2 Industrial and Institutional
- 4.1.3 Infrastructure
- 4.1.4 Residential
- 4.2 Major Infrastructure Projects (current And Announced)
- 4.3 Regulatory Framework
- 4.4 Value Chain & Distribution Channel Analysis
5 MARKET SEGMENTATION (includes market size, forecasts up to 2030 and analysis of growth prospects.)
- 5.1 End Use Sector
- 5.1.1 Commercial
- 5.1.2 Industrial and Institutional
- 5.1.3 Infrastructure
- 5.1.4 Residential
- 5.2 Region
- 5.2.1 Asia-Pacific
- 5.2.1.1 By Country
- 5.2.1.1.1 Australia
- 5.2.1.1.2 China
- 5.2.1.1.3 India
- 5.2.1.1.4 Indonesia
- 5.2.1.1.5 Japan
- 5.2.1.1.6 Malaysia
- 5.2.1.1.7 South Korea
- 5.2.1.1.8 Thailand
- 5.2.1.1.9 Vietnam
- 5.2.1.1.10 Rest of Asia-Pacific
- 5.2.2 Europe
- 5.2.2.1 By Country
- 5.2.2.1.1 France
- 5.2.2.1.2 Germany
- 5.2.2.1.3 Italy
- 5.2.2.1.4 Russia
- 5.2.2.1.5 Spain
- 5.2.2.1.6 United Kingdom
- 5.2.2.1.7 Rest of Europe
- 5.2.3 Middle East and Africa
- 5.2.3.1 By Country
- 5.2.3.1.1 Saudi Arabia
- 5.2.3.1.2 United Arab Emirates
- 5.2.3.1.3 Rest of Middle East and Africa
- 5.2.4 North America
- 5.2.4.1 By Country
- 5.2.4.1.1 Canada
- 5.2.4.1.2 Mexico
- 5.2.4.1.3 United States
- 5.2.5 South America
- 5.2.5.1 By Country
- 5.2.5.1.1 Argentina
- 5.2.5.1.2 Brazil
- 5.2.5.1.3 Rest of South America
- 5.2.1 Asia-Pacific
6 COMPETITIVE LANDSCAPE
- 6.1 Key Strategic Moves
- 6.2 Market Share Analysis
- 6.3 Company Landscape
- 6.4 Company Profiles
- 6.4.1 Anhui Conch Cement Company Limited
- 6.4.2 BBMG Corporation
- 6.4.3 CEMEX, S.A.B. de C.V.
- 6.4.4 China National Building Material Group Corporation
- 6.4.5 Dangote Cement Plc.
- 6.4.6 Heidelberg Materials
- 6.4.7 Holcim
- 6.4.8 SIG
- 6.4.9 UltraTech Cement Ltd.
- 6.4.10 Votorantim Cimentos
7 KEY STRATEGIC QUESTIONS FOR CONCRETE, MORTARS AND CONSTRUCTION CHEMICALS CEOS
8 APPENDIX
- 8.1 Global Overview
- 8.1.1 Overview
- 8.1.2 Porter's Five Forces Framework (Industry Attractiveness Analysis)
- 8.1.3 Global Value Chain Analysis
- 8.1.4 Market Dynamics (DROs)
- 8.2 Sources & References
- 8.3 List of Tables & Figures
- 8.4 Primary Insights
- 8.5 Data Pack
- 8.6 Glossary of Terms
- 発行日
- 発行
- Mordor Intelligence
- ページ情報
- 英文 295 Pages
- 納期
- 2~3営業日