
北米のチューインガム:市場シェア分析、産業動向、成長予測(2025年~2030年)
North America Chewing Gum - Market Share Analysis, Industry Trends & Statistics, Growth Forecasts (2025 - 2030)- 発行日
- ページ情報
- 英文 166 Pages
- 納期
- 2~3営業日
- 商品コード
- 1684023
- カスタマイズ可能 お客様のご希望に応じて、既存データの加工や未掲載情報(例:国別セグメント)の追加などの対応が可能です。詳細はお問い合わせください。
- 適宜更新あり 本レポートは最新情報反映のため適宜更新し、内容構成変更を行う場合があります。ご検討の際はお問い合わせください。
- 翻訳ツール提供対象 PDF対応AI翻訳ツールの無料貸し出しサービスのご利用が可能です
概要
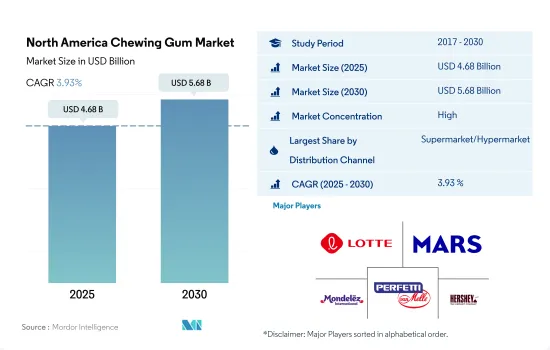
北米のチューインガム市場規模は2025年に46億8,000万米ドルと推定・予測され、2030年には56億8,000万米ドルに達し、予測期間(2025年~2030年)のCAGRは3.93%で成長すると予測されます。
主要小売チェーンの高い普及率により、スーパーマーケットとハイパーマーケットが最も好まれるチャネルとなり、2023年の市場シェアは40%を超えます。
- 流通チャネルを通じたチューインガムの販売額は、2022年と比較して2023年には8.56%の成長率を記録し、検討期間(2021年~2023年)のCAGRは4.90%でした。この成長は、スーパーマーケットやその他の伝統的な店舗形態の普及率が高く、百貨店やコンビニエンスストアなどの量販店がそれに続くためです。スーパーマーケットとハイパーマーケットにおけるチューインガムの販売量は、2021年から2023年にかけて11%増加しました。eコマースと自動販売機の人気の高まりも市場の成長を後押ししています。
- オンライン小売店分野は、予測期間中にCAGR 7.57%を記録し、2029年には2028年比で3.78%の成長率を記録し、最も急成長する流通チャネルになると予想されます。eコマース分野は、他のどの伝統的な小売チャネルよりも速いペースで成長しています。主なオンライン小売業者は、ウォルマート、アマゾン、デル、シアーズ、ステープルズ、コストコ、ベストバイです。ウォルマート、ターゲット、アルディなど、多くの従来型小売業者も、より大きな市場を獲得するため、eコマースに代わる商品を提供しています。
- 米国は、調査した市場において最も成長している地域セグメントであり、2022年には65.8%という大きな金額シェアを占め、取引外の小売チャネルを通じて最も多くのチューインガムを消費しています。米国の小売部門は巨大であり、そのため国際企業は米国で最初に確立されたビジネスモデルを採用するよう誘致されています。スーパーマーケットは、米国でチューインガムを購入するのに好まれるチャネルであり、2023年には42.72%という大きな金額シェアを占める。スーパーマーケットはアメリカの街角でよく見かける光景であり、人口5,000人以上の町のほとんどにスーパーマーケットが1軒はあります。
人口の82%が参加するハロウィンのチューインガムやその他のお菓子を買う習慣が北米成長の主な原動力
- 北米のチューインガム市場は、2023年には2022年比で3.8%の成長を観測しました。同地域では健康志向の消費者が増加しており、さらなる成長が見込まれます。健康志向の高まりにもかかわらず、チューインガムの売上は長年にわたって好調です。この地域の消費者は、食後や休憩の合間に無糖のチューインガムを選んでいます。平均的なアメリカ人は、1日にティースプーン34杯の砂糖、すなわち約500キロカロリー以上の砂糖を食べる。さらに、平均的な人の食事に含まれる砂糖の10%は、チューインガムのような菓子類から摂取されています。
- 米国は、調査した市場において最大の成長地域であり、2022年の市場において68.8%という大きな金額シェアを占めています。この成長は、様々な形状、色、風味などのチューインガムが入手可能であることが主な原因です。米国では、45.5%の消費者がミント味のチューインガムを好み、2022年には29.1%の消費者がフルーツ味を好みます。さまざまなフレーバーのガムが入手可能であることも、消費者の嗜好に合わせてこれらの製品を購入できるため、消費者の購買力を促進しています。同様に、約82%のアメリカ人がハロウィーンのチューインガムやその他のキャンディーを買う習慣に参加しています。
- 米国はまた、今後数年間で最も急成長する地域になると予想され、2027年から2029年までのCAGRは5.37%を記録します。バレンタインデー、イースター、ハロウィーン、その他の祝日には、アメリカ人の大多数(約80%~90%)が菓子類を購入するため、チューインガム、特に砂糖ベースのチューインガムの販売と消費が増加します。したがって、消費者は菓子類やガムを一種のセルフケアや楽しみとして受け入れ、ソーシャルメディアでインスピレーションを得たり、食料品売り場で衝動買いをしたりしています。
北米のチューインガム市場動向
地域全体の旺盛な生産能力が市場の成長を支えた
- 北米はチューインガムの生産と消費が盛んです。2022年現在、メキシコにはプエブラを拠点とする世界最大のガム工場があり、年間約6万トンのガム(そのほとんどが国内消費用)が生産されています。
- フレーバーは、チューインガムを購入する際に最も重要な特性の一つです。人気のあるチューインガムのフレーバーには、ペパーミント、スペアミント、スイカ、シナモン、オリジナル・バブルガム、トロピカルなどがあります。チューインガムのような製品を購入する際にも、ラベルは影響力を持っています。ラベルに書かれている「ナチュラル」や「プラントベース」といった言葉は、たとえその言葉の意味がわからなくても、より健康的なバリエーションであると認識されるため、人々を引きつける。
- この地域の消費者は、多くの小売店でガムをまとめ買いすることを好みます。経済パラメータは、北米の消費者のガム購買行動に影響を与える重要かつ主要な要因の一つです。
- 市場の成長は、プラスチックや人工保存料のようなガムの有害要素による悪影響に対する懸念の高まりによって制約されると予想されます。しかし、天然成分の配合や新フレーバーの導入といった製品イノベーションが、予測期間中の市場成長を後押しすると予想されます。
北米のチューインガム産業概要
北米のチューインガム市場はかなり統合されており、上位5社で92.55%を占めています。この市場の主要企業は以下の通りです。 Lotte Corporation, Mars Incorporated, Mondelez International Inc., Perfetti Van Melle BV and The Hershey Company.
その他の特典
- エクセル形式の市場予測(ME)シート
- 3ヶ月のアナリストサポート
目次
第1章 エグゼクティブサマリーと主な調査結果
第2章 レポートのオファー
第3章 イントロダクション
- 調査の前提条件と市場定義
- 調査範囲
- 調査手法
第4章 主要産業動向
- 規制の枠組み
- 消費者の購買行動
- 成分分析
- バリューチェーンと流通チャネル分析
第5章 市場セグメンテーション
- 砂糖含有量
- 砂糖入りチューインガム
- 無糖チューインガム
- 流通チャネル
- コンビニエンスストア
- オンライン小売店
- スーパーマーケット/ハイパーマーケット
- その他
- 国名
- カナダ
- メキシコ
- 米国
- その他の北米地域
第6章 競争情勢
- 主要な戦略動向
- 市場シェア分析
- 企業情勢
- 企業プロファイル
- Canel's Group
- Church & Dwight Co. Inc.
- Focus Foods Inc.
- Ford Gum & Machine Company Inc.
- Gerrit J. Verburg Co.
- Lotte Corporation
- Mars Incorporated
- Mazee LLC
- Mondelez International Inc.
- Perfetti Van Melle BV
- Simply Gum Inc.
- The Hershey Company
- The PUR Company Inc.
- Xylichew
第7章 CEOへの主な戦略的質問CEOへの主な戦略的質問
第8章 付録
- 世界概要
- 概要
- ファイブフォース分析フレームワーク
- 世界・バリューチェーン分析
- 市場力学(DROs)
- 情報源と参考文献
- 図表一覧
- 主要洞察
- データパック
- 用語集
目次
The North America Chewing Gum Market size is estimated at 4.68 billion USD in 2025, and is expected to reach 5.68 billion USD by 2030, growing at a CAGR of 3.93% during the forecast period (2025-2030).
High penetration of key retail chains helped supermarkets and hypermarkets be the most preferred channels, holding more than 40% market share in 2023
- The sales value of chewing gums through distribution channels experienced a growth rate of 8.56% in 2023 compared to 2022 and registered a CAGR of 4.90% during the review period (2021-2023). The growth is due to the high penetration of supermarkets and other traditional store formats, followed by mass merchandise stores, such as department stores and convenience stores. Volume sales of chewing gums across supermarkets and hypermarkets grew by 11% from 2021 to 2023. The rising popularity of e-commerce and vending machines is also propelling the growth of the market.
- The online retail stores segment is expected to be the fastest-growing distribution channel, recording a CAGR of 7.57% during the forecast period and a growth rate of 3.78% in 2029 compared to 2028. The e-commerce sector is growing at a faster pace than any other traditional retail channel. The key online retailers are Walmart, Amazon, Dell, Sears, Staples, Costco, and Best Buy. Many traditional retailers, such as Walmart, Target, and Aldi, among others, are also offering e-commerce alternatives to captivate a larger market.
- The United States is the largest-growing regional segment in the market studied, which consumed the largest amount of chewing gums through off-trade retail channels, accounting for a significant value share of 65.8% in 2022. The retail sector in the United States is huge, which, in turn, attracts international companies to adopt business models that were first established in the country. Supermarkets are the preferred channels for purchasing chewing gums in the United States, accounting for a significant value share of 42.72% in 2023. Supermarkets are a common sight on American streets, and most towns with a population of more than 5000 people have one supermarket in their vicinity.
Halloween chewing gum and other candy-buying traditions, where 82% of the population participate, a major driving factor for growth in North America
- The North American chewing gum market observed a growth of 3.8% in 2023 compared to 2022. Further growth is anticipated with the rising volume of health-conscious consumers in the region. Despite the rise in healthier eating, chewing gum sales have been favorable over the years. Consumers across the region are opting for sugar-free chewing gums after their meals or between their breaks. The average American eats 34 teaspoons of sugar a day, i.e., about 500+ calories. Moreover, 10% of the sugar in the average person's diet comes from confectionery like chewing gum.
- The United States is the largest-growing region in the market studied, accounting for a significant value share of 68.8% in 2022 in the market. This growth is majorly attributed to the availability of chewing gums in various shapes, colors, flavors, etc. In the United States, 45.5% of consumers prefer mint-flavored chewing gums, while fruit flavor is liked by 29.1% of consumers in 2022. The availability of gums in different flavors also promotes the consumer's buying power as they can purchase these products in accordance with their preferences. Likewise, around 82% of Americans participate in Halloween chewing gum and other candy-buying traditions.
- The United States is also anticipated to be the fastest-growing region in the coming years, registering a CAGR of 5.37% from 2027 to 2029. For Valentine's Day, Easter, Halloween, and other holidays, the majority of Americans (about 80%-90%) purchase confectionery, which leads to a rise in the sales and consumption of chewing gums, especially sugar-based chewing gums. Hence, consumers embraced confectionery and gums as a kind of self-care and enjoyment, finding their inspiration on social media or as an impulse purchase in the grocery aisle.
North America Chewing Gum Market Trends
The strong production capacity across the region supported the market's growth
- North America is a heavy producer and consumer of chewing gums. As of 2022, Mexico hosted the largest gum factory worldwide, based in Puebla, where around 60,000 tons of gum, most of which are intended for domestic consumption, is produced per year.
- Flavor is one of the most significant attributes when it comes to buying chewing gum. Some popular chewing gum flavors include peppermint, spearmint, watermelon, cinnamon, original bubblegum, and tropical. Labels have an impact even while purchasing a product like chewing gum. Terms like "natural" and "plant-based" on labels draw people in even if they do not know what those terms mean since they perceive them to be a healthier variant.
- Consumers in the region prefer to buy gum in bulk packages in many retail stores for lower prices. The economic parameter is one of the important and major factors influencing the consumer's gum-buying behavior in North America.
- The market's growth is anticipated to be constrained by rising concerns about the adverse impacts of gums' hazardous elements, such as plastic and artificial preservatives. However, product innovations, such as incorporating natural ingredients and introducing new product flavors, are expected to aid the market's growth during the forecast period.
North America Chewing Gum Industry Overview
The North America Chewing Gum Market is fairly consolidated, with the top five companies occupying 92.55%. The major players in this market are Lotte Corporation, Mars Incorporated, Mondelez International Inc., Perfetti Van Melle BV and The Hershey Company (sorted alphabetically).
Additional Benefits:
- The market estimate (ME) sheet in Excel format
- 3 months of analyst support
TABLE OF CONTENTS
1 EXECUTIVE SUMMARY & KEY FINDINGS
2 REPORT OFFERS
3 INTRODUCTION
- 3.1 Study Assumptions & Market Definition
- 3.2 Scope of the Study
- 3.3 Research Methodology
4 KEY INDUSTRY TRENDS
- 4.1 Regulatory Framework
- 4.2 Consumer Buying Behavior
- 4.3 Ingredient Analysis
- 4.4 Value Chain & Distribution Channel Analysis
5 MARKET SEGMENTATION (includes market size in Value in USD and Volume, Forecasts up to 2030 and analysis of growth prospects)
- 5.1 Sugar Content
- 5.1.1 Sugar Chewing Gum
- 5.1.2 Sugar-free Chewing Gum
- 5.2 Distribution Channel
- 5.2.1 Convenience Store
- 5.2.2 Online Retail Store
- 5.2.3 Supermarket/Hypermarket
- 5.2.4 Others
- 5.3 Country
- 5.3.1 Canada
- 5.3.2 Mexico
- 5.3.3 United States
- 5.3.4 Rest of North America
6 COMPETITIVE LANDSCAPE
- 6.1 Key Strategic Moves
- 6.2 Market Share Analysis
- 6.3 Company Landscape
- 6.4 Company Profiles
- 6.4.1 Canel's Group
- 6.4.2 Church & Dwight Co. Inc.
- 6.4.3 Focus Foods Inc.
- 6.4.4 Ford Gum & Machine Company Inc.
- 6.4.5 Gerrit J. Verburg Co.
- 6.4.6 Lotte Corporation
- 6.4.7 Mars Incorporated
- 6.4.8 Mazee LLC
- 6.4.9 Mondelez International Inc.
- 6.4.10 Perfetti Van Melle BV
- 6.4.11 Simply Gum Inc.
- 6.4.12 The Hershey Company
- 6.4.13 The PUR Company Inc.
- 6.4.14 Xylichew
7 KEY STRATEGIC QUESTIONS FOR CONFECTIONERY CEOS
8 APPENDIX
- 8.1 Global Overview
- 8.1.1 Overview
- 8.1.2 Porter's Five Forces Framework
- 8.1.3 Global Value Chain Analysis
- 8.1.4 Market Dynamics (DROs)
- 8.2 Sources & References
- 8.3 List of Tables & Figures
- 8.4 Primary Insights
- 8.5 Data Pack
- 8.6 Glossary of Terms
- 発行日
- 発行
- Mordor Intelligence
- ページ情報
- 英文 166 Pages
- 納期
- 2~3営業日