
アジア太平洋のアンカー・グラウト:市場シェア分析、産業動向と統計、成長予測(2025年~2030年)
Asia-Pacific Anchors and Grouts - Market Share Analysis, Industry Trends & Statistics, Growth Forecasts (2025 - 2030)- 発行日
- ページ情報
- 英文 245 Pages
- 納期
- 2~3営業日
- 商品コード
- 1683777
- カスタマイズ可能 お客様のご希望に応じて、既存データの加工や未掲載情報(例:国別セグメント)の追加などの対応が可能です。詳細はお問い合わせください。
- 適宜更新あり 本レポートは最新情報反映のため適宜更新し、内容構成変更を行う場合があります。ご検討の際はお問い合わせください。
- 翻訳ツール提供対象 PDF対応AI翻訳ツールの無料貸し出しサービスのご利用が可能です
概要
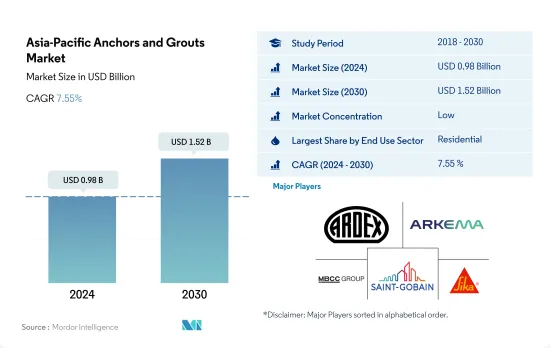
アジア太平洋のアンカー・グラウト市場規模は2024年に9億8,000万米ドルと推定され、2030年には15億2,000万米ドルに達すると予測され、予測期間中(2024年~2030年)のCAGRは7.55%で成長すると予測されます。
予測期間中、産業・施設セクターの成長率が高まる
- 2022年に調査された市場では、需要が1.5%減少したが、これは主にエンドユーザー部門全体の建設活動の落ち込みによるものでした。しかし、2023年には建設量が回復すると予測され、アンカー・グラウトの需要は2022年比で5.1%急増しました。
- アジア太平洋のアンカー・グラウト市場は、その人口の多さから住宅部門が世界の半分以上を占めています。特に、2022年には中国だけで同地域の需要の67%を占める。需要は、目地充填、コンクリートひび割れ補修、構造強化など、これらの製品のさまざまな用途によって促進されています。
- 2022年には、インフラ部門がアンカー・グラウトの第2位の消費者に浮上しました。同地域の各国政府は、経済を活性化し外国投資を誘致するため、インフラ整備を優先しました。例えば、インドの2022年のインフラ支出は前年比3.1%増となり、2019年から2023年にかけて約1兆4,000億米ドルをインフラプロジェクトに投資する計画と一致しました。
- 予測期間(2023年~2030年)には、産業・機関セクターがCAGR 8.82%を記録し、市場額で最も高い成長を遂げると予測されます。この急増は、製造工場、教育機関、ヘルスケアセンターなどの施設建設が急増していることに起因しています。この動向は、都市人口の拡大と、比較的手頃な人件費と土地代の魅力に後押しされています。例えば、2023年には中国の自動車メーカーBYD Co.がベトナムでの電気自動車製造・組立への投資を発表しました。
アンカー・グラウトは日本での需要が高いと予想されます。
- アンカーやグラウトのような建設用化学物質は、建物、橋、ダムなどの構造物の安定性、強度、寿命の向上に重要な役割を果たします。2022年のアジア太平洋のアンカー・グラウト市場は、2021年と比較して1.54%の微減となりました。中国が最も急激な落ち込みを経験し、アンカー・グラウトの市場価値は2021年から2022年にかけて4.94%急落しました。この減少の原因は、政府の厳格なCOVIDゼロ政策による閉鎖と建設活動の停止にあります。対照的に、オーストラリアは目覚しい上昇を見せ、2021年から2022年にかけて金額で18.40%の成長率を記録しました。
- 2022年には、中国がこの地域のアンカー・グラウト市場を席巻し、金額ベースで65%の大きな市場シェアを占めました。インフラ投資の急増が、特に様々な地域の建設ベンチャーにおけるアンカー・グラウトの需要を煽りました。中国の交通インフラへの公共投資は、2021年の1,576億米ドルから2022年には1,656億米ドルに増加しました。インフラ建設部門は、2021年から2022年にかけて5.60%のプラス成長する唯一の最終用途部門として浮上しました。
- 日本のアンカー・グラウト市場は、予測期間中に8.09%という最高のCAGRで推移すると予測されています。この成長は、CAGR 9.23%と予測される日本の産業・施設建設セクターによるものです。2022年から2030年にかけて、産業・施設建設のための新規床面積は1億4,000万平方フィート増加すると推定され、また、企業が製造施設を日本に移転する動向も相まって、このような需要が増加すると予想されます。これらの要因は、特に新しい生産ユニットの建設において、アンカー・グラウトの需要を促進すると予想されます。
アジア太平洋のアンカー・グラウト市場動向
インドなどで小売店やオフィススペースが増加し、アジア太平洋の商業建設セクターを押し上げる
- 2022年、アジア太平洋の商業施設の新設床面積は前年比3.23%減少しました。この後退は、規制の圧力、インフレ率の上昇、住宅ローン金利の急上昇といった要因によるものです。2023年には、この地域は回復し、商業施設の新設床面積は約1億4,600万平方フィート増加しました。この急増は主に外国直接投資(FDI)の増加によるもので、新しいオフィス、倉庫、小売店、その他の施設の需要に拍車をかけた。特に、ベトナムの建設部門は2023年に7,144万米ドルのFDI資本を誘致しました。
- 2020年、アジア太平洋は商業施設の新設床面積で大幅な後退を経験し、2019年比で21.92%の数量減となりました。この減少の主な原因は、政府による封鎖が広まり、プロジェクト作業が中断され、サプライチェーン、設備、労働力に深刻な影響を与えたことです。しかし、規制が緩和されるにつれ、同地域は目覚ましい回復を見せ、2021年の商業施設の新設床面積は20.98%急増し、約5億2,600万平方フィートの床面積に達しました。
- アジア太平洋の商業用新設床面積は大幅な成長が見込まれ、2023年と比較して2030年には14億1,000万平方フィート増加すると推定されます。この急増は、ショッピングモール、オフィススペース、小売店などに対する需要の高まりに後押しされています。アジア太平洋は世界の小売大国として台頭しており、世界の小売成長の4分の3近くに寄与しています。例えば、インドのグレードAオフィス市場は、上位7都市で2026年までに10億平方フィート、さらに2030年までに12億平方フィートまで拡大する可能性があります。全体として、アジア太平洋の商業施設の新設床面積は、予測期間中にCAGR5.16%を記録すると予測されています。
インドでは2030年までに2,500万戸に達する可能性があるなど、手頃な価格の住宅が増加し、同地域の住宅建設が拡大します。
- 2022年、アジア太平洋の住宅着工床面積は前年比約5.39%減少しました。この落ち込みは、COVID-19の大流行時に建築活動が急増した後、セクターが正常化した結果です。この地域の住宅セクターは、人口の増加、富裕層の増加、急速な都市化によって牽引されています。同地域の住宅新築床面積は、2023年には2022年比で4億1,000万平方フィート増加すると予想されました。
- 2020年、アジア太平洋の住宅新設床面積は2019年比で約5.06%減少しました。これは主に、政府による封鎖、サプライチェーンの混乱、労働力不足、建設生産性の低下、外国投資の低迷によるものでした。しかし、規制が緩和されるにつれて、この地域では大幅な回復が見られ、2021年には住宅新設戸数の増加により住宅新設床面積が約14億平方フィート急増しました。例えば、2021年だけでも、インドの住宅不動産市場は上位7都市で約16万3,000戸の新築住宅を導入します。
- アジア太平洋の住宅新築床面積は、予測期間中にCAGR 3.98%を記録すると予測されます。この成長は、住宅需要、投資の増加、有利な政府政策によるものです。より手頃な価格の住宅建設に注力することで、同地域の住宅建設セクターは活気を取り戻し、回復の一助となることが期待されます。2030年までには、インド人口の40%以上が都市部に居住するようになると推定され、さらに2,500万戸の手頃な価格の住宅需要が見込まれます。この需要の急増により、インドの住宅不動産市場は2030年までに150万戸に達すると予想されます。
アジア太平洋のアンカー・グラウト産業の概要
アジア太平洋のアンカー・グラウト市場は細分化されており、上位5社で21.81%を占めています。この市場の主要企業は以下の通り。 Ardex Group, Arkema, MBCC Group, Saint-Gobain and Sika AG(sorted alphabetically).
その他の特典
- エクセル形式の市場予測(ME)シート
- 3ヶ月のアナリストサポート
目次
第1章 エグゼクティブサマリーと主な調査結果
第2章 レポートのオファー
第3章 イントロダクション
- 調査の前提条件と市場定義
- 調査範囲
- 調査手法
第4章 主要産業動向
- 最終用途分野の動向
- 商業
- 産業・施設
- インフラ
- 住宅
- 主要インフラプロジェクト
- 規制の枠組み
- バリューチェーンと流通チャネル分析
第5章 市場セグメンテーション(市場規模、2030年までの予測、成長見通し分析を含む)
- 最終用途セクター
- 商業
- 産業・施設
- インフラ
- 住宅
- サブ製品
- セメント系固定材
- 樹脂固定
- 技術別
- エポキシグラウト
- ポリウレタン(PU)グラウト
- その他のタイプ
- 国名
- オーストラリア
- 中国
- インド
- インドネシア
- 日本
- マレーシア
- 韓国
- タイ
- ベトナム
- その他アジア太平洋
第6章 競合情勢
- 主要な戦略動向
- 市場シェア分析
- 企業情勢
- 企業プロファイル
- Ardex Group
- Arkema
- Cemkrete Inter Co., Ltd
- Fosroc, Inc.
- LATICRETE International, Inc.
- MAPEI S.p.A.
- MBCC Group
- RPM International Inc.
- Saint-Gobain
- Sika AG
第7章 CEOへの主な戦略的質問CEOへの主な戦略的質問
第8章 付録
- 世界概要
- 概要
- ファイブフォース分析フレームワーク(産業魅力度分析)
- 世界・バリューチェーン分析
- 市場力学(DROs)
- 情報源と参考文献
- 図表一覧
- 主要洞察
- データパック
- 用語集
目次
Product Code: 93526
The Asia-Pacific Anchors and Grouts Market size is estimated at 0.98 billion USD in 2024, and is expected to reach 1.52 billion USD by 2030, growing at a CAGR of 7.55% during the forecast period (2024-2030).
Industrial and institutional sector to grow at a faster rate during the forecast period
- In 2022, the market studied witnessed a 1.5% decline in demand, primarily driven by a dip in construction activities across end-user sectors. However, the construction volume was projected to rebound in 2023, leading to a 5.1% surge in demand for anchors and grouts compared to 2022.
- The residential sector dominates the anchors and grouts market in Asia-Pacific, given its substantial population, accounting for over half of the global total. Notably, China alone represented 67% of the region's demand in 2022. The demand is fueled by various applications of these products, including joint filling, concrete crack repairs, and structural enhancements.
- In 2022, the infrastructure sector emerged as the second-largest consumer of anchors and grouts. Governments in the region prioritized infrastructure development to stimulate their economies and attract foreign investments. For instance, India's infrastructure spending in 2022 rose by 3.1% from the previous year, aligning with its plan to invest approximately USD 1.4 trillion in infrastructure projects between 2019 and 2023.
- During the forecast period (2023-2030), the industrial and institutional sector is projected to witness the highest growth in market value, boasting a CAGR of 8.82%. This surge can be attributed to the escalating construction of facilities like manufacturing plants, educational institutions, and healthcare centers. This trend is propelled by the expanding urban population and the appeal of relatively affordable labor and land costs. For instance, in 2023, Chinese automaker BYD Co. announced its investment in electric vehicle manufacturing and assembly in Vietnam.
High demand is forecasted for anchors and grouts in Japan as companies bring production units back home
- Construction chemicals like anchors and grouts play a crucial role in enhancing the stability, strength, and longevity of structures such as buildings, bridges, and dams. In 2022, the value of the anchors and grouts market in Asia-Pacific witnessed a slight decline of 1.54% compared to 2021. China experienced the sharpest downturn, with its anchors and grouts market value plummeting by 4.94% from 2021 to 2022. This decline can be attributed to the government's stringent zero-COVID policy, which led to lockdowns and halted construction activities. In contrast, Australia saw a remarkable upswing, registering a growth rate of 18.40% in value from 2021 to 2022.
- In 2022, China dominated the anchors and grouts market in the region, commanding a significant market share of 65% by value. The surge in infrastructure investments fueled the demand for anchors and grouts, especially in various regional construction ventures. China's public spending on transport infrastructure rose to USD 165.6 billion in 2022, up from USD 157.6 billion in 2021. The infrastructure construction segment emerged as the sole end-use sector in the country to witness a positive growth of 5.60% from 2021 to 2022.
- Japan's anchors and grouts market is projected to witness the highest CAGR of 8.09% during the forecast period. This growth can be attributed to the country's industrial and institutional construction sector, which is anticipated to witness a robust CAGR of 9.23%. There is an estimated surge of 140 million square feet in new floor area for I&I construction from 2022 to 2030, coupled with a trend of companies relocating their manufacturing facilities to Japan. These factors are expected to drive the demand for anchors and grouts, particularly in the construction of new production units.
Asia-Pacific Anchors and Grouts Market Trends
Rising retail and office spaces in countries such as India to boost the Asia-Pacific commercial construction sector
- In 2022, Asia-Pacific witnessed a 3.23% decline in its commercial new floor area compared to the previous year. This setback was attributed to factors such as regulatory pressures, higher inflation, and a surge in mortgage rates. In 2023, the region rebounded, with commercial construction new floor area increasing by approximately 146 million sq. ft. This surge was primarily driven by a rise in foreign direct investment (FDI), which spurred the demand for new offices, warehouses, retail outlets, and other facilities. Notably, the Vietnamese construction sector attracted an FDI capital of USD 71.44 million in 2023.
- In 2020, the Asia-Pacific region experienced a significant setback in commercial new floor area, with a volume decline of 21.92% compared to 2019. This decline was primarily due to widespread government lockdowns, which disrupted project work and severely impacted supply chains, equipment, and labor. However, as restrictions eased, the region witnessed a remarkable rebound, with its commercial new floor area surging by 20.98% in 2021, reaching a volume of approximately 526 million sq. ft.
- Asia-Pacific's commercial new floor area is projected to witness substantial growth, with an estimated increase of 1.41 billion sq. ft by 2030 compared to 2023. This surge is fueled by a rising demand for shopping malls, office spaces, retail outlets, and more. The Asia-Pacific region is emerging as a global retail powerhouse, contributing to nearly three-quarters of the worldwide retail growth. For instance, the Indian Grade A office market in its top seven cities may to expand to 1 billion sq. ft by 2026 and further to 1.2 billion sq. ft. by 2030. Overall, the commercial new floor area in Asia-Pacific is projected to witness a volume CAGR of 5.16% during the forecast period.
Rising affordable housing units, such as India's likely to reach 25 million by 2030, to augment the residential constructions in the region
- In 2022, the residential new floor area in the Asia-Pacific region saw a volume decline of approximately 5.39% from the previous year. This dip was a result of the sector normalizing after a surge in building activity during the COVID-19 pandemic. The region's residential sector is driven by a growing population, increasing wealth, and rapid urbanization. The residential new floor area in the region was expected to rise by 410 million sq. ft in 2023 compared to 2022.
- In 2020, the residential new floor area in Asia-Pacific declined in volume by around 5.06% compared to 2019. This was primarily due to government-imposed lockdowns, disruptions in the supply chain, labor shortages, reduced construction productivity, and low foreign investments. However, as restrictions eased, the region saw a significant rebound, with the residential new floor area surging by about 1.4 billion sq. ft in 2021, driven by the addition of new residential housing units. For instance, in 2021 alone, the Indian residential real estate market introduced approximately 163 thousand new residential units across its top seven cities.
- The residential new floor area in the Asia-Pacific region is projected to witness a CAGR of 3.98% during the forecast period. This growth can be attributed to the demand for housing, increased investments, and favorable government policies. The focus on constructing more affordable housing units is expected to rejuvenate the residential construction sector in the region, aiding its recovery. By 2030, it is estimated that over 40% of India's population will reside in urban areas, leading to a demand for an additional 25 million affordable housing units. This surge in demand is expected to push the Indian residential real estate market to reach 1.5 million units by 2030.
Asia-Pacific Anchors and Grouts Industry Overview
The Asia-Pacific Anchors and Grouts Market is fragmented, with the top five companies occupying 21.81%. The major players in this market are Ardex Group, Arkema, MBCC Group, Saint-Gobain and Sika AG (sorted alphabetically).
Additional Benefits:
- The market estimate (ME) sheet in Excel format
- 3 months of analyst support
TABLE OF CONTENTS
1 EXECUTIVE SUMMARY & KEY FINDINGS
2 REPORT OFFERS
3 INTRODUCTION
- 3.1 Study Assumptions & Market Definition
- 3.2 Scope of the Study
- 3.3 Research Methodology
4 KEY INDUSTRY TRENDS
- 4.1 End Use Sector Trends
- 4.1.1 Commercial
- 4.1.2 Industrial and Institutional
- 4.1.3 Infrastructure
- 4.1.4 Residential
- 4.2 Major Infrastructure Projects (current And Announced)
- 4.3 Regulatory Framework
- 4.4 Value Chain & Distribution Channel Analysis
5 MARKET SEGMENTATION (includes market size, forecasts up to 2030 and analysis of growth prospects.)
- 5.1 End Use Sector
- 5.1.1 Commercial
- 5.1.2 Industrial and Institutional
- 5.1.3 Infrastructure
- 5.1.4 Residential
- 5.2 Sub Product
- 5.2.1 Cementitious Fixing
- 5.2.2 Resin Fixing
- 5.2.2.1 By Technology
- 5.2.2.1.1 Epoxy Grout
- 5.2.2.1.2 Polyurethane (PU) Grout
- 5.2.3 Other Types
- 5.3 Country
- 5.3.1 Australia
- 5.3.2 China
- 5.3.3 India
- 5.3.4 Indonesia
- 5.3.5 Japan
- 5.3.6 Malaysia
- 5.3.7 South Korea
- 5.3.8 Thailand
- 5.3.9 Vietnam
- 5.3.10 Rest of Asia-Pacific
6 COMPETITIVE LANDSCAPE
- 6.1 Key Strategic Moves
- 6.2 Market Share Analysis
- 6.3 Company Landscape
- 6.4 Company Profiles
- 6.4.1 Ardex Group
- 6.4.2 Arkema
- 6.4.3 Cemkrete Inter Co., Ltd
- 6.4.4 Fosroc, Inc.
- 6.4.5 LATICRETE International, Inc.
- 6.4.6 MAPEI S.p.A.
- 6.4.7 MBCC Group
- 6.4.8 RPM International Inc.
- 6.4.9 Saint-Gobain
- 6.4.10 Sika AG
7 KEY STRATEGIC QUESTIONS FOR CONCRETE, MORTARS AND CONSTRUCTION CHEMICALS CEOS
8 APPENDIX
- 8.1 Global Overview
- 8.1.1 Overview
- 8.1.2 Porter's Five Forces Framework (Industry Attractiveness Analysis)
- 8.1.3 Global Value Chain Analysis
- 8.1.4 Market Dynamics (DROs)
- 8.2 Sources & References
- 8.3 List of Tables & Figures
- 8.4 Primary Insights
- 8.5 Data Pack
- 8.6 Glossary of Terms
アジア太平洋のアンカー・グラウト:市場シェア分析、産業動向と統計、成長予測(2025年~2030年)
- 発行日
- 発行
- Mordor Intelligence
- ページ情報
- 英文 245 Pages
- 納期
- 2~3営業日


