
|
市場調査レポート
商品コード
1644818
欧州の通関仲介:市場シェア分析、産業動向、成長予測(2025年~2030年)Europe Customs Brokerage - Market Share Analysis, Industry Trends & Statistics, Growth Forecasts (2025 - 2030) |
||||||
カスタマイズ可能
適宜更新あり
|
|||||||
| 欧州の通関仲介:市場シェア分析、産業動向、成長予測(2025年~2030年) |
|
出版日: 2025年01月05日
発行: Mordor Intelligence
ページ情報: 英文 120 Pages
納期: 2~3営業日
|

全表示
- 概要
- 目次
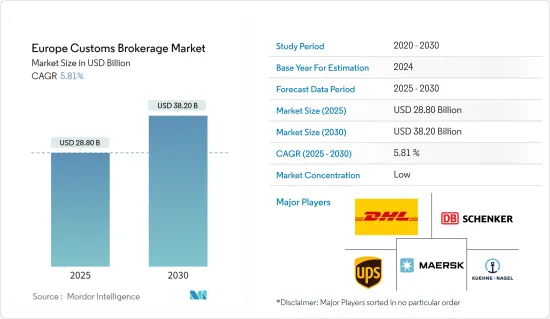
欧州の通関仲介市場規模は2025年に288億米ドルと推定され、予測期間(2025~2030年)のCAGRは5.81%で、2030年には382億米ドルに達すると予測されます。
主要ハイライト
- 2023年第3四半期のEUの財輸出入量は、2023年第1四半期と比較してそれぞれ4.6%(前年同期比)、1.2%(同)減少しました。EUの財の輸出量は3四半期連続で減少し、輸入量は4四半期連続で減少しました。
- EUの貿易収支の黒字は約180億ユーロ(197億5,000万米ドル)にとどまり、2021年第3四半期には69億ユーロ(75億7,000万米ドル)の黒字を記録しました。
- 2023年第3四半期のその他製造財の輸入は前年同期比で66億ユーロ(72億4,000万米ドル)減少し、機械・車両が62億ユーロ(68億米ドル)、エネルギーが47億ユーロ(51億6,000万米ドル)と続きました。
- 輸出は、機械・車両グループが69億ユーロ(75億7,000万米ドル)、その他製造品グループが27億ユーロ(29億6,000万米ドル)減少しました。一方、エネルギーは34億ユーロ(37億3,000万米ドル)、化学は32億ユーロ(35億1,000万米ドル)それぞれ増加しました。
- エネルギー部門の貿易赤字は、過去最低の-1,938億ユーロ(2,126億5,000万米ドル)を記録した2022年第3四半期以降、減少傾向にあります。この主要要因は、2023年第3四半期のエネルギー価格の下落であり、これが貿易赤字の減少に寄与しました。
欧州の通関仲介市場の動向
市場の成長を牽引するドイツ
- 欧州最大の経済大国であり、世界第4位の経済大国でもあるドイツは、世界第3位の生産国でもあります。
- 暦年と季節性を調整した後、2022年9月のドイツの商品輸出高は1,265億ユーロ(1,386億3,000万米ドル)、商品輸入高は1,100億ユーロ(1,205億5,000万米ドル)でした。
- 貿易収支は、2022年8月に記録された177億ユーロ(194億米ドル)の黒字と2022年9月に記録された50億ユーロ(54億8,000万米ドル)に対し、2022年9月には165億ユーロの黒字を記録しました。
- 2023年9月のドイツのEU加盟国への輸出額は698億ユーロ、EU加盟国からの輸入額は587億ユーロ(641億9,000万米ドル)でした。季節調整済みで暦年ベースでは、EU諸国への輸出は2023年8月に比べ2.1%減少し、輸入は2.6%減少しました。
- 2023年9月のユーロ圏諸国への輸出額は488億ユーロ(534億8,000万米ドル)(2.4%減)、ユーロ圏諸国からの輸入額は389億ユーロ(426億3,000万米ドル)(3.4%減)でした。一方、EU域内への輸出額は209億ユーロ(229億米ドル)(1.3%減)であったが、ユーロ圏外からの輸入額は198億ユーロ(217億米ドル)(0.2%減)でした。
- 2022年9月の欧州連合(EU)域外の第三国への商品輸出額は567億ユーロ(621億4,000万米ドル)、輸入額は暦年調整値と季節調整値ともに513億ユーロ(562億2,000万米ドル)でした。2022年8月と比較すると、第三国からの輸出は28億ユーロ(30億7,000万米ドル)減少し、輸入は6億ユーロ(6億6,000万米ドル)減少しました。
- ドイツの輸出の大半は米国向けでした。季節調整と暦年調整の後、対米商品輸出額は2022年8月と比較して40億ユーロ(43億8,000万米ドル)減少し、対米輸出額は128億ユーロ(135億7,000万米ドル)に減少しました。対中財輸出量は73億ユーロ(80億米ドル)減少し、77億ユーロ(84億4,000万米ドル)となりました。一方、英国への輸出は23億ユーロ(23億米ドル)増加して67億ユーロ(73億4,000万米ドル)となりました。
- 2023年9月には、輸入の大半を中華人民共和国が占め、その金額は130億ユーロ(142億5,000万米ドル)でした。暦年調整と季節調整後では、前月比で7億ユーロ(7億7,000万米ドル)の減少となりました。米国は5億ユーロ(5億5,000万米ドル)増の77億ユーロ(84億4,000万米ドル)となりました。
- 英国は同52億ユーロ(57億米ドル)増の32億ユーロ(35億1,000万米ドル)でした。一方、ロシア連邦からの輸入は、前月の114億ユーロ(124億9,000万米ドル)の減少に対し、2023年9月は112億ユーロ(122億7,000万米ドル)の減少となりました。対ロシア輸出は前月比で417億ユーロ(457億米ドル)減少しました。一方、ロシアからの輸入は前月比75億ユーロ(82億2,000万米ドル)増加し、前月比894億ユーロ(979億7,000万米ドル)減少しました。
海上輸送が市場を独占
- 海運は長い間、欧州の経済成長と繁栄の重要な原動力となってきました。海上輸送は、すべての欧州諸国間の貿易とつながりを促進します。エネルギー、食糧、商品の供給が守られ、海上輸送はEU域内と域外への輸出入の主要な手段となっています。
- 海上輸送はEU域内の対外貨物貿易のほぼ90%を占め、短海輸送はトンキロでEU域内貿易の3分の1を占めています。良好な海上輸送サービスは、欧州の島々や周辺海域の生活の質にとって不可欠です。
- 欧州の港には毎年4億人以上の旅客が出入りしています。一般に、海運業は欧州経済に雇用と収入を提供しています。
- 欧州の港湾における2022年の貨物取扱量は35億トンで、2021年をわずかに上回った(前年比0.8%減)。パンデミック(世界的大流行)やEU全域と世界の規制のためと思われる2020年の大幅な落ち込みの後、2022年の水準は2018年をわずかに下回っています。
- 欧州の港湾貨物活動は2014年以降プラス傾向を示しており、2009年の経済危機後のわずかな回復を示唆しています。2020年の同四半期と比較すると、2021年の第1四半期に低下した後、2021年の最後の3四半期と2022年の最初の2四半期には明らかな上昇が見られました。しかし、2022年の最後の2四半期には活動の減少が見られ、第3四半期は前年同期比▲0.1%、第4四半期は▲2.2%となりました。
- 海上貨物輸送では、オランダは2022年に欧州最大の海上貨物輸送国の地位を維持し、他の欧州最大の7港はロッテルダム(オランダ)、アントワープ(ブルージュ)、ハンブルク(ハンブルク)、アムステルダム(アムステルダム・ミュンヘン)、アルヘシラス(ハルポ[2])、マルセイユ(マルセイユ)です。
- 対人口海上貨物比では、EU加盟国は、2022年のオランダの33.3 TfCからポーランド(ルーマニア)の3.2 TfC、EU平均の7.8 TfCまで幅があった。しかし、EFTA加盟国であるノルウェーは、2022年のEurostatへの海事データ報告国の中で最も高い比率(39.4 TfC)を示しました。
欧州の通関仲介産業概要
欧州の通関仲介市場は、その性質上、セグメント化されています。市場には多数の通関業者が進出しており、競争は激しいです。市場の主要企業には、DHL Logistics、Maersk Logistics、Kuehne and Nagel Logistics、United Parcel Services、DB Schenkerなどがあります。
これらの企業は強い評判を築き、顧客やパートナーとの幅広いネットワークを持っています。また、欧州各国の通関手続きに豊富な経験を持つことも多く、企業にとって信頼できる選択肢となっています。
その他の特典
- エクセル形式の市場予測(ME)シート
- 3ヶ月間のアナリストサポート
目次
第1章 イントロダクション
- 調査の前提条件と市場定義
- 市場の範囲
第2章 調査手法
第3章 エグゼクティブサマリー
第4章 市場洞察
- 現在の市場シナリオ
- 政府の取り組みと規制
- サプライチェーン/バリューチェーン分析
- 貨物輸送機能としての通関仲介概要
- 通関価格設定概要
- エンドユーザー産業による通関サービスに関する洞察
- COVID-19が市場に与える影響
第5章 市場力学
- 促進要因
- 国際貿易の増加
- 複雑な通関規制
- 抑制要因
- 規制の課題
- 地政学的不確実性
- 機会
- eコマースブーム
- 技術の進歩
- 産業の魅力-ポーターのファイブフォース分析
- 供給企業の交渉力
- 消費者の交渉力
- 新規参入業者の脅威
- 競合の脅威
- 競争企業間の敵対関係
第6章 市場セグメンテーション
- 輸送モード別
- 海上
- 航空輸送
- 越境陸上輸送
- 地域別
- ドイツ
- 英国
- フランス
- オランダ
- イタリア
- その他の欧州
第7章 競合情勢
- 市場集中度概要
- 企業プロファイル
- DHL Group Logistics
- DB Schenker
- Kuehne and Nagel
- Maersk Logistics
- United Parcel Services
- FedEx
- Rhenus Logistics
- Gerlach Customs
- APL Logistics
- Gaston Schul Logistics*
第8章 市場の将来
第9章 付録
- マクロ経済指標
- 資本フロー洞察
- 輸出入統計
The Europe Customs Brokerage Market size is estimated at USD 28.80 billion in 2025, and is expected to reach USD 38.20 billion by 2030, at a CAGR of 5.81% during the forecast period (2025-2030).
Key Highlights
- The volume of EU goods exports and imports decreased in Q3 2023, with a decrease of 4.6% (YoY) and 1.2% (RuY), respectively, compared to Q1 2023. The volume of EU exports in goods decreased for a third consecutive quarter, while imports decreased for a fourth consecutive quarter.
- The surplus in the EU's trade balance remained at around EUR 18 billion (USD 19.75 billion), with a surplus of EUR 6.9 billion (USD 7.57 billion)recorded in Q3 2021.
- Other manufactured goods imports decreased by EUR 6.6 billion (USD 7.24 billion) in the Q3 of 2023 compared to the Q2 of 2023, followed by machinery and vehicles at EUR 6.2 billion(USD 6.80 billion) and energy at EUR 4.7 billion(USD 5.16 billion).
- Exports decreased in the machinery and vehicles group by EUR 6.9 billion (USD 7.57 billion) and in the other manufactured goods group by EUR 2.7 billion(USD 2.96 billion). At the same time, energy and chemicals increased by EUR 3.4 billion (USD 3.73 billion) and EUR 3.2 billion(USD 3.51 billion), respectively.
- In the energy sector, the trade deficit has been on a declining trend since Q3 of 2022, when it reached a record low of -EUR 193.8 billion (USD 212.65 billion). The main reason for this was falling energy prices in Q3 of 2023, which contributed to the decrease in the trade deficit.
Europe Customs Brokerage Market Trends
Germany Driving the Growth of the Market
- In addition to having the biggest economy in Europe and the fourth-largest economy in the world, Germany is the third-largest producer in the world.
- After adjusting for calendar and seasonality, the volume of goods exported by Germany totaled EUR 126,5 billion (USD 138.63 billion), and the volume of goods imported totaled EUR 110,0 billion (USD 120.55 billion) in September 2022.
- The trade balance recorded a surplus of EUR 16,5 billion in September 2022 compared with a surplus of EUR 17,7 billion (USD 19.40 billion) recorded in August 2022 and EUR 5,0 billion (USD 5.48 billion) recorded in September 2022.
- Germany exported goods to the EU Member States in September 2023 worth EUR 69.8 billion while importing goods from these countries worth EUR 58.7 billion (USD 64.19 billion). Calendar and seasonally adjusted, exports to EU countries decreased by 2.1%, while imports decreased by 2.6% compared to August 2023.
- In September 2023, the value of goods exported to euro-zone countries totaled EUR 48.8 billion (USD 53.48 billion) (-2.4%), while the value of goods imported from euro-area countries totaled EUR 38.9 billion (USD 42.63 billion) (-3.4%). On the other hand, goods to the EU were exported worth EUR 20.9 billion (USD 22.90 billion) (-1.3%), while the value of imports from non-euro-zone countries was EUR 19.8 billion (USD 21.70 billion) (-0.2%).
- The volume of goods exported to third countries outside the European Union (EU) totaled EUR 56.7 billion (USD 62.14 billion in September 2022, while imports totaled EUR 51.3 billion (USD 56.22 billion), both calendar- and seasonally-adjusted. Compared to August 2022, third-country exports decreased by EUR 2,8 billion (USD 3.07 billion), while imports decreased by EUR 0,6 billion (USD 0.66 billion).
- The majority of German exports were made to the United States. After adjusting for seasonal and calendar adjustments, the value of goods exports to the US decreased by EUR 4,0 billion (USD 4.38 billion) compared to August 2022, with exports to the US dropping to EUR 12.8 billion (USD 13.57 billion). The volume of goods exports to China decreased by EUR 7.3 billion (USD 8 billion) to EUR 7.7 billion (USD 8.44 billion). In contrast, exports to the UK increased by EUR 2.3 billion (USD 2.3 billion) to EUR 6.7 billion (USD 7.34 billion).
- In September 2023, the People's Republic of China accounted for the majority of imports, with goods valued at EUR 13,0 billion (USD 14.25 billion). After calendar and seasonal adjustments, this represents a decrease of EUR 0.7 billion (USD 0.77 billion) compared to the previous month. The United States increased imports by EUR 0.5 billion (USD 0.55 billion) to EUR 7.7 billion (USD 8.44 billion).
- The United Kingdom increased imports by EUR 5.2 billion (USD 5.70 Billion) to EUR 3,2 billion (USD 3.51 billion) in the same month. On the other hand, imports from the Russian Federation decreased by EUR 11.2 billion (USD 12.27 billion) in September 2023, compared to a decrease of EUR 11.4 billion (USD 12.49 billion) in the month before. Compared to the month before, exports to Russia decreased by EUR 41.7 billion (USD 45.70 billion). At the same time, imports from Russia increased by EUR 7.5 billion (USD 8.22 billion) from the month before and decreased by EUR 89.4 billion (USD 97.97 billion) compared to the month before.
Sea Transport Dominates the Market
- Shipping has long been a key driver of economic growth and prosperity for Europe. Maritime Transport facilitates trade and links between all European countries. Energy, food, and commodity supply are safeguarded, and maritime transport is the main means of import and export into the EU and beyond.
- Seaborne accounts for almost 90% of external freight trade in the EU, and short sea shipping accounts for one-third of EU exchanges in ton-kilometres. Good maritime transport services are essential for the quality of life in Europe's islands and peripheral maritime regions.
- Over 400 million passengers arrive and leave at European ports each year. In general, maritime industries provide employment and income to the European economy.
- EU ports handled 3,5 billion tonnes of goods in 2022, which is slightly higher than in 2021 (-0.8% YoY). After a significant drop in 2020, which is most likely due to the pandemic and restrictions imposed across the EU and globally, the levels in 2022 are slightly lower than in 2018.
- EU port freight activity showed a positive trend since 2014, suggesting a slight recovery after the 2009 economic crisis. After a drop in the first quarter of 2021 when compared to the same quarter in 2020, there was a clear increase in the last three quarters of 2021 and the first two quarters of 2022. However, there was a decrease in activity in the final two quarters of 2022, with a drop in activity (-0.1% YoY in the 3rd quarter and (-2.2%) in the 4th quarter.
- In terms of maritime freight transport, the Netherlands maintained its position as the largest country in Europe for maritime freight transport in 2022, with the other seven largest ports in Europe being Rotterdam (Netherlands), Antwerp (Bruges), Hamburg (Hamburg), Amsterdam (Amsterdam-Munich), Algeciralas (Harpo[2]) and Marseille (Marseille).
- In terms of seaborne cargo-to-capita ratios, EU Member States ranged from 33.3 TfC in the Netherlands in 2022 to 3.2 TfC in Poland (Romania) and the EU average of 7.8 TfC in 2022. However, Norway, an EFTA country, had the highest ratio (39.4 TfC) of maritime data reporting countries to Eurostat in 2022.
Europe Customs Brokerage Industry Overview
The market for customs brokerage in Europe is fragmented in nature. With a large number of customs brokers operating in the market, the competition is high. The major players in the market include DHL Logistics, Maersk Logistics, Kuehne and Nagel Logistics, United Parcel Services, DB Schenker, etc.
The companies have built a strong reputation and have a wide network of clients and partners. They often have extensive experience in handling customs procedures across different European countries, making them a reliable choice for businesses.
Additional Benefits:
- The market estimate (ME) sheet in Excel format
- 3 months of analyst support
TABLE OF CONTENTS
1 INTRODUCTION
- 1.1 Study Assumptions and Market Definition
- 1.2 Scope of the Market
2 RESEARCH METHODOLOGY
3 EXECUTIVE SUMMARY
4 MARKET INSIGHTS
- 4.1 Current Market Scenario
- 4.2 Government Initiatives and Regulations
- 4.3 Supply Chain/Value Chain Analysis
- 4.4 Brief on Customs Brokerage as a Freight Forwarding Function
- 4.5 Overview of Customs Pricing
- 4.6 Insights on Customs Brokerage Services by End-user Industry
- 4.7 Impact of COVID-19 on the Market
5 MARKET DYNAMICS
- 5.1 Drivers
- 5.1.1 Increasing international trade
- 5.1.2 Complex custom regulations
- 5.2 Restraints
- 5.2.1 Regulatory Challenges
- 5.2.2 Geopolitical Uncertainity
- 5.3 Opportunities
- 5.3.1 E-commerce Boom
- 5.3.2 Technological Advancements
- 5.4 Industry Attractiveness - Porter's Five Forces Analysis
- 5.4.1 Bargaining Power of Suppliers
- 5.4.2 Bargaining Power of Consumers
- 5.4.3 Threat of New Entrants
- 5.4.4 Threat of Subsititutes
- 5.4.5 Intensity of Competitive Rivalry
6 MARKET SEGMENTATION
- 6.1 By Mode Of Transport
- 6.1.1 Sea
- 6.1.2 Air
- 6.1.3 Cross-Border Land Transport
- 6.2 By Geography
- 6.2.1 Germany
- 6.2.2 United Kingdom
- 6.2.3 France
- 6.2.4 Netherlands
- 6.2.5 Italy
- 6.2.6 Rest of Europe
7 COMPETITIVE LANDSCAPE
- 7.1 Market Concentration Overview
- 7.2 Company Profiles
- 7.2.1 DHL Group Logistics
- 7.2.2 DB Schenker
- 7.2.3 Kuehne and Nagel
- 7.2.4 Maersk Logistics
- 7.2.5 United Parcel Services
- 7.2.6 FedEx
- 7.2.7 Rhenus Logistics
- 7.2.8 Gerlach Customs
- 7.2.9 APL Logistics
- 7.2.10 Gaston Schul Logistics*
8 FUTURE OF THE MARKET
9 APPENDIX
- 9.1 Macroeconomic Indicators
- 9.2 Insights on capital flow
- 9.3 Exports and Import Statistics
