
米国の商業用建設:市場シェア分析、産業動向、成長予測(2025~2030年)
United States Commercial Construction - Market Share Analysis, Industry Trends & Statistics, Growth Forecasts (2025 - 2030)- 発行日
- ページ情報
- 英文 150 Pages
- 納期
- 2~3営業日
- 商品コード
- 1644327
- カスタマイズ可能 お客様のご希望に応じて、既存データの加工や未掲載情報(例:国別セグメント)の追加などの対応が可能です。詳細はお問い合わせください。
- 適宜更新あり 本レポートは最新情報反映のため適宜更新し、内容構成変更を行う場合があります。ご検討の際はお問い合わせください。
- 翻訳ツール提供対象 PDF対応AI翻訳ツールの無料貸し出しサービスのご利用が可能です
概要
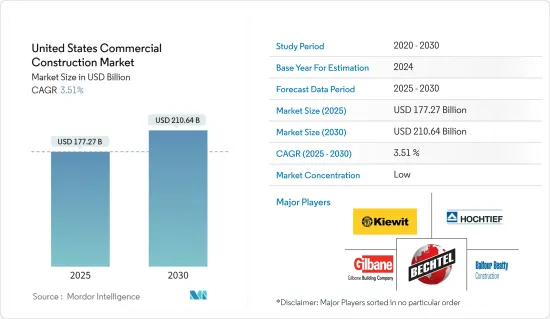
米国の商業用建設市場規模は2025年に1,772億7,000万米ドルと推定され、予測期間(2025~2030年)のCAGRは3.51%で、2030年には2,106億4,000万米ドルに達すると予測されます。
インフレと労働力不足にもかかわらず、商業用不動産への需要は引き続き市場を牽引しています。さらに、国内のインフラ整備に巨額の投資が注ぎ込まれていることも市場を牽引しています。
主要ハイライト
- 2021年の商業用建設産業は全体的に好調な年でした。住宅建設への支出が多かったため建設支出は増加したが、非住宅部門は2年連続で減少しました。建設会社はまた、継続的な労働力不足や、供給問題と資材価格の上昇による建設資材の入荷遅延に対処しなければならなかった。2021年11月までの建設支出は1兆4,600億米ドルとなり、この年も建設着工件数としては過去最高を記録しました。
- インフラ支出は、2022年の建設で最も成長するセグメントのひとつです。1兆2,000億米ドルのインフラ投資・雇用法により、議会は長年の暫定措置と短期支出法案を経て、ついに長期インフラ法案を可決しました。今後5年間で、連邦政府は新規インフラ建設と既存インフラの補修に5,500億米ドルを投資します。この法案では、道路、橋、インフラプロジェクトに1,100億米ドル、橋の補修・架け替えに400億米ドル、公共輸送に390億米ドル、旅客・貨物鉄道に660億米ドル、ブロードバンドインターネットに650億米ドル、電力網の再構築に650億米ドル、水インフラに550億米ドルの投資を提案しています。
- パンデミックの間、非住宅建設市場では、建設サービスの劇的な増加は見られません。確かに、倉庫やデータセンターなど急成長を遂げた業種もあったが、オフィスビルやホテルなど、普及が遅れている業種によって相殺されました。建設産業は、他の多くの産業と同様、脆弱なサプライチェーンと労働力の減少によって打撃を受けました。建設資材の価格は高騰し、たとえば木材は一時、大流行前の水準から264%も上昇しました。さらに、製品のリードタイムも高騰を続け、パンデミック前の3倍や4倍になることも珍しくなかった。物価上昇に対抗するため、連邦準備制度理事会(FRB)は積極的にフェデラルファンド金利を引き上げ、2022年までに4回の引き上げを行った。
- 資料によると、インフレと特定の建設資材のリードタイムはようやく緩和されつつあります。製造業、高速道路、運輸、集合住宅、宿泊、通信の6セクターの建設支出は、2023年に少なくとも5%増加すると予想されています。医療、公共安全、教育、商業を含むその他のセクターは、0~4%の成長が見込まれています。建設内装材、木材、配管など、その他の材料のリードタイムも短縮しています。配管パイプの場合、原料の入手可能性が改善され、生産量が増加し、住宅建設需要が減少しています。
米国の商業用建設市場の動向
スマートシティの出現が主要市場動向
ニューヨーク市は現在、世界で2番目にスマートな都市にランクされており、最も著名なスマートシティのひとつです。この都市の主要イノベーションは、交通と通信の連携形態によって特定できます。スマートシティでは、業務の管理にはデータと通信の統合が必要であり、最新技術の活用も欠かせないです。スマートシティの開発は、交通、交通管理、エネルギー効率と持続可能性、ガバナンスといった機能セグメントの創出につながります。米国全土でスマートシティプロジェクトが増加するにつれ、先進的道路ネットワークシステムの構築が必要となるため、同市場のベンダーには成長機会が生まれます。
例えば、2022年10月、Honeywellのスマートシティ戦略計画のためのアクセラレーター・プログラムは、都市の将来計画を支援し、変革的な取り組みに資金を供給する能力を構築するためにAcceleration for Americaと提携すると発表しました。現物支援は、HoneywellとAcceleration for Americaが提携するHoneywellのスマートシティ・アクセラレーター・プログラムを通じて提供されます。Acceleration for Americaプログラムは、都市の戦略的計画策定の進捗を加速させることを目的としています。Honeywellスマートシティ・アクセラレーター・プログラムは、Acceleration for America(AFA)とHoneywell Inc.(Honeywell)の子会社であるHoneywell(Honeywell)とのパートナーシップです。クリーブランド(クリーブランド、オハイオ州)、ルイビル(ルイジアナ州)、カンザスシティ(ミズーリ州)、サンディエゴ(カリフォルニア州)、ウォータールー(アイオワ州)といった、米国の5都市がアクセラレーション・フォー・アメリカに参加しています。
各都市は、Honeywellとアクセラレーターの技術支援を通じて、スマートシティ戦略計画(SCP)を受け取る。各SCPは、主要な利害関係者を調整し、優先順位を設定し、気候変動への回復力、公共の安全、業務効率、サービス提供の強化などのセグメントで、住民の生活の質(QoE)を向上させる、インパクトの大きい包括的な取り組みを特定します。各都市は、特定されたプロジェクトの実施を支援する連邦補助金の申請もサポートされます。
市場を牽引するオフィスと商業施設
2022年3月現在、米国では1億4,470万平方フィートのオフィススペースが建設中で、総ストックの2.2%を占めています。注目すべきは、そのパイプラインの半分が、主要ビジネスエリア以外の都市部のサブマーケットで提供されるということです。さらに、その93%がAクラスまたはA+クラスであり、企業が労働力を確保するために引き続き質の高いプロジェクトを優先していることを示しています。
2022年3月、テキサス州オースティンでは1,000万平方フィートのオフィススペースが建設中でした。これは同市の現在のストックの11.5%に相当し、計画中のプロジェクトは25.3%と主要都市の中で最も高い割合を占めています。これは、オースティンが2021年のオフィス使用求人数の伸び(14%)と新規開拓(530万平方フィート)で他の市場を上回ったことを受けたものです。対照的に、デンバーとフェニックスでは、パンデミックとパンデミック前の大量竣工により建設が減速しました。3月には、両都市とも100万平方フィート強のオフィススペースが建設中で、総ストックの0.8%強を占めました。
米国の商業用建設産業概要
米国の商業用建設市場は断片的で競争が激しく、国内外の大手企業がこのセグメントで高い競争環境を作り出しています。しかし、このセグメントへの政府投資の増加により、中小企業にも機会が広がっています。同市場の主要企業には、Gilbane Building Company、MA Mortenson Company、Balfour Beatty LLC、Hensel Phelps Construction Co.、McCarthy Holdings Inc.、Tutor Perini Corporationなどがあります。同市場は予測期間中に成長機会を提供し、市場競争をさらに促進すると予想されます。大手企業が市場シェアの大幅な拡大を目指して他と競争しているため、産業再編のレベルは観察できないです。
その他の特典
- エクセル形式の市場予測(ME)シート
- 3ヶ月間のアナリストサポート
目次
第1章 イントロダクション
- 調査の成果
- 調査の前提
- 調査範囲
第2章 調査手法
第3章 エグゼクティブサマリー
第4章 市場力学と洞察
- 市場概要
- 市場促進要因
- 政府の取り組み
- オフィス・店舗需要
- 市場抑制要因
- 熟練労働者の不足
- サプライチェーンの問題と材料費の上昇
- 市場機会
- 新技術の利用拡大
- サプライチェーン/バリューチェーン分析へ洞察
- 産業の魅力-ポーターのファイブフォース分析
- 新規参入業者の脅威
- 買い手/消費者の交渉力
- 供給企業の交渉力
- 代替品の脅威
- 競争企業間の敵対関係の強さ
- 米国の商業用建設市場概要
- 建設コスト概要(平均コスト、オフィス・店舗、1平方フィート当たり)
- 新たに完成したオフィススペースに関する洞察(平方フィート)
- COVID-19が市場に与える影響
第5章 市場セグメンテーション
- エンドユーザー別
- オフィスビル建設
- 商業施設建設
- ホスピタリティ建設
- 施設建設
- その他
第6章 競合情勢
- 市場集中度概要
- 企業プロファイル
- Kiewit Corporation
- Hochteif Construction
- Bechtel Corporation
- Gilbane Building Company
- MA Mortenson Company
- Balfour Beatty LLC
- Hensel Phelps Construction Co.
- McCarthy Holdings Inc.
- EMCOR
- Fluor Corporation
- Skanska USA Building Inc.*
第7章 *リストは網羅的ではありません。
第8章 市場機会と今後の動向
第9章 付録
- 賃金統計へ洞察
- 企業数に関する洞察
- 財務ベンチマークと商業用建設に関する洞察
- 労働統計
- マクロ経済指標(活動別GDP分布、商業用建設の経済への貢献度)
- 産業ベンチマーク、商業用建設へ洞察
- 資本フロー洞察(商業用建設セクターへの投資)
目次
The United States Commercial Construction Market size is estimated at USD 177.27 billion in 2025, and is expected to reach USD 210.64 billion by 2030, at a CAGR of 3.51% during the forecast period (2025-2030).
Despite inflation and labor shortage, the demand for commercial real estate continues to drive the market. Furthermore, the market is driven by the huge investments pouring into infrastructure building in the country.
Key Highlights
- Overall, the commercial construction industry had a good year in 2021. Construction spending increased due to high spending in residential construction; however, the non-residential segment fell for the second year in a row. Construction firms also had to deal with ongoing labor shortages and delays in receiving building materials due to supply issues and rising material prices. Through November 2021, construction spending totaled USD 1.46 trillion, setting the year to another record-high for construction put-in-place.
- Infrastructure spending will be one of the top areas for growth in construction in 2022. With the USD 1.2 trillion Infrastructure Investment and Jobs Act, Congress finally passed a long-term infrastructure bill after years of stopgap measures and short-term spending bills. Over the next five years, the federal government will invest USD 550 billion in new infrastructure construction and repairs to existing infrastructure. The bill proposes investing USD 110 billion in roads, bridges, and infrastructure projects, USD 40 billion in bridge repairs and replacement, USD 39 billion in public transportation, USD 66 billion in passenger and freight rail, USD 65 billion in broadband internet, USD 65 billion in electric grid reconstruction, and USD 55 billion in water infrastructure.
- During the pandemic, the non-residential building market did not see a similarly dramatic increase in construction services. To be sure, some industries experienced rapid growth, such as warehouses and data centers, but these were offset by more pervasive laggards, such as office buildings and hotels. Construction, like so many other industries, was harmed by brittle supply chains and a shrinking labor force. Building material prices skyrocketed, with lumber, for example, rising as much as 264% from pre-pandemic levels at one point. Furthermore, product lead times continued to skyrocket, with three and four times the pre-pandemic rates not uncommon. To combat rising prices, the Federal Reserve has raised the federal funds rate aggressively, with four hikes in 2022 to date.
- According to the resources, inflation and lead times for certain building materials are finally easing. Construction spending in six sectors-manufacturing, highways, transportation, multifamily housing, lodging, and communications-is expected to increase by at least 5% in 2023, according to the firm. Other sectors, including healthcare, public safety, education, and commerce, are expected to grow by 0-4%. Lead times for other materials, such as architectural interiors, lumber, and plumbing, have also decreased. In the case of plumbing pipes, raw material availability has improved, production has increased, and residential construction demand has decreased.
US Commercial Construction Market Trends
The Emergence of Smart Cities is a Key Market Trend
New York City is currently ranked as the second smartest city in the world and is one of the most prominent Smart Cities. The main innovation of the city can be identified by the form of the transportation and communication linkages. In Smart Cities, the management of operations involves the integration of data and communication, as well as the utilization of the most up-to-date technologies. The development of Smart Cities leads to the creation of functional areas, such as Transportation, Traffic Management, Energy Efficiency and Sustainability, and Governance. The increasing number of Smart City projects across the United States will necessitate the construction of sophisticated road network systems, thus creating growth opportunities for vendors in the market.
For instance, in October 2022, Honeywell's Accelerator Program for Smart City Strategic Planning announced that it is partnering with Acceleration for America to help cities plan for their future and build the capacity to fund transformative initiatives. In-kind support will be provided through Honeywell's Smart Cities Accelerator Program, which is a partnership between Honeywell and Acceleration for America. The Acceleration for America program is designed to accelerate progress in cities' strategic planning efforts. The Honeywell Smart Cities Acceleration Program is a partnership between Acceleration for America (AFA) and Honeywell (Honeywell), which is a subsidiary of Honeywell Inc. (Honeywell). Five U.S cities have joined the Acceleration for America: Cleveland (Cleveland, OH); Louisville, KY; Kansas City, MO; San Diego, CA; Waterloo, and Iowa.
Each city will receive Smart City Strategic Plans (SCPs) through Honeywell's and Accelerator's technical support. Each SCP aligns key stakeholders, sets priorities, and identifies high-impact, inclusive initiatives that improve residents' quality of life (QoE) in areas like climate resilience, public safety and operational efficiency, and enhanced service delivery. Each city will also be supported in applying for Federal grants to help implement identified projects.
Office and Retail Space Driving the Market
In March 2022, 144.7 million square feet of office space were under construction in the United States, accounting for 2.2% of total stock. Notably, half of that pipeline will be provided in urban submarkets outside of key business areas. Furthermore, 93% of the space is Class A or A+, indicating that businesses are continuing to prioritize high-quality projects to retain their workforce.
In March 2022, Austin, Texas, had 10 million square feet of office space under construction. This represented 11.5% of the city's current stock, while planned projects represented 25.3%, the highest percentage among major cities. This comes after Austin outperformed all other markets in 2021 in terms of office-using job growth (14%), as well as new development (5.3 million square feet). In contrast, construction in Denver and Phoenix slowed due to the pandemic and massive pre-pandemic deliveries; between 2015 and 2021, each city added more than 16 million square feet of additional supply. In March, both cities had slightly more than 1 million square feet of office space under construction, accounting for slightly more than 0.8% of total stock.
US Commercial Construction Industry Overview
The US Commercial Construction Market is fragmented and highly competitive, with the major local and international players creating a highly competitive environment in this sector. However, the market opens opportunities for small and medium players due to increasing govt investments in the sector. Major players in the market include Gilbane Building Company, MA Mortenson Company, Balfour Beatty LLC, Hensel Phelps Construction Co., McCarthy Holdings Inc., and Tutor Perini Corporation. The market presents opportunities for growth during the forecast period, which is expected to drive market competition further. Large players competing with others for a significant increase in market share leaves the industry with no observable levels of consolidation.
Additional Benefits:
- The market estimate (ME) sheet in Excel format
- 3 months of analyst support
TABLE OF CONTENTS
1 INTRODUCTION
- 1.1 Study Deliverables
- 1.2 Study Assumptions
- 1.3 Scope of the Study
2 RESEARCH METHODOLOGY
3 EXECUTIVE SUMMARY
4 MARKET INSIGHTS AND DYNAMICS
- 4.1 Market Overview
- 4.2 Market Drivers
- 4.2.1 Government Initiatives
- 4.2.2 Demand for office and retail space
- 4.3 Market Restraints
- 4.3.1 Lack of Skilled Labor
- 4.3.2 Supply chain issues and rising material costs
- 4.4 Market Opportunities
- 4.4.1 Greater Use of New Technologies
- 4.5 Insights into Supply Chain/Value Chain Analysis
- 4.6 Industry Attractiveness - Porter's Five Forces Analysis
- 4.6.1 Threat of New Entrants
- 4.6.2 Bargaining Power of Buyers/Consumers
- 4.6.3 Bargaining Power of Suppliers
- 4.6.4 Threat of Substitute Products
- 4.6.5 Intensity of Competitive Rivalry
- 4.7 Overview of the Commercial Construction Market in the United States
- 4.8 Brief on Construction Costs (average cost, office and retail space, per sq feet)
- 4.9 Insights into the newly office space completions (sq. feet)
- 4.10 Impact of COVID-19 on the Market
5 MARKET SEGMENTATION
- 5.1 By End User
- 5.1.1 Office Building Construction
- 5.1.2 Retail Construction
- 5.1.3 Hospitality Construction
- 5.1.4 Institutional Construction
- 5.1.5 Other End Users
6 COMPETITIVE LANDSCAPE
- 6.1 Market Concentration Overview
- 6.2 Company Profiles
- 6.2.1 Kiewit Corporation
- 6.2.2 Hochteif Construction
- 6.2.3 Bechtel Corporation
- 6.2.4 Gilbane Building Company
- 6.2.5 MA Mortenson Company
- 6.2.6 Balfour Beatty LLC
- 6.2.7 Hensel Phelps Construction Co.
- 6.2.8 McCarthy Holdings Inc.
- 6.2.9 EMCOR
- 6.2.10 Fluor Corporation
- 6.2.11 Skanska USA Building Inc.*
7 *List Not Exhaustive
8 MARKET OPPORTUNITIES AND FUTURE TRENDS
9 APPENDIX
- 9.1 Insights into the Wage Statistics
- 9.2 Insights into the Number of Businesses
- 9.3 Insights into Financial Benchmarks and Commercial Construction
- 9.4 Insights into the Labor Statistics
- 9.5 Macroeconomic Indicators (GDP Distribution by Activity, Contribution of Commercial Construction to economy)
- 9.6 Insights into the Industrial Benchmarks, Commercial Construction
- 9.7 Insights into Capital Flows (Investments in the Commercial Construction Sector)
- 発行日
- 発行
- Mordor Intelligence
- ページ情報
- 英文 150 Pages
- 納期
- 2~3営業日


