
バイオPET:市場シェア分析、産業動向・統計、成長予測(2025~2030年)
Bio-PET - Market Share Analysis, Industry Trends & Statistics, Growth Forecasts (2025 - 2030)- 発行日
- ページ情報
- 英文 120 Pages
- 納期
- 2~3営業日
- 商品コード
- 1639528
- カスタマイズ可能 お客様のご希望に応じて、既存データの加工や未掲載情報(例:国別セグメント)の追加などの対応が可能です。詳細はお問い合わせください。
- 適宜更新あり 本レポートは最新情報反映のため適宜更新し、内容構成変更を行う場合があります。ご検討の際はお問い合わせください。
- 翻訳ツール提供対象 PDF対応AI翻訳ツールの無料貸し出しサービスのご利用が可能です
概要
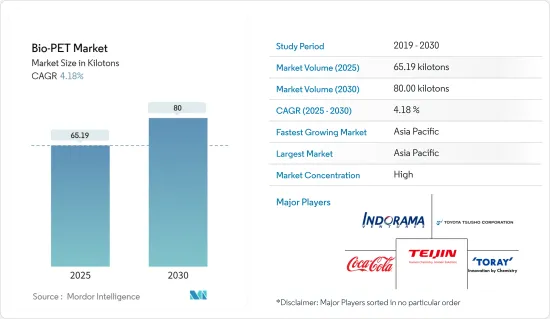
バイオPET市場規模は2025年に65.19キロトンと推定され、2030年には80.00キロトンに達すると予測され、予測期間(2025~2030年)のCAGRは4.18%です。
COVID-19の発生により、2020年には世界の封鎖、製造活動やサプライチェーンの混乱、生産停止が市場にマイナスの影響を与えました。しかし、2021年には状況が回復し始め、市場の成長軌道が回復しました。
主要ハイライト
- 温室効果ガス(GHG)排出への懸念が高まっていることが、市場を牽引する主要要因の1つです。
- しかし、PEF(ポリエチレンフラノエート)の開発とバイオPETの低融点が市場を抑制する可能性が高いです。
- パラダイムシフトを促す環境要因が、予測期間中にバイオPETの需要を押し上げる可能性が高いです。
- 再生可能な資源への注目は、今後の市場成長の機会となりそうです。
- アジア太平洋が世界市場を席巻し、北米が僅差でこれに続きます。予測期間中、アジア太平洋が最も高い成長率を示すと考えられます。
バイオPET市場動向
ボトル用途が市場を独占
- バイオPETはボトル用途に広く使用されています。化石燃料ベースの製品への依存を減らしたいという企業の意向から、その需要は世界的に急増しています。さらに、バイオベースの製品に対する消費者の需要も増加しています。
- バイオPETは、何10億もの人々に清潔な飲料水を提供することで、飲料産業の発展に貢献した包装材料です。この材料は安全性が高く、軽量で透明、リシーラブル、成形可能、100%リサイクル可能で、優れた機械的特性とバリア特性を備えています。
- バイオPETは何年も前から市場に存在しています。このプラスチックは、30%が再生可能、70%が石油ベースの原料から作られています。バイオPETの機械的特性と熱的特性は、他の石油系PET製品と類似しているため、バージンPETの理想的な代替品となっています。
- バイオPET(ポリエチレンテレフタレート)は、部分的に再生可能な原料から作られています。そのメリットは明らかです。再生可能な原料をより多く使用することで、石油由来の原料をより少なくすることができます。消費者がますます重視し、差別化を可能にするトピック。バイオPETは、ブランドオーナーが自らの立場を強調し、製品に注目を集めることを可能にします。
- 国際ボトルウォーター協会(IBWA)の報告によると、ボトル入り飲料水は米国で最も消費量の多い飲料製品です。同様の動向はアジア太平洋でも続いており、ここ数年、包装飲料水の消費が活発化しています。小規模メーカーがボトル製造のための膨大な生産能力で市場にあふれ、バイオPET市場を積極的に支えています。
- 上記の理由から、ボトル用途が市場を独占する可能性が高いです。
アジア太平洋が市場を独占する
- アジア太平洋には世界の人口の半分が住んでおり、PETボトルの消費量も多いです。
- この地域は、繊維、包装など複数の用途でバイオPETが広く受け入れられることに大きく貢献しているため、バイオPETの使用量の成長において重要な役割を果たすと予想されます。
- バイオPETの価格が高いことは、消費者のコスト意識の高さから、この地域で広く受け入れられるための障害となっています。
- 大手メーカーはバイオPETの低価格化に注力しており、低価格化の成功はバイオPETへの市場シフトに大きく影響しています。
- アジア太平洋では、ライフスタイルの変化、人々の可処分所得の増加、社会人の増加、ファーストフード志向の高まりにより、包装食品の需要が伸びています。消費者が調理済み食品を好むのは、調理に要する時間がかなり短く、新鮮で、魅力的で頑丈な包装を含むためであり、これが調査対象市場の需要を支えています。
- 中国は、一人当たり所得の増加やeコマース大手の台頭などの要因により、世界最大の包装消費国です。FMCGと包装産業の着実な成長により、中国はアジア太平洋で最も高い市場シェアを占めています。
- さらに、中国の包装産業は、拡大する経済と購買力の高い中間層の台頭により、近年急速に一貫して成長しています。食品包装は包装産業の主要企業であり、中国における総市場シェアの約60%を占めています。Interpakによると、中国では2023年に食品包装カテゴリーの総包装量が4,470億個に達すると予想されており、包装産業からの研究市場に対する需要が増加していることを示しています。
- インドの包装産業は世界第5位の規模を誇り、インドプラスチック工業協会によれば、年間約22~25%の成長率を示しています。高度に熟練した労働力と安価な人件費により、包装・加工食品のコストは欧州よりも40%低く抑えることができます。人口の増加と包装需要の増加が市場を牽引すると予想されます。
- インド包装産業協会(PIAI)によると、インドの包装産業は予測期間中に22%の成長が見込まれています。さらに、インドの包装市場は、2020~2025年にかけて26.7%のCAGRを記録し、2025年には2,048億1,000万米ドルに達すると予想されています。したがって、バイオPET市場はこの地域で成長すると予想されます。
- したがって、上記の理由から、予測期間中はアジア太平洋がバイオPET市場を独占する可能性が高いです。
バイオPET産業概要
バイオPET市場は部分的に統合されています。市場シェアの大部分は少数の参入企業に分かれています。バイオPET市場の主要企業には、THE COCA-COLA COMPANY、Indorama Ventures Public Company Limited、Toyota Tsusho Corporation、TEIJIN LIMITED、TORAY INDUSTRIES INC.などがあります(順不同)。
その他の特典
- エクセル形式の市場予測(ME)シート
- 3ヶ月間のアナリストサポート
目次
第1章 イントロダクション
- 調査の前提条件
- 調査範囲
第2章 調査手法
第3章 エグゼクティブサマリー
第4章 市場力学
- 促進要因
- パラダイムシフトを促す環境要因
- GHG(温室効果ガス)排出への懸念の高まり
- その他の促進要因
- 抑制要因
- PEF(ポリエチレンフラノエート)の開発
- 低融点が一部の用途での使用を妨げる
- 産業バリューチェーン分析
- ポーターのファイブフォース分析
- 供給企業の交渉力
- 消費者の交渉力
- 新規参入業者の脅威
- 代替品の脅威
- 競合の程度
第5章 市場セグメンテーション(市場規模(数量ベース))
- 用途
- ボトル
- 包装
- 耐久消費財
- 家具
- フィルム
- その他
- 地域
- アジア太平洋
- 中国
- インド
- 日本
- 韓国
- ASEAN諸国
- その他のアジア太平洋
- 北米
- 米国
- カナダ
- メキシコ
- 欧州
- ドイツ
- フランス
- 英国
- イタリア
- その他の欧州
- 南米
- ブラジル
- アルゼンチン
- その他の南米
- 中東・アフリカ
- サウジアラビア
- 南アフリカ
- その他の中東・アフリカ
- アジア太平洋
第6章 競合情勢
- M&A、合弁事業、提携、協定
- 市場シェア(%)**/ランキング分析
- 主要企業の戦略
- 企業プロファイル
- Toyota Tsusho Corporation
- Far Eastern New Century Corporation
- Indorama Ventures
- THE COCA-COLA COMPANY
- TORAY INDUSTRIES, INC.
- Plastipak Holdings, Inc.
- Ford Motors
- Gevo Inc.
- TEIJIN LIMITED
第7章 市場機会と今後の動向
- 再生可能エネルギーへの注目
- その他の機会
目次
The Bio-PET Market size is estimated at 65.19 kilotons in 2025, and is expected to reach 80.00 kilotons by 2030, at a CAGR of 4.18% during the forecast period (2025-2030).
Due to the COVID-19 outbreak, nationwide lockdowns worldwide, disruption in manufacturing activities and supply chains, and production halts negatively impacted the market in 2020. However, the conditions started recovering in 2021, restoring the market's growth trajectory.
Key Highlights
- One of the major factors driving the market studied is the growing GHG (Greenhouse Gases) emission concerns.
- However, the development of PEF (Polyethylene Furanoate) and a low melting point of bio PET is likely to restrain the market.
- Environmental factors encouraging a paradigm shift will likely boost the demand for Bio-PET during the forecast period.
- Focus on renewable sources is likely to act as an opportunity for market growth in the future.
- Asia-Pacific dominated the market across the world, closely followed by North America. Asia-Pacific is likely to witness the highest growth rate during the forecast period.
Bio-Based PET Market Trends
Bottles Application to Dominate the Market
- Bio-PET is widely used in bottling applications. The demand for these is increasing rapidly worldwide as companies want to reduce their dependency on fossil-fuel-based products. In addition, the demand from consumers for bio-based products is also increasing.
- Bio-PET is a packaging material that helped advance the beverage industry by providing billions of people access to clean drinking water. The material offers safety and is lightweight, transparent, resealable, moldable, and 100% recyclable, with exceptional mechanical and barrier properties.
- Bio-PET is present in the market for many years. The plastic is made from 30% renewable and 70% petroleum-based raw materials. Bio-PET's mechanical and thermal properties are similar to other oil-based PET products, thus making it an ideal replacement for virgin PET.
- Bio-based PET (polyethylene terephthalate) is made from partially renewable raw materials. The benefits are clear. By using more renewable raw materials, fewer petroleum-based raw materials are required. Topics that consumers increasingly value and allow for differentiation. Bio-PET allows brand owners to highlight their position and draw attention to their products.
- As per the International Bottled Water Association (IBWA) reports, bottled water is the most consumed beverage product in the United States in terms of volume. A similar trend is being followed in the Asian-Pacific region, where the consumption of packaged drinking water is triggered in the past few years. Small-scale manufacturers flooded the market with vast production capacities for bottle production, thus positively supporting the bio-PET market.
- The bottle application will likely dominate the market due to the abovementioned reasons.
Asia-Pacific to Dominate the Market
- The Asia-Pacific region is home to half of the population in the world, and its consumption of PET bottles is high.
- This region is expected to play a prominent role in the growth of bio-PET usage, as it massively helps the wide-scale acceptance of bio-PET in multiple applications, like textile, packaging, etc.
- The high cost of bio-PET is a deterrent to its wide acceptance in this region due to the cost-conscious nature of the consumer.
- Major manufacturers are focusing on lowering the price of bio-PET, and the success in lowering the prices massively affects the market shift toward bio-PET.
- In Asia-Pacific, the demand for packaged food is growing, owing to lifestyle changes, the growing disposable income of people, the increasing number of working professionals, and the growing preference for fast food. Consumers prefer ready-to-consume foods because they require considerably less time for cooking, are fresh, and include attractive and sturdy packaging, supporting the demand for the market studied.
- China is the world's largest packaging consumer globally owing to factors such as growing per capita income and rising e-commerce giants in the country. Due to the steady growth of its FMCG and packaging industries, China accounts for the highest market share in the Asia-Pacific region.
- Furthermore, the Chinese packaging industry grew rapidly and consistently in recent years, owing to the expanding economy and rising middle class with greater purchasing power. Food packaging is a major player in the packaging industry, accounting for roughly 60% of the total market share in China. According to Interpak, in China, total packaging in the foodstuff packaging category is expected to reach 447 billion units in 2023, indicating an increased demand for the studied market from the packaging industry.
- India's packaging industry is the fifth-largest in the world, growing at about 22-25% per year, as per the Plastics Industry Association of India. Packaging and processing food costs can be 40% lower than in Europe because of highly skilled labor and cheap labor costs. The growing population and increasing demand for packaging are expected to drive the market.
- According to the Packaging Industry Association of India (PIAI), the Indian packaging industry is expected to grow at 22% during the forecast period. Moreover, the Indian packaging market is expected to reach USD 204.81 billion by 2025, registering a CAGR of 26.7% between 2020 and 2025. Therefore, the Bio-PET market is expected to grow in the region.
- Hence, for the reasons above, Asia-Pacific will likely dominate the bio-PET market during the forecast period.
Bio-Based PET Industry Overview
The bio-PET market is partially consolidated. The majority of the market share is divided among a few players. Some of the key players in the bio-PET market include THE COCA-COLA COMPANY., Indorama Ventures Public Company Limited., Toyota Tsusho Corporation, TEIJIN LIMITED, and TORAY INDUSTRIES INC., among others (not in any particular order).
Additional Benefits:
- The market estimate (ME) sheet in Excel format
- 3 months of analyst support
TABLE OF CONTENTS
1 INTRODUCTION
- 1.1 Study Assumptions
- 1.2 Scope of the Study
2 RESEARCH METHODOLOGY
3 EXECUTIVE SUMMARY
4 MARKET DYNAMICS
- 4.1 Drivers
- 4.1.1 Environmental Factors Encouraging a Paradigm Shift
- 4.1.2 Growing GHG (Greenhouse Gases) Emission Concerns
- 4.1.3 Other Drivers
- 4.2 Restraints
- 4.2.1 Development of PEF (Polyethylene Furanoate)
- 4.2.2 Low Melting Point Hinders Usage in Some Applications
- 4.3 Industry Value Chain Analysis
- 4.4 Porter's Five Forces Analysis
- 4.4.1 Bargaining Power of Suppliers
- 4.4.2 Bargaining Power of Consumers
- 4.4.3 Threat of New Entrants
- 4.4.4 Threat of Substitute Products and Services
- 4.4.5 Degree of Competition
5 MARKET SEGMENTATION (Market Size in Volume)
- 5.1 Application
- 5.1.1 Bottles
- 5.1.2 Packaging
- 5.1.3 Consumer Durables
- 5.1.4 Furniture
- 5.1.5 Films
- 5.1.6 Other Applications
- 5.2 Geography
- 5.2.1 Asia-Pacific
- 5.2.1.1 China
- 5.2.1.2 India
- 5.2.1.3 Japan
- 5.2.1.4 South Korea
- 5.2.1.5 ASEAN Countries
- 5.2.1.6 Rest of Asia-Pacific
- 5.2.2 North America
- 5.2.2.1 United States
- 5.2.2.2 Canada
- 5.2.2.3 Mexico
- 5.2.3 Europe
- 5.2.3.1 Germany
- 5.2.3.2 France
- 5.2.3.3 United Kingdom
- 5.2.3.4 Italy
- 5.2.3.5 Rest of the Europe
- 5.2.4 South America
- 5.2.4.1 Brazil
- 5.2.4.2 Argentina
- 5.2.4.3 Rest of South America
- 5.2.5 Middle-East and Africa
- 5.2.5.1 Saudi Arabia
- 5.2.5.2 South Africa
- 5.2.5.3 Rest of Middle-East and Africa
- 5.2.1 Asia-Pacific
6 COMPETITIVE LANDSCAPE
- 6.1 Mergers and Acquisitions, Joint Ventures, Collaborations, and Agreements
- 6.2 Market Share(%)**/Ranking Analysis
- 6.3 Strategies Adopted by Leading Players
- 6.4 Company Profiles
- 6.4.1 Toyota Tsusho Corporation
- 6.4.2 Far Eastern New Century Corporation
- 6.4.3 Indorama Ventures
- 6.4.4 THE COCA-COLA COMPANY
- 6.4.5 TORAY INDUSTRIES, INC.
- 6.4.6 Plastipak Holdings, Inc.
- 6.4.7 Ford Motors
- 6.4.8 Gevo Inc.
- 6.4.9 TEIJIN LIMITED
7 MARKET OPPORTUNITIES AND FUTURE TRENDS
- 7.1 Focus toward Renewable Sources
- 7.2 Other Opportunities
- 発行日
- 発行
- Mordor Intelligence
- ページ情報
- 英文 120 Pages
- 納期
- 2~3営業日


