|
|
市場調査レポート
商品コード
1397505
バイオPETの世界市場Global Bio-PET Market |
||||||
|
|
|||||||
|
|||||||


| バイオPETの世界市場 |
|
出版日: 2023年11月23日
発行: BCC Research
ページ情報: 英文 123 Pages
納期: 即納可能
|

- 全表示
- 概要
- 図表
- 目次
世界のバイオPETの市場規模は、2023年の1億8,210万米ドルから、予測期間中は12.4%のCAGRで推移し、2028年末には3億2,660万米ドルの規模に成長すると予測されています。
地域別では、北米地域が2023年の5,010万米ドルから、12.4%のCAGRで推移し、2028年には9,010万米ドルに達すると予測されています。また、アジア太平洋地域は2023年の約8,110万米ドルから、12.9%のCAGRで推移し、2028年には1億4,850万米ドルに達すると予測されています。
当レポートでは、世界のバイオPETの市場を調査し、市場の定義・概要、市場影響因子および市場機会の分析、市場規模の推移・予測、各種区分・地域別の詳細分析、技術開発の動向、ESGの展開、競合情勢、主要企業のプロファイルなどをまとめています。
目次
第1章 イントロダクション
第2章 サマリー・ハイライト
- 市場の見通し
- 市場サマリー
第3章 市場概要
- バイオPET:イントロダクション
- 従来のPETとバイオPETの比較
第4章 市場力学
- 市場促進要因・抑制要因
- 市場促進要因
- 市場の課題
- サプライチェーン分析
- 規制状況
- COVID-19の影響
- 価格の概要
- ポーターのファイブフォース分析
第5章 新興技術
- 技術動向
- 硬質食品包装の最近の開発
- バイオPETの製造技術
- 包装における技術の進歩
- 食品・飲料包装業界におけるナノテクノロジー
- 新製品・新技術の開発
第6章 市場内訳:用途別
- 世界のバイオPET市場:用途別
- 包装
- 消費財
- 自動車
- その他
第7章 市場内訳:地域別
- 世界のバイオPET市場:地域別
- 北米
- 市場規模・予測
- 米国
- カナダ
- 欧州
- 市場規模・予測
- ドイツ
- 英国
- フランス
- イタリア
- スペイン
- ロシア
- その他の欧州
- アジア太平洋
- 市場規模・予測
- 中国
- インド
- 日本
- 東南アジア
- その他のアジア太平洋
- ラテンアメリカ
- 市場規模・予測
- ブラジル
- メキシコ
- その他のラテンアメリカ
- 中東・アフリカ
- 市場規模・予測
- GCC諸国
- 南アフリカ
- その他の中東・アフリカ
第8章 バイオPET産業の持続可能性:ESGの観点
- バイオPET業界におけるESGの重要性
- ESG評価と指標:データの理解
- バイオPET業界におけるESGの実践
- ESGカーボンフットプリント問題の分析
- バイオPET市場におけるESGの現状
- ケーススタディ:ESG導入の成功例
- ESGの未来:新たな動向と機会
- BCCによる総論
第9章 M&A
第10章 競合情勢
- 市場競争力
- 参入企業の位置付け
第11章 企業プロファイル
- AMCOR PLC
- FAR EASTERN NEW CENTURY CORP.
- FKUR
- IWATANI CORP.
- NESTE OYJ
- PLASTIPAK HOLDINGS INC.
- TEIJIN LTD.
- TORAY INDUSTRIES INC.
第12章 付録:頭字語
List of Tables
- Summary Table : Global Market for Bio-PET, by Region, Through 2028
- Table 1 : New Product and Technology Development in Global Bio-PET Market, 2022-2023
- Table 2 : Global Market Volumes of Bio-PET, by Application, Through 2028
- Table 3 : Global Market for Bio-PET, by Application, Through 2028
- Table 4 : Global Market Volumes of Bio-PET in Packing Applications, by Region, Through 2028
- Table 5 : Global Market for Bio-PET in Packing Applications, by Region, Through 2028
- Table 6 : Global Market Volumes of Bio-PET in Consumer Goods Applications, by Region, Through 2028
- Table 7 : Global Market for Bio-PET in Consumer Goods Applications, by Region, Through 2028
- Table 8 : Global Market Volumes of Bio-PET in Automotive Applications, by Region, Through 2028
- Table 9 : Global Market for Bio-PET in Automotive Applications, by Region, Through 2028
- Table 10 : Global Market Volumes of Bio-PET in Other Applications, by Region, Through 2028
- Table 11 : Global Market for Bio-PET in Other Applications, by Region, Through 2028
- Table 12 : Global Market Volumes of Bio-PET, by Region, Through 2028
- Table 13 : Global Market for Bio-PET, by Region, Through 2028
- Table 14 : North American Market Volumes of Bio-PET, by Application, Through 2028
- Table 15 : North American Market for Bio-PET, by Application, Through 2028
- Table 16 : U.S. Market Volumes of Bio-PET, by Application, Through 2028
- Table 17 : U.S. Market for Bio-PET, by Application, Through 2028
- Table 18 : Canadian Market Volumes of Bio-PET, by Application, Through 2028
- Table 19 : Canadian Market for Bio-PET, by Application, Through 2028
- Table 20 : European Market Volumes of Bio-PET, by Application, Through 2028
- Table 21 : European Market for Bio-PET, by Application, Through 2028
- Table 22 : German Market Volumes of Bio-PET, by Application, Through 2028
- Table 23 : German Market for Bio-PET, by Application, Through 2028
- Table 24 : U.K. Market Volumes of Bio-PET, by Application, Through 2028
- Table 25 : U.K. Market for Bio-PET, by Application, Through 2028
- Table 26 : French Market Volumes of Bio-PET, by Application, Through 2028
- Table 27 : French Market for Bio-PET, by Application, Through 2028
- Table 28 : Italian Market Volumes of Bio-PET, by Application, Through 2028
- Table 29 : Italian Market for Bio-PET, by Application, Through 2028
- Table 30 : Spanish Market Volumes of Bio-PET, by Application, Through 2028
- Table 31 : Spanish Market for Bio-PET, by Application, Through 2028
- Table 32 : Russian Market Volumes of Bio-PET, by Application, Through 2028
- Table 33 : Russian Market for Bio-PET, by Application, Through 2028
- Table 34 : Rest of European Market Volumes of Bio-PET, by Application, Through 2028
- Table 35 : Rest of European Market for Bio-PET, by Application, Through 2028
- Table 36 : Asia-Pacific Market Volumes of Bio-PET, by Application, Through 2028
- Table 37 : Asia-Pacific Market for Bio-PET, by Application, Through 2028
- Table 38 : Chinese Market Volumes of Bio-PET, by Application, Through 2028
- Table 39 : Chinese Market for Bio-PET, by Application, Through 2028
- Table 40 : Indian Market Volumes of Bio-PET, by Application, Through 2028
- Table 41 : Indian Market for Bio-PET, by Application, Through 2028
- Table 42 : Japanese Market Volumes of Bio-PET, by Application, Through 2028
- Table 43 : Japanese Market for Bio-PET, by Application, Through 2028
- Table 44 : Southeast Asian Market Volumes of Bio-PET, by Application, Through 2028
- Table 45 : Southeast Asian Market for Bio-PET, by Application, Through 2028
- Table 46 : Rest of Asia-Pacific Market Volumes of Bio-PET, by Application, Through 2028
- Table 47 : Rest of Asia-Pacific Market for Bio-PET, by Application, Through 2028
- Table 48 : Latin American Market Volumes of Bio-PET, by Application, Through 2028
- Table 49 : Latin American Market for Bio-PET, by Application, Through 2028
- Table 50 : Brazilian Market Volumes of Bio-PET, by Application, Through 2028
- Table 51 : Brazilian Market for Bio-PET, by Application, Through 2028
- Table 52 : Mexican Market Volumes of Bio-PET, by Application, Through 2028
- Table 53 : Mexican Market for Bio-PET, by Application, Through 2028
- Table 54 : Rest of Latin American Market Volumes of Bio-PET, by Application, Through 2028
- Table 55 : Rest of Latin American Market for Bio-PET, by Application, Through 2028
- Table 56 : MEA Market Volumes of Bio-PET, by Application, Through 2028
- Table 57 : MEA Market for Bio-PET, by Application, Through 2028
- Table 58 : GCC Countries Market Volumes of Bio-PET, by Application, Through 2028
- Table 59 : GCC Countries Market for Bio-PET, by Application, Through 2028
- Table 60 : South African Market Volumes of Bio-PET, by Application, Through 2028
- Table 61 : South African Market for Bio-PET, by Application, Through 2028
- Table 62 : Rest of the MEA Market Volumes of Bio-PET, by Application, Through 2028
- Table 63 : Rest of the MEA Market for Bio-PET, by Application, Through 2028
- Table 64 : ESG Factors Impacting Bio-PET Market
- Table 65 : ESG Carbon Footprint Issue Analysis
- Table 66 : ESG Ratings, by Bio-PET Company
- Table 67 : Neste Sustainability Highlights, 2022
- Table 68 : Mergers and Acquisitions, 2023
- Table 69 : Amcor plc: Annual Revenue, 2023
- Table 70 : Amcor plc: Bio-PET Product Portfolio
- Table 71 : Far Eastern New Century Corp.: Annual Revenue, 2022
- Table 72 : Far Eastern New Century Corp.: News, 2019-2022
- Table 73 : Far Eastern New Century Corp.: Bio-PET Product Portfolio
- Table 74 : Diamond Green Diesel: Bio-PET Product Portfolio
- Table 75 : Iwatani Corp.: Annual Revenue, 2022
- Table 76 : Iwatani Corp.: Bio-PET Product Portfolio
- Table 77 : Neste Oyj: Annual Revenue, 2022
- Table 78 : Neste Oyj: News, 2022-2023
- Table 79 : Neste Oyj: Bio-PET Product Portfolio
- Table 80 : Plastipak Holdings Inc.: News, 2023
- Table 81 : Plastipak Holdings Inc.: Bio-PET Product Portfolio
- Table 82 : Teijin Ltd.: Annual Revenue, 2022
- Table 83 : Teijin Ltd.: Bio-PET Product Portfolio
- Table 84 : Toray Industries Inc.: Annual Revenue, 2022
- Table 85 : Toray Industries Inc.: News, 2022
- Table 86 : Toray Industries Inc.: Bio-PET Product Portfolio
- Table 87 : Acronym Used in This Report
List of Figures
- Summary Figure : Global Market Shares of Bio-PET, by Region, 2022
- Figure 1 : Bio-PET Production Flow
- Figure 2 : Market Dynamics: Drivers and Challenges
- Figure 3 : Global Production Capacities of Bioplastics, 2017-2023
- Figure 4 : Supply Chain Partners Ecosystem: Bio-PET
- Figure 5 : Bio-based PET Price, by Region, 2022-2028
- Figure 6 : Porter's Five Forces Analysis: Global Bio-PET Market
- Figure 7 : Global Market Shares of Bio-PET, by Application, 2022
- Figure 8 : Global Market Shares of Bio-PET in Packing Applications, by Region, 2022
- Figure 9 : Global Market Shares of Bio-PET in Consumer Goods Applications, by Region, 2022
- Figure 10 : Global Market Shares of Bio-PET in Automotive Applications, by Region, 2022
- Figure 11 : Global Market Shares of Bio-PET in Other Applications, by Region, 2022
- Figure 12 : Global Market for Bio-PET, by Region
- Figure 13 : Global Market Shares of Bio-PET, by Region, 2022
- Figure 14 : North American Market Shares of Bio-PET, by Application, 2022
- Figure 15 : U.S. Market Shares of Bio-PET, by Application, 2022
- Figure 16 : Canadian Market Shares of Bio-PET, by Application, 2022
- Figure 17 : European Market Shares of Bio-PET, by Application, 2022
- Figure 18 : German Market Shares of Bio-PET, by Application, 2022
- Figure 19 : U.K. Market Shares of Bio-PET, by Application, 2022
- Figure 20 : French Market Shares of Bio-PET, by Application, 2022
- Figure 21 : Italian Market Shares of Bio-PET, by Application, 2022
- Figure 22 : Spanish Market Shares of Bio-PET, by Application, 2022
- Figure 23 : Russian Market Shares of Bio-PET, by Application, 2022
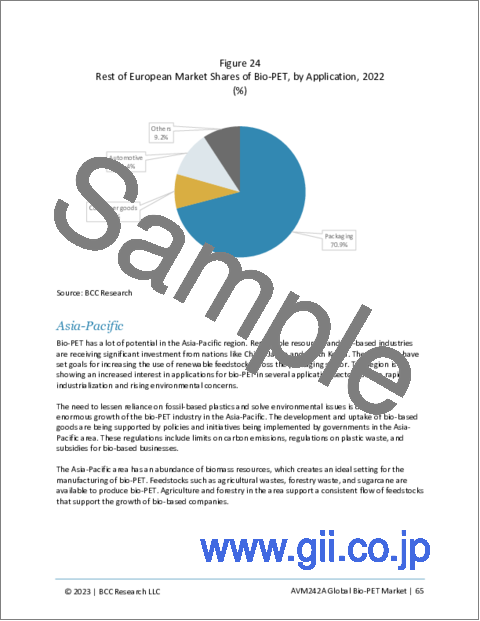
- Figure 24 : Rest of European Market Shares of Bio-PET, by Application, 2022
- Figure 25 : Asia-Pacific Market Shares of Bio-PET, by Application, 2022
- Figure 26 : Chinese Market Shares of Bio-PET, by Application, 2022
- Figure 27 : Indian Market Shares of Bio-PET, by Application, 2022
- Figure 28 : Japanese Market Shares of Bio-PET, by Application, 2022
- Figure 29 : Southeast Asian Market Shares of Bio-PET, by Application, 2022
- Figure 30 : Rest of Asia-Pacific Market Shares of Bio-PET, by Application, 2022
- Figure 31 : Latin American Market Shares of Bio-PET, by Application, 2022
- Figure 32 : Brazilian Market Shares of Bio-PET, by Application, 2022
- Figure 33 : Mexican Market Shares of Bio-PET, by Application, 2022
- Figure 34 : Rest of Latin American Market Shares of Bio-PET, by Application, 2022
- Figure 35 : MEA Market Shares of Bio-PET, by Application, 2022
- Figure 36 : GCC Countries Market Shares of Bio-PET, by Application, 2022
- Figure 37 : South African Market Shares of Bio-PET, by Application, 2022
- Figure 38 : Rest of the MEA Market Shares of Bio-PET, by Application, 2022
- Figure 39 : ESG Factors in Bio-PET Market
- Figure 40 : Shares of Mergers and Acquisitions in the Global Bio-PET Market, by Region, 2023
- Figure 41 : Market Entry Strategies: Suggestions for Small and Medium-Sized Players
- Figure 42 : Market Player Positioning
- Figure 43 : Amcor plc: Annual Revenue, 2022 and 2023
- Figure 44 : Amcor plc: Revenue Share, by Business Segment, 2022
- Figure 45 : Amcor plc: Revenue Share, by Country/Region, 2022
- Figure 46 : Far Eastern New Century Corp.: Annual Revenue, 2021 and 2022
- Figure 47 : Far Eastern New Century Corp.: Revenue Share, by Business Segment, 2022
- Figure 48 : Far Eastern New Century Corp.: Revenue Share, by Country/Region, 2022
- Figure 49 : Iwatani Corp.: Annual Revenue, 2021 and 2022
- Figure 50 : Iwatani Corp.: Revenue Share, by Business Segment, 2022
- Figure 51 : Neste Oyj: Annual Revenue, 2021 and 2022
- Figure 52 : Neste Oyj: Revenue Share, by Business Segment, 2022
- Figure 53 : Neste Oyj: Revenue Share, by Country/Region, 2022
- Figure 54 : Neste Oyj: Renewable Product Segment Revenue Share, by Country/Region, 2022
- Figure 55 : Teijin Ltd.: Annual Revenue, 2021 and 2022
- Figure 56 : Toray Industries Inc.: Annual Revenue, 2021 and 2022
Highlights:
The global market for bio-PET is expected to grow from $182.1 million in 2023 to $326.6 million by 2028, at a compound annual growth rate (CAGR) of 12.4% from 2023 to 2028.
The North American market for bio-PET is expected to grow from $50.1 million in 2023 to $90.1 million by 2028, at a CAGR of 12.4% from 2023 to 2028.
The Asia-Pacific market for bio-PET is expected to grow from nearly $81.1 million in 2023 to $148.5 million by 2028, at a CAGR of 12.9% from 2023 to 2028.
Report Scope:
This report analyzes the global bio-PET market based on segmentation of application. These segmentations are further analyzed at the global and regional levels.
The base year considered for analysis is 2022, and the market estimates and forecasts are given from 2023 to 2028. The market estimates are provided in terms of volume (kilotons) and revenue (U.S. dollars, thousand).
The scope for the bio-PET market is segmented based on application into -
- Packaging.
Bottle.
Pouch and bag.
Other packaging.
- Consumer goods.
- Automotive.
- Others.
Report Includes:
- 69 data tables and 19 additional tables
- An overview of the global bio-PET market
- In-depth analysis of market trends, featuring historical revenue data for 2022, estimated figures for 2023, as well as forecasts for 2024 and 2028. This analysis includes projections of compound annual growth rates (CAGRs) through 2028
- Evaluations of the current market size and revenue growth prospects for the bio-PET market, accompanied by an analysis of market share by application and geographic region
- Analyses of the market's dynamics, including growth drivers, inhibitors and opportunities, and insights into the regulatory environment
- A comparative assessment of conventional PET vs. bio-PET; and discussions of recent developments in rigid food packaging, production technology for bio-PET production, technological advances in packaging, and nanotechnology in the food and beverage packaging industry
- Information on the Coca-Cola Co.'s initiative in commercializing PET beverage bottles and the major steps taken towards the use of renewable plant materials
- An examination of ESG developments, relevant patents; M&A, venture funding and emerging technologies in the bio-PET market
- Profiles of leading market participants
Table of Contents
Chapter 1 Introduction
- Study Goals and Objectives
- Reasons for Doing This Study
- Scope of Report
- Information Sources
- Research Methodology
- Geographic Breakdown
- Segmentation Breakdown
Chapter 2 Summary and Highlights
- Market Outlook
- Market Summary
Chapter 3 Market Overview
- Introduction to Bio-PET
- Conventional PET Vs. Bio-PET
Chapter 4 Market Dynamics
- Market Drivers and Restraints
- Market Drivers
- Market Challenges
- Supply Chain Analysis
- Regulatory Landscape
- COVID-19 Impact
- Pricing Overview
- Porter's Five Forces Analysis
Chapter 5 Emerging Technologies
- Technology Trends
- Recent Development in Rigid Food Packaging
- Production Technology for Bio-PET Production
- Technological Advancements in Packaging
- Nanotechnology in the Food and Beverage Packaging Industry
- New Product and Technology Development
Chapter 6 Market Breakdown by Application
- Global Bio-PET Market, by Application
- Packaging
- Consumer Goods
- Automotive
- Other Applications
Chapter 7 Market Breakdown by Region
- Global Bio-PET Market, by Region
- North America
- Market Size and Forecast
- U.S.
- Canada
- Europe
- Market Size and Forecast
- Germany
- U.K.
- France
- Italy
- Spain
- Russia
- Rest of Europe
- Asia-Pacific
- Market Size and Forecast
- China
- India
- Japan
- Southeast Asia
- Rest of Asia-Pacific
- Latin America
- Market Size and Forecast
- Brazil
- Mexico
- Rest of Latin America
- Middle East and Africa
- Market Size and Forecast
- GCC Countries
- South Africa
- Rest of the Middle East and Africa
Chapter 8 Sustainability in the Bio-PET Industry: An ESG Perspective
- Importance of ESG in the Bio-PET Industry
- ESG Ratings and Metrics: Understanding the Data
- ESG Practices in the Bio-PET Industry
- ESG Carbon Footprint Issue Analysis
- Current Status of ESG in the Bio-PET Market
- Case Studies: Examples of Successful ESG Implementation
- Future of ESG: Emerging Trends and Opportunities
- Concluding Remarks from BCC Research
Chapter 9 Mergers and Acquisitions
- Merger and Acquisitions
- Merger and Acquisition Activities
Chapter 10 Competitive Landscape
- Market Competitiveness
- Market Player Positioning
Chapter 11 Company Profiles
- AMCOR PLC
- FAR EASTERN NEW CENTURY CORP.
- FKUR
- IWATANI CORP.
- NESTE OYJ
- PLASTIPAK HOLDINGS INC.
- TEIJIN LTD.
- TORAY INDUSTRIES INC.
Chapter 12 Appendix: Acronyms
- Acronyms
