
|
市場調査レポート
商品コード
1636261
アジア太平洋地域のコンテナドレージ:市場シェア分析、産業動向、成長予測(2025年~2030年)Asia-Pacific Container Drayage - Market Share Analysis, Industry Trends & Statistics, Growth Forecasts (2025 - 2030) |
||||||
カスタマイズ可能
適宜更新あり
|
|||||||
| アジア太平洋地域のコンテナドレージ:市場シェア分析、産業動向、成長予測(2025年~2030年) |
|
出版日: 2025年01月05日
発行: Mordor Intelligence
ページ情報: 英文 150 Pages
納期: 2~3営業日
|

全表示
- 概要
- 目次
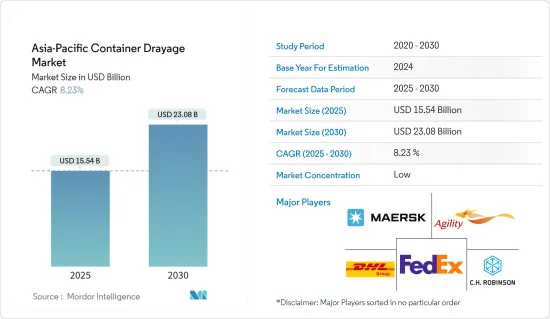
アジア太平洋地域のコンテナドレージ市場規模は、2025年に155億4,000万米ドルと推定され、予測期間中(2025年~2030年)のCAGRは8.23%で、2030年には230億8,000万米ドルに達すると予測されています。
主なハイライト
- アジア太平洋地域のコンテナドレージ市場は、急速な貿易活動による輸送用コンテナ需要の急増が主因となっています。アジア太平洋地域は、広大な海岸線と中国を中心とする製造業者の集中により、コンテナ需要の高まりが見られます。さらに、地域諸国の政府がイニシアチブを強化し、インドやインドネシアのような未開拓市場が有望であることから、将来の市場成長も期待できそうです。
- 世界の上位25港のうち18港がアジアにあり、アジア諸国は貨物取り扱いにおける優位性を維持しています。このデータは、世界銀行とS&P世界・マーケット・インテリジェンスによるコンテナ港湾パフォーマンス指数(CPPI)から得られたもので、東アジアがこれらの上位港湾のうち11港を誇っているのに対し、西アジアは4港を擁していることが明らかになっています。
- 2023年第2四半期の世界の接続状況は、中国を筆頭にアジア経済が席巻しました。韓国、シンガポール、マレーシアがこれに続いた。これらの国の定期船接続性指数(LSCI)はそれぞれ、前年比で3%から5%上昇し、指数値は過去最高を記録しました。
- 2023年には、中国は、その旺盛な商品需要と海上貿易への大きな依存に支えられ、アジア太平洋の海運コンテナ市場を独占しました。貨物輸送需要の急増や貿易協定の締結といった要因が市場を押し上げる一方で、輸送コストや在庫コストの変動が課題となっています。しかし、海上輸送の自動化動向や安全基準の強化がさらなる機会を提供し、市場は成長態勢にあります。
アジア太平洋地域のコンテナドレージ市場の動向
アジアの主要ハブ港の混雑緩和、コンテナドレージ需要の急増が輸送セグメントを牽引
- 2024年6月までに、北アジアと東南アジアの主要港では船舶の遅延が顕著に減少し、中国でも設備の稼働率が上昇しています。しかし、海運業者やフォワーダーからの報告では、インドで混雑が深刻化していることが浮き彫りになっています。アジア各地の海運業界幹部は、シンガポール、寧波、青島、マレーシアのクランなどの港湾で船舶の遅延が減少している一方で、コンテナドレージの需要が増加していることを強調しています。
- シンガポールの混雑は若干緩和されたもの、輸送業者はクラン港やタンジュン・ペレパス港といったマレーシアの港を利用するようになっています。特にタンジュン・ペレパスは、シンガポールからの転用もあり、2024年上半期のコンテナ取扱量が20%急増しました。同様に、クランのノースポートでは、2024年5月のコンテナ取扱量が前年比26%増の33万5,361TEUとなった。
- シンガポールの待ち時間は2~3日と緩やかな改善が見られるもの、待ち時間は短縮されたとはいえ、船会社やサービスによって大きく異なります。特筆すべきは、シンガポールでの深刻な混雑が主な原因となったアジア太平洋1便の遅延です。2024年5月末までの遅延はピークで8日間だったが、その後、一部のFP1航路では最大5日間まで短縮されました。
- その他では、ハパッグ・ロイド社によると、2024年4月末には最大3日かかっていた待ち時間が、寧波では2日、青島では24時間以内に短縮されました。シンガポールのデータは、停泊待ちの船舶が2024年6月15日の350,281TEUから6月末までに286,778TEUに減少したことを示し、改善を示しています。しかし、停泊待ちの総船腹量は2024年5月上旬から増加しています。
- 中国の設備稼働率は、大連港や台湾港のような20フィートコンテナ向けの港を中心に改善の兆しを見せているが、中国中部、特に武漢のような地域では依然として逼迫感が目立っています。一方、インドの主要なコンテナゲートウェイであるムンドラは、積み替え量の増加によるプレッシャーの高まりに悩まされています。シンガポールとドバイの間を航行する一部の航空会社は、他のアジアの港を優先するため、ムンドラでの運航を縮小しています。
- 最近の貿易最新情報では、混雑したコンテナヤードでの輸入通関の遅れが原因で、ムンドラでのコンテナ滞留時間が大幅に長くなっていることが明らかになっています。インドのコンテナ鉄道事業者(CTO)は、列車のターンアラウンドの混乱が輸入業者の追加料金につながっているとして、ムンドラ港を非難しています。CTOの情報筋によると、レール貨物のヤードの滞留日数は通常の7~9日から倍増し、現在では平均15~20日となっています。特に、ムンドラの輸送量の約半分は鉄道輸送です。
- 事態が深刻化するなか、コンテナ・トレイン・オペレーター協会は、港湾当局による不可抗力宣言の可能性を示唆しています。同時に、コンテナ船社協会(インド)は、貨物の流れをスムーズにするため、港に迅速な対応を求めています。
中国貿易需要の急増が市場を牽引
- 米国小売在庫と売上高の伸び:2024年1月から4月にかけて、米国の小売在庫は7,693億米ドルから着実に増加し、7,935億米ドルに達しました。特に、自動車や建材などのセクターで顕著な上昇が見られました。
- 小売売上高の継続的成長:2024年5月の米国小売売上高は、前月比0.1%増、前年比2.3%増となった。自動車ディーラー、ガソリンスタンド、レストランを除いたコア小売売上高は、前月比0.3%増、前年比2.9%増となった。これらの数値は、NRFが予測する2024年の成長率2.5%から3.5%に近いです。
- 米国の小売在庫、特に自動車と建築資材業界の在庫の急増は、コンテナドレージサービスに対する旺盛な需要を示しています。この上昇は、極めて重要な製造拠点である中国からのコンテナドレージの必要性を高める。
- 中国の港湾は前年同期比9%の急増を記録し、2024年の最初の4ヵ月間に1億403万TEUという驚異的な処理量を記録しました。同時に、対外貿易貨物は前年同期比9.1%増となった。
- 特筆すべきは全体の貨物処理量で、2024年には55億5,000万トンを記録し、前年の数値から5.2%増加しました。
アジア太平洋地域のコンテナドレージ業界の概要
アジア太平洋地域のコンテナドレージ市場は断片化されています。この市場の主要企業には、マースク・アジア・パシフィック、アジリティ、C Hロビンソン・ワールドワイド・インク、フェデックス・コーポレーション、ドイツポストDHLグループなどが含まれます。
主要企業は競争力を維持するため、さまざまな戦略分野に注力しています。業務プロセスのデジタルトランスフォーメーションと自動化は、効率性の向上と業務コストの削減のためにますます重視されています。
その他の特典
- エクセル形式の市場予測(ME)シート
- 3ヶ月間のアナリストサポート
目次
第1章 イントロダクション
- 調査の成果
- 調査の前提
- 調査範囲
第2章 調査手法
第3章 エグゼクティブサマリー
第4章 市場力学と洞察
- 現在の市場シナリオ
- 市場力学
- 促進要因
- 鉄道取引の増加
- eコマース分野の成長
- 抑制要因
- 港湾の混雑による貨物の集配遅延
- 回避可能なコスト発生のリスク
- 機会
- 市場を牽引する技術の進歩
- 促進要因
- 業界の魅力- ポーターのファイブフォース分析
- 新規参入業者の脅威
- 買い手/消費者の交渉力
- 供給企業の交渉力
- 代替品の脅威
- 競争企業間の敵対関係
- バリューチェーン/サプライチェーン分析
- 業界の規制と政策への洞察
- 技術統合に関する洞察
- アジア太平洋のeコマース産業に関する洞察
- アジア太平洋コンテナデータ概要
- スポットライト-貨物輸送コスト/運賃
- COVID-19が市場に与える影響
第5章 市場セグメンテーション
- 輸送モード別
- 鉄道
- 道路
- その他の輸送モード
- 地域別
- 中国
- 日本
- インド
- 韓国
- インドネシア
- ベトナム
- オーストラリア
- その他アジア太平洋地域
第6章 競合情勢
- 市場集中度の概要
- 企業プロファイル
- Maersk Asia Pacific
- Agility
- C H Robinson Worldwide Inc.
- FedEx Corp.
- Deutsche Post DHL Group
- Hitachi Ltd
- CMA CGM SA Group
- DB Schenker
- United Parcel Services Inc.
- Ceva Logistics
- Yusen Logistics Co. Ltd*
- その他の企業
第7章 市場の将来展望
第8章 付録
- マクロ経済指標
- 資本フローの洞察(輸送・貯蔵部門への投資)
- 対外貿易統計
The Asia-Pacific Container Drayage Market size is estimated at USD 15.54 billion in 2025, and is expected to reach USD 23.08 billion by 2030, at a CAGR of 8.23% during the forecast period (2025-2030).
Key Highlights
- The Asia-Pacific container drayage market is mainly driven by the surge in demand for shipping containers due to rapid trade activities. Asia-Pacific, bolstered by its expansive coastal lines and a concentration of manufacturers, particularly in China, is witnessing heightened demand for these containers. Moreover, as governments in regional countries ramp up initiatives and untapped markets like India and Indonesia show promise, future market growth looks promising.
- Asian countries maintain their dominance in cargo handling, with 18 of the top 25 global ports located in Asia. This data, sourced from the Container Port Performance Index (CPPI) by the World Bank and S&P Global Market Intelligence, highlights that Eastern Asia boasts 11 of these top ports, while Western Asia hosts four.
- Asian economies dominated the global connectivity landscape in Q2 2023, with China leading the market. The Republic of Korea, Singapore, and Malaysia followed closely. Each of these nations saw their Liner Shipping Connectivity Index (LSCI) rise by 3% to 5% compared to the previous year, hitting all-time highs in their index values.
- In 2023, China dominated the Asia-Pacific shipping container market, underpinned by its robust demand for commodities and heavy reliance on seaborne trade. While factors like a surge in cargo transportation demand and trade agreements bolster the market, fluctuations in transportation and inventory costs pose challenges. However, the market is poised for growth, with automation trends in marine transportation and heightened safety norms offering further opportunities.
Asia-Pacific Container Drayage Market Trends
Port Congestion Easing in Key Asian Hubs, Surge in Demand for Container Drayage Driving the Transportation Segment
- By June 2024, major ports in North and Southeast Asia have seen a notable drop in vessel delays, with China also marking an uptick in equipment availability. However, reports from ocean carriers and forwarders underscore a mounting congestion challenge in India. Executives in the shipping industry across Asia have highlighted that while ports like Singapore, Ningbo, Qingdao, and Klang in Malaysia are witnessing fewer vessel delays, the demand for container drayages is on the rise.
- Although congestion in Singapore has slightly alleviated, carriers are increasingly turning to Malaysian ports like Klang and Tanjung Pelepas. Tanjung Pelepas, in particular, saw a 20% surge in container volumes in the first half of 2024, partly due to diversions from Singapore. Similarly, Northport in Klang recorded a notable 26% uptick in container volumes in May 2024, reaching 335,361 TEUs compared to the previous year, largely fueled by ad-hoc carrier calls.
- While there has been a modest improvement in wait times in Singapore, ranging from two to three days, the wait times, though reduced, still vary significantly based on the carrier and service. Notably, research highlighted delays in the Asia-Europe Far East Pacific 1 service, primarily due to severe congestion in Singapore. Although delays peaked at eight days by the end of May 2024, they have since reduced to a maximum of five days on some FP1 sailings.
- Elsewhere, Hapag-Lloyd reported that wait times had decreased to two days in Ningbo and less than 24 hours in Qingdao, compared to up to three days at the end of April 2024. Data indicates an improvement in Singapore, with vessels waiting at anchorage dropping from 350,281 TEUs on June 15, 2024, to 286,778 TEUs by the end of June. However, the total capacity waiting to berth has seen an uptick since early May 2024.
- While equipment availability in China has shown signs of improvement, especially in ports like Dalian and Taiwanese ports for 20-foot containers, there is still a noticeable tightness in central China, particularly in areas like Wuhan. On the other hand, Mundra, India's primary container gateway, is grappling with mounting pressure from escalating transshipment volumes. Some carriers plying between Singapore and Dubai have curtailed sailings at Mundra to prioritize other Asian ports.
- Recent trade updates underscore that container dwell times at Mundra have significantly lengthened, attributed to sluggish import clearance in congested container yards. Indian container rail operators (CTOs) are pointing fingers at the port for train turnaround disruptions, leading to additional charges for importers. CTO sources reveal that yard backlogs for railed freight have doubled, now averaging 15 to 20 days, up from the usual seven to nine days. Notably, approximately half of Mundra's traffic is rail-bound.
- With the circumstances escalating, the Association of Container Train Operators has hinted at a potential force majeure declaration from the port authority. Simultaneously, the Container Shipping Lines Association (India) is urging swift action from the port to smoothen cargo flows.
Surge in Demand for Trade in China Driving the Market
- US Retail Inventories and Sales Growth: From January to April 2024, US retail inventories climbed steadily, starting at USD 769.3 billion and reaching USD 793.5 billion. Notably, sectors like motor vehicles and building materials saw pronounced upticks.
- Continued Retail Sales Growth: In May 2024, retail sales in the United States inched up by 0.1% from the previous month and 2.3% from the prior year. Core retail sales, which exclude automobile dealers, gasoline stations, and restaurants, saw a 0.3% monthly increase and a 2.9% yearly rise. These figures closely mirror the NRF's projected 2.5% to 3.5% growth for 2024.
- The surge in US retail inventories, especially in motor vehicles and building materials industries, signals a robust demand for container shipping services. This uptick is poised to drive an increased necessity for container shipments from China, a pivotal manufacturing hub.
- China's ports, recording a 9% Y-o-Y surge, processed a staggering 104.03 million TEUs in the initial four months of 2024. Simultaneously, foreign trade cargo saw a 9.1% Y-o-Y upswing.
- Noteworthy is the overall cargo throughput, which hit 5.55 billion tonnes in 2024, marking a 5.2% uptick from the preceding year's figures.
Asia-Pacific Container Drayage Industry Overview
The Asia-Pacific container drayage market is fragmented. Key players in this market include Maersk Asia Pacific, Agility, C H Robinson Worldwide Inc., FedEx Corp., and Deutsche Post DHL Group.
The leading companies are focusing on various strategic areas to maintain their competitive edge. Digital transformation and automation in operational processes are increasingly emphasized to improve efficiency and reduce operational costs.
Additional Benefits:
- The market estimate (ME) sheet in Excel format
- 3 months of analyst support
TABLE OF CONTENTS
1 INTRODUCTION
- 1.1 Study Deliverables
- 1.2 Study Assumptions
- 1.3 Scope of the Study
2 RESEARCH METHODOLOGY
3 EXECUTIVE SUMMARY
4 MARKET DYNAMICS AND INSIGHTS
- 4.1 Current Market Scenario
- 4.2 Market Dynamics
- 4.2.1 Drivers
- 4.2.1.1 Increasing Railway Trade
- 4.2.1.2 Growing E-commerce Sector
- 4.2.2 Restraints
- 4.2.2.1 Port Congestion Delaying Cargo Pick-up and Delivery
- 4.2.2.2 Risk of Incurring Avoidable Costs
- 4.2.3 Opportunities
- 4.2.3.1 Technological Advancements Driving the Market
- 4.2.1 Drivers
- 4.3 Industry Attractiveness - Porter's Five Forces Analysis
- 4.3.1 Threat of New Entrants
- 4.3.2 Bargaining Power of Buyers/Consumers
- 4.3.3 Bargaining Power of Suppliers
- 4.3.4 Threat of Substitute Products
- 4.3.5 Intensity of Competitive Rivalry
- 4.4 Value Chain/Supply Chain Analysis
- 4.5 Insights into Industry Policies and Regulations
- 4.6 Insights into Technological Integration
- 4.7 Insights into E-commerce Industry in Asia-Pacific
- 4.8 Brief on Asia-Pacific Container Datapoints
- 4.9 Spotlight - Freight Transportation Costs/Freight Rates
- 4.10 Impact of COVID-19 on the Market
5 MARKET SEGMENTATION
- 5.1 By Mode of Transport
- 5.1.1 Rail
- 5.1.2 Road
- 5.1.3 Other Modes of Transport
- 5.2 By Geography
- 5.2.1 China
- 5.2.2 Japan
- 5.2.3 India
- 5.2.4 South Korea
- 5.2.5 Indonesia
- 5.2.6 Vietnam
- 5.2.7 Australia
- 5.2.8 Rest of Asia-Pacific
6 COMPETITIVE LANDSCAPE
- 6.1 Market Concentration Overview
- 6.2 Company Profiles
- 6.2.1 Maersk Asia Pacific
- 6.2.2 Agility
- 6.2.3 C H Robinson Worldwide Inc.
- 6.2.4 FedEx Corp.
- 6.2.5 Deutsche Post DHL Group
- 6.2.6 Hitachi Ltd
- 6.2.7 CMA CGM SA Group
- 6.2.8 DB Schenker
- 6.2.9 United Parcel Services Inc.
- 6.2.10 Ceva Logistics
- 6.2.11 Yusen Logistics Co. Ltd*
- 6.3 Other Companies
7 FUTURE OUTLOOK OF THE MARKET
8 APPENDIX
- 8.1 Macroeconomic Indicators
- 8.2 Insight into Capital Flows (Investments in Transport and Storage Sectors)
- 8.3 External Trade Statistics
