
|
市場調査レポート
商品コード
1636188
米国の不動産仲介:市場シェア分析、産業動向、統計、成長予測(2025年~2030年)United States Real Estate Brokerage - Market Share Analysis, Industry Trends & Statistics, Growth Forecasts (2025 - 2030) |
||||||
カスタマイズ可能
適宜更新あり
|
|||||||
| 米国の不動産仲介:市場シェア分析、産業動向、統計、成長予測(2025年~2030年) |
|
出版日: 2025年01月05日
発行: Mordor Intelligence
ページ情報: 英文 190 Pages
納期: 2~3営業日
|

全表示
- 概要
- 目次
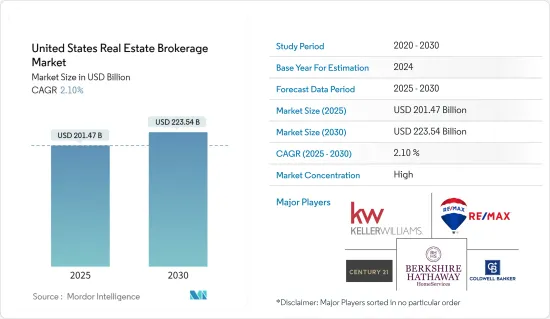
米国の不動産仲介の市場規模は2025年に2,014億7,000万米ドルと推定され、予測期間(2025-2030年)のCAGRは2.1%で、2030年には2,235億4,000万米ドルに達すると予測されます。
主なハイライト
- 米国の不動産仲介市場は、主に同国の経済状況とテクノロジーの進歩によって牽引されています。
- 住宅ローン金利の高騰、住宅価格の高騰、販売不振にもかかわらず、専門家は住宅市場の将来を楽観視しています。しかし、いくつかの根強い課題が、熱心な買い手にとって待望の好転を妨げています。
- 大きなハードルのひとつはインフレです。この遅れは、連邦準備制度理事会(FRB)がフェデラルファンド金利の引き下げに慎重な姿勢を示していることによって、さらに悪化しています。住宅ローン金利はこの基準金利と密接に結びついているため、過去20年以上で最高となった最近のフェデラル・ファンド金利の急上昇は住宅ローン金利に直接影響し、借り手にとって住宅取得が容易でなくなっています。
- 住宅ローン金利が上昇する一方で、米国の住宅価格は底堅さを見せています。S&Pコアロジック・ケースシラー住宅価格指数は、4月の年間上昇率が6.3%となり、3月の6.5%から若干低下したもの、依然として新記録を更新しています。多くの専門家はFRBの利下げが住宅セクターを活性化させる可能性があると考えているが、2024年に利下げが行われる時期や可能性は依然不透明です。
- その魅力にもかかわらず、新築住宅は住宅ローン金利高騰のピンチを感じています。5月、住宅ローン金利が7%を超えたため、米国の新築一戸建ての販売は打撃を受けました。米国国勢調査局とHUDのデータによると、4月から11.7%の急減、2022年からは16.5%の大幅減となった。
- 購入者にとっては好材料だが、販売不振により新築住宅の在庫は2008年初頭以来の水準に達しています。市場に残っている買い手は交渉力を増しています。中古住宅の売り手は、成約費用の負担や修繕費の拠出といった譲歩案を提示する傾向が強まっています。
- さらに、5月の新築住宅価格の中央値が500米ドル下落し41万7,400米ドルとなり、中古住宅の中央値を2,000米ドル近く下回ったことは、新築住宅を検討している人にとっては喜ばしいことと思われます。
米国の不動産仲介市場動向
産業部門が不動産吸収をリード、小売部門は空室率を引き締め
- 2022年以降、需要の伸びは拡大しているもの、産業部門はパンデミック前の数字を上回る前例のないレベルのスペースを吸収しています。2023年9月までの12ヵ月間で、純吸収量は2億4,300万平方フィートという驚異的な数字を記録しました。この急増により、同セクターの空室率はわずか5.1%にとどまり、小売業に次いで2番目となった。
- 賃料の上昇ペースはやや緩み、前年の11.4%という高水準から7.5%に落ち込んだもの、他のセクターと比較すると比類なき水準であり、パンデミック前の水準を上回っています。具体的には、ロジスティクススペースの賃料上昇が最も顕著で、年率8.8%の上昇となった。フレックススペースは4.5%増でこれに続き、専門スペースは6.1%増となった。
- 小売スペースの吸収率は2022年比で26%低下したもの、現在の空室率は4.1%と10年来の低水準にあります。これは、小売セクターが全商業用不動産セグメントの中で最も厳しい空室率であることを示しています。特筆すべきは、一般小売と近隣センターが2023年第3四半期の純吸収量の87%近くを占め、リードしていることです。
- 小売業の賃料は2022年と比較して高水準を維持しているもの、その伸びは鈍化しています。この減速は、コスト上昇の中で消費者が慎重になっているためと思われます。全米の小売業の募集賃料は3.5%の伸びを示し、前年のピーク時である4.4%からは低下したが、それでもパンデミック前の賃料を上回っています。特に、ネイバーフッドセンターとパワーセンターは、それぞれ4.4%と4.2%と最も大幅な賃料上昇となった。一方、一般小売業は3%の上昇と小幅であったが、空室率は2.5%と全サブセクター中最低を維持しました。
著しい成長を遂げる住宅セグメント
- 2024年3月、米国の新築一戸建て住宅販売件数は、2月に修正された減少から回復しました。この上昇の主な要因は、市場における中古住宅の供給不足が続いていることです。しかし、この明るい動向は、住宅ローン金利の上昇により逆風に直面する可能性があります。
- 商務省の報告書では、3月の住宅価格の中央値が7ヵ月ぶりの高水準に急上昇したことが強調されています。これは主に、値下げを提供する建設業者が減少し、高価格帯の住宅に販売がシフトしたためです。価格も住宅ローン金利も上昇傾向にあり、住宅市場は、特に初めて住宅を購入する人にとっては、ますます手が届かなくなる可能性があります。
- 米商務省国勢調査局は、新築住宅販売件数が8.8%増と大幅に急増し、季節調整済み年率換算で69万3,000戸に達したと発表しました。これは9月以来の高水準です。なお、2月の販売ペースは66万2,000戸から63万7,000戸に下方修正されました。
- 2024年2月の新築住宅販売件数は米国全地域で急増しました。北東部は27.8%増と突出し、中西部は5.3%増となった。人口密度の高い南部では7.7%増加しました。一方、西部は8.6%の大幅増となった。
米国の不動産仲介業界の概要
米国の不動産仲介市場は、全国規模のフランチャイズから地元の独立系まで様々なプレーヤーが存在し、活気に満ちた競合情勢を誇っています。ケラー・ウィリアムズ・リアルティ、RE/MAX、コールドウェル・バンカー、バークシャー・ハサウェイ・ホームサービシーズ、センチュリー21・リアルエステートなどの大手フランチャイズが、その広範なエージェント・ネットワークとリソースを活用し、市場を独占しています。
一方、地元や地域の独立系仲介業者は、ニッチな分野を切り開き、特定の地域や物件タイプに特化したサービスや専門知識を得意としています。Zillow、Redfin、Compassのような破壊者は、オンラインツール、データ主導の洞察、バーチャルサービスに軸足を置き、従来の仲介業者の常識を覆し、業界を再構築しています。
その他の特典:
- エクセル形式の市場予測(ME)シート
- 3ヶ月間のアナリスト・サポート
目次
第1章 イントロダクション
- 調査の前提条件
- 調査範囲
第2章 調査手法
- 分析手法
- 調査フェーズ
第3章 エグゼクティブサマリー
第4章 市場力学と洞察
- 現在の市場シナリオ
- 市場力学
- 促進要因
- 市場を牽引する都市化の進展
- 市場を牽引する規制環境
- 抑制要因
- 市場の飽和が市場を抑制
- 金利変動が市場を抑制
- 機会
- 技術の進歩
- 促進要因
- バリューチェーン/サプライチェーン分析
- 政府の規制、貿易協定、イニシアチブ
- 業界の魅力度-ポーターのファイブフォース分析
- 供給企業の交渉力
- 消費者の交渉力
- 新規参入業者の脅威
- 代替品の脅威
- 競争企業間の敵対関係の強さ
- COVID-19の市場への影響
第5章 市場セグメンテーション
- タイプ別
- 住宅用
- 非住宅用
- サービス別
- 販売
- レンタル
第6章 競合情勢
- 市場集中の概要
- 企業プロファイル
- Keller Williams
- RE/MAX
- Coldwell Banker
- Berkshire Hathaway Home Services
- Century 21
- Sotheby's International Realty
- Compass
- eXp Realty
- Realogy Holdings Corp
- Redfin*
- その他の企業
第7章 市場の将来
第8章 付録
The United States Real Estate Brokerage Market size is estimated at USD 201.47 billion in 2025, and is expected to reach USD 223.54 billion by 2030, at a CAGR of 2.1% during the forecast period (2025-2030).
Key Highlights
- The US real estate brokerage market is mainly driven by the country's economic conditions and advancements in technology.
- Despite high mortgage rates, soaring home prices, and sluggish sales, experts are optimistic about the housing market's future. However, several persistent challenges are impeding the much-anticipated turnaround for eager buyers.
- One major hurdle is inflation, which is proving slow to abate. This delay is further exacerbated by the Federal Reserve's cautious stance on cutting the federal funds rate. Given that mortgage rates are closely tied to this benchmark rate, the recent surge in the federal funds rate, now at its highest in over two decades, is directly impacting mortgage rates, making homeownership less affordable for borrowers.
- While mortgage rates rise, US home prices show resilience. The S&P CoreLogic Case-Shiller Home Price Index reported a 6.3% annual gain in April, slightly down from March's 6.5% but still setting a new record. While many experts believe a Fed rate cut could reinvigorate the housing sector, the timing and likelihood of such a cut in 2024 remain uncertain.
- Despite their allure, new homes are feeling the pinch of soaring mortgage rates. In May, as mortgage rates touched or exceeded 7%, sales of newly built single-family homes in the United States took a hit. Data from the US Census Bureau and HUD reveals a sharp 11.7% drop from April and a significant 16.5% decline from 2022.
- On a positive note for buyers, the sluggish sales have pushed new home inventories to levels not witnessed since early 2008. Buyers still in the market are gaining more negotiating power. Sellers of existing homes are increasingly offering concessions, such as covering closing costs and contributing towards repairs.
- Furthermore, those eyeing new constructions will be pleased to know that the median price for a new home in May dropped by USD 500 to USD 417,400, nearly USD 2,000 below the median price of an existing home.
United States Real Estate Brokerage Market Trends
Industrial Sector Leads Real Estate Absorption, Retail Tightens Vacancy Rates
- Although demand growth has increased from 2022, the industrial sector is absorbing unprecedented levels of space, surpassing pre-pandemic figures. In the 12 months leading up to September 2023, net absorption hit a staggering 243 million square feet. This surge has driven the sector's vacancy rate to a mere 5.1%, second only to retail.
- While the pace of rent increases has eased slightly, dropping to 7.5% from a high of 11.4% the year before, they remain unmatched compared to other sectors and have exceeded pre-pandemic levels. Specifically, logistics spaces have seen the most significant uptick, with rents climbing by 8.8% annually. Flex spaces followed with a 4.5% increase, while specialized spaces grew by 6.1%.
- Although retail space absorption dipped by 26% from 2022, the sector's current vacancy rates are at a decade-low, at 4.1%. This marks the retail sector as having the tightest vacancy rate among all commercial real estate segments. Notably, General Retail and Neighborhood Centers led the way, accounting for nearly 87% of net absorption in Q3 2023.
- While retail rents have remained high compared to 2022, their growth has slowed. This deceleration is likely attributed to consumer caution amidst rising costs. Nationally, retail asking rents saw a 3.5% growth, down from the previous year's peak of 4.4% but still higher than pre-pandemic rates. Specifically, neighborhood centers and power centers experienced the most significant rent hikes at 4.4% and 4.2%, respectively. On the other hand, general retail saw a more modest 3% increase but maintained the lowest vacancy rate at 2.5% among all subsectors.
Residential Segment Experiencing Significant Growth
- In March 2024, sales of new single-family homes in the United States bounced back from a revised lower figure in February 2024. This uptick was largely due to a persistent shortage of existing homes in the market. However, this positive trend might face headwinds due to a resurgence in mortgage rates.
- The Commerce Department's report highlighted that the median house price surged to a seven-month high in March, primarily because fewer builders were offering price cuts, leading to a shift in sales toward higher-priced homes. With both prices and mortgage rates on the rise, the housing market could become increasingly unaffordable, particularly for first-time buyers.
- The Commerce Department's Census Bureau reported a significant 8.8% surge in new home sales, reaching a seasonally adjusted annual rate of 693,000 units in the latest month. This marks the highest level since September. Notably, the sales pace for February was adjusted downward, from 662,000 units to 637,000 units.
- In February 2024, new home sales surged across all US regions. The Northeast led the pack with a remarkable 27.8% increase, while the Midwest saw a 5.3% uptick. In the South, where population density is high, sales rose by 7.7%. Meanwhile, the West experienced a significant 8.6% jump in sales.
United States Real Estate Brokerage Industry Overview
The US real estate brokerage market boasts a vibrant and competitive landscape, with a spectrum of players, from national franchises to local independents. Leading franchise giants such as Keller Williams Realty, RE/MAX, Coldwell Banker, Berkshire Hathaway HomeServices, and Century 21 Real Estate dominate the market, leveraging their extensive agent networks and resources.
Meanwhile, local and regional independent brokerages carve out their niche, excelling in tailored services and specialized knowledge of specific locales or property types. Disruptors like Zillow, Redfin, and Compass are reshaping the industry, pivoting toward online tools, data-driven insights, and virtual services, challenging traditional brokerage norms.
Additional Benefits:
- The market estimate (ME) sheet in Excel format
- 3 months of analyst support
TABLE OF CONTENTS
1 INTRODUCTION
- 1.1 Study Assumptions
- 1.2 Scope of the Study
2 RESEARCH METHODOLOGY
- 2.1 Analysis Methodology
- 2.2 Research Phases
3 EXECUTIVE SUMMARY
4 MARKET DYNAMICS AND INSIGHTS
- 4.1 Current Market Scenario
- 4.2 Market Dynamics
- 4.2.1 Drivers
- 4.2.1.1 Increasing Urbanization Driving the Market
- 4.2.1.2 Regulatory Environment Driving the market
- 4.2.2 Restraints
- 4.2.2.1 Market Saturation Restraining the Market
- 4.2.2.2 Intrest Rate Fluctuations Restraining the Market
- 4.2.3 Opportunities
- 4.2.3.1 Technological Advancements
- 4.2.1 Drivers
- 4.3 Value Chain/Supply Chain Analysis
- 4.4 Government Regulations, Trade Agreements, and Initiatives
- 4.5 Industry Attractiveness - Porter's Five Forces Analysis
- 4.5.1 Bargaining Power of Suppliers
- 4.5.2 Bargaining Power of Consumers
- 4.5.3 Threat of New Entrants
- 4.5.4 Threat of Substitute Products
- 4.5.5 Intensity of Competitive Rivalry
- 4.6 Impact of COVID-19 on the Market
5 MARKET SEGMENTATION
- 5.1 By Type
- 5.1.1 Residential
- 5.1.2 Non-Residential
- 5.2 By Service
- 5.2.1 Sales
- 5.2.2 Rental
6 COMPETITIVE LANDSCAPE
- 6.1 Market Concentration Overview
- 6.2 Company Profiles
- 6.2.1 Keller Williams
- 6.2.2 RE/MAX
- 6.2.3 Coldwell Banker
- 6.2.4 Berkshire Hathaway Home Services
- 6.2.5 Century 21
- 6.2.6 Sotheby's International Realty
- 6.2.7 Compass
- 6.2.8 eXp Realty
- 6.2.9 Realogy Holdings Corp
- 6.2.10 Redfin*
- 6.3 Other Companies
