
|
市場調査レポート
商品コード
1631618
小型水力発電-市場シェア分析、産業動向・統計、成長予測(2025年~2030年)Small Hydropower - Market Share Analysis, Industry Trends & Statistics, Growth Forecasts (2025 - 2030) |
||||||
カスタマイズ可能
適宜更新あり
|
|||||||
| 小型水力発電-市場シェア分析、産業動向・統計、成長予測(2025年~2030年) |
|
出版日: 2025年01月05日
発行: Mordor Intelligence
ページ情報: 英文 125 Pages
納期: 2~3営業日
|

全表示
- 概要
- 目次
概要
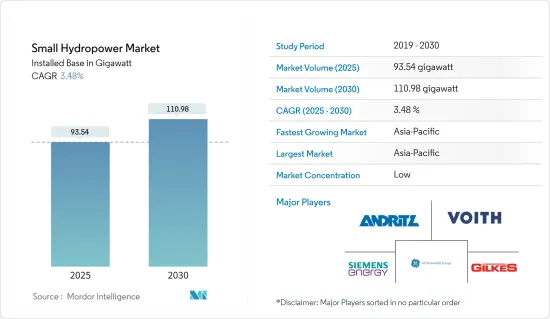
小型水力発電の市場規模は、2025年の93.54ギガワットから2030年には110.98ギガワットに拡大し、予測期間(2025~2030年)のCAGRは3.48%になると予測されます。
主要ハイライト
- 中期的には、小型水力発電市場への投資の増加やクリーンな電力需要の増加といった要因が市場を牽引すると予想されます。
- 一方で、不安定なエネルギー供給は市場の成長を大きく阻害します。
- IoTと水力発電の統合や、農村地域の生活を維持するための小型水力発電ダムに対する前向きな展望は、小型水力発電市場に巨大な機会をもたらすと予想されます。
- アジア太平洋は電力需要が高いため、予測期間中最大の市場になると予想されます。これにより、さらなる成長が見込まれます。
小型水力発電市場の動向
1~10MWセグメントが市場を独占する見込み
- 予測期間中、小型水力発電市場の中で容量が最も豊富なのは1~10MWのセグメントであると予想されます。この1~10MWプラントの割合が高いのは、特にアジアを中心とした発展途上国で展開されている農村電化のための小規模分散型プロジェクトに起因しています。
- さらに、1~10MWの小型水力発電所の1kW当たりの投資コストは、一般的に1MW以下の発電所よりも低いです。また、1~10MWの水力発電所は、水頭が高く、設備容量が大きいという利点もあります。
- インドや中国のような新興経済諸国、東南アジアやウズベキスタンの地域、英国のような欧州諸国は、他の再生可能エネルギー源と並んで、小型水力発電プロジェクトに同等の優先順位を与えています。
- 英国エネルギー統計ダイジェスト(DUKES)によると、2013~2023年にかけて、英国(英国)では小型水力による発電量が一貫して増加しています。2023年までに、英国は小型水力発電施設から1,377ギガワット時の電力を利用しました。この増加率は予測期間中も続くと予想されます。
- さらに、国際再生可能エネルギー機関(IRENA)が開発途上国の実際の小型水力発電プロジェクト数件を評価した結果、LCOEの範囲は0.02~0.10米ドル/kWhであることが明らかになりました。このことから、小型水力発電は、グリッド電力供給やオフグリッド農村電化の取り組みにおいて、コスト競合の高い選択肢であると位置づけられています。多くの新興諸国では、このようなシナリオの下、小型水力発電プロジェクトが大きく発展しています。
- 例えば、20242年4月、ケニアの国営発電会社であるケニア発電会社(KenGen)は、資格のあるコンサルタントからの関心表明を募集しました。その焦点は、新規小型水力発電所開発のためのプレフィージビリティ・スタディの実施と、既存発電所のリハビリテーションや再開発の可能性の評価です。
- 従って、上記の要因から、予測期間中、容量1~10MWのセグメントが世界の小型水力発電市場を独占すると考えられます。
アジア太平洋が市場を独占する見込み
- アジア太平洋は近年、小型水力発電(SHP)市場を独占しており、予測期間中もその支配力を維持する可能性が高いです。2023年現在、アジア太平洋は10MWまでの小型水力発電の設備容量と潜在力が引き続き最大です。
- インドや中国などの主要国は、他の再生可能エネルギー源と並んで小型水力発電プロジェクトに同等の優先順位を与えています。例えば、2016年、インド工科大学ルールキー校は、小型水力発電の可能性の評価を行った。その結果によると、小型水力発電の潜在力は2万1,133MWと推定され、7,133の特定された場所に広がっています。この評価には、河川流域、運河、ダムによるプロジェクトが含まれます。
- 2024年3月現在、インドの小型水力発電(SHP)の総設備容量は、中央電力庁(CEA)の報告によると5,003.25MWに達しています。2023~24年度のSHP発電所の発電量は94億8,504万個(MU)でした。
- さらに、ベトナムは2021年に電力開発計画8(PDP8)を発表し、2045年までに再生可能エネルギーの割合を75%にすることを目標としています。小型水力発電の総発電容量は、2025年に4,800MW、2030年に5,000MW、2045年には6,000MW近くに達することを目標としています。政府は電力部門に130億米ドルの投資を計画しており、水力発電は総設備容量の17.7%~19.5%を占めることになります。
- さらに、同地域では小規模水力発電プロジェクトの開発が著しいです。例えば、2024年1月、メガラヤ州政府はONGC Tripura Power Company Ltd(OTPC)と覚書(MOU)を締結し、同州の広大な水力発電の潜在力を活用する戦略的イニシアチブを打ち出しました。このMOUは、ポンプ貯蔵水力発電プロジェクト、大小さまざまな水力発電ベンチャー、浮体式太陽光発電プロジェクトのような革新的なソリューションの確立など、野心的な目標を設定しています。
- したがって、上記の要因から、予測期間中、アジア太平洋が世界の小型水力発電市場を独占すると予想されます。
小型水力発電産業概要
世界の小型水力発電市場はセグメント化されています。主要参入企業(順不同)としては、Andritz AG、Voith GmbH &Co.KGaA、Siemens Energy AG、GE Renewable Energy、Gilbert Gilkes &Gordon Ltd.などが挙げられます。
その他の特典
- エクセル形式の市場予測(ME)シート
- 3ヶ月間のアナリストサポート
目次
第1章 イントロダクション
- 調査範囲
- 市場の定義
- 調査の前提
第2章 エグゼクティブサマリー
第3章 調査手法
第4章 市場概要
- イントロダクション
- 2029年までの設置容量と予測
- 小型水力発電設備容量の主要地域別シェア(2023年)
- パイプラインと今後の小型水力発電プロジェクト
- 最近の動向と開発
- 政府の規制と施策
- 市場力学
- 促進要因
- クリーンでサステイナブル電力需要の急増
- 抑制要因
- 不安定なエネルギー供給
- 促進要因
- サプライチェーン分析
- ポーターのファイブフォース分析
- 供給企業の交渉力
- 消費者の交渉力
- 新規参入業者の脅威
- 代替品の脅威
- 競争企業間の敵対関係の強さ
第5章 市場セグメンテーション
- 発電容量
- 1MW以下
- 1~10MW
- 用途
- 電力インフラ
- 土木工事
- その他
- 地域
- 北米
- 米国
- カナダ
- その他の北米
- 欧州
- ドイツ
- 英国
- フランス
- イタリア
- スペイン
- 北欧
- トルコ
- ロシア
- その他の欧州
- アジア太平洋
- 中国
- インド
- 日本
- 韓国
- マレーシア
- タイ
- ベトナム
- その他のアジア太平洋
- 中東・アフリカ
- サウジアラビア
- アラブ首長国連邦
- ナイジェリア
- エジプト
- 南アフリカ
- その他の中東・アフリカ
- 南米
- ブラジル
- アルゼンチン
- コロンビア
- その他の南米
- 北米
第6章 競合情勢
- M&A、合弁事業、提携、協定
- 主要企業の戦略
- 企業プロファイル
- Voith GmbH & Co. KGaA
- Andritz AG
- GE Renewable Energy
- Siemens Energy AG
- Gilbert Gilkes & Gordon Ltd.
- Toshiba Energy Systems & Solutions Corporation
- PJSC RusHydro
- FLOVEL Energy Private Limited
- Natel Energy, Inc.
- Kolektor Group
- List of Other Prominent Players
- 市場ランキング分析
第7章 市場機会と今後の動向
- IoTと水力発電の融合と小型水力発電ダムへの前向きな展望
目次
Product Code: 72369
The Small Hydropower Market size in terms of installed base is expected to grow from 93.54 gigawatt in 2025 to 110.98 gigawatt by 2030, at a CAGR of 3.48% during the forecast period (2025-2030).
Key Highlights
- Over the medium term, factors like increasing investment in the small hydropower market and increasing demand for clean electricity are expected to drive the market.
- On the other hand, an unstable energy supply significantly hinders market growth.
- Nevertheless, integrating IoT with hydropower and the positive outlook toward small hydropower dams to sustain lives in rural communities are expected to create enormous opportunities for the Small Hydropower Market.
- Asia-Pacific is expected to be the largest market in the forecast period due to the high demand for electricity in the region. This will facilitate further growth.
Small Hydropower Market Trends
The 1-10 MW Segment Expected to Dominate the Market
- During the forecast period, the 1-10 MW segment is expected to be the most abundant small hydropower market in capacity. This higher proportion of 1-10 MW plants can be attributed to small-scale decentralized projects for rural electrification deployed in developing countries, particularly in Asia.
- Further, the investment costs per kW for small hydropower plants in the 1 - 10 MW range are generally lower than those for plants under 1 MW. The 1 - 10 MW plants also benefit from a higher head and greater installed capacity.
- Developing economies, such as India and China, regions in Southeast Asia and Uzbekistan, and countries in Europe, like the United Kingdom, are giving equal priority to small hydropower projects along with other renewable energy sources.
- According to Digest of UK Energy Statistics (DUKES), From 2013 to 2023, the United Kingdom (UK) saw a consistent rise in electricity generation from small-scale hydro sources. By 2023, the UK harnessed 1,377 gigawatt hours of electricity from its small hydropower facilities. This increase in growth rate is expected to continue during the forecasted period.
- Moreover, the International Renewable Energy Agency's (IRENA) evaluation of several real-world small hydropower projects in developing countries revealed an LCOE range of USD 0.02 to USD 0.10/kWh. This positions small hydro as a highly cost-competitive choice for grid electricity supply and off-grid rural electrification initiatives. Many developing countries witnessed significant developments in small hydropower projects in such a scenario.
- For instance, in April 20242, Kenya Electricity Generating Company (KenGen), the state power producer of Kenya, called for expressions of interest from qualified consultants. The focus is on conducting pre-feasibility studies for the development of new small hydropower plants and assessing the potential rehabilitation and redevelopment of existing ones.
- Therefore, based on the abovementioned factors, the 1-10 MW capacity segment will dominate the small global hydropower market during the forecast period.
Asia-Pacific Expected to Dominate the Market
- The Asia-Pacific region has dominated the small hydropower (SHP) market in recent years and will likely maintain its dominance during the forecast period. As of 2023, Asia-Pacific continues to have the largest installed capacity and potential for small hydropower up to 10 MW.
- Major countries such as India and China are giving equal priority to small hydropower projects along with other renewable energy sources. For instance, in 2016, the Indian Institute of Technology, Roorkee, conducted an assessment of the potential for Small Hydropower. According to their findings, Small Hydropower has an estimated potential of 21,133 MW, spread across 7,133 identified sites. This assessment encompasses Run-of-River, Canal-based, and Dam-toe projects.
- As of March 2024, the total installed capacity for small-hydro power (SHP) in India reached 5,003.25 MW, as reported by the Central Electricity Authority (CEA). In the fiscal year 2023-24, SHP plants generated 9,485.04 million units (MUs).
- Furthermore, Vietnam published Power Development Plan 8 (PDP8) in 2021, which targets a share of 75% for renewable energy by 2045. The total capacity of small hydropower sources is targeted to reach 4,800 MW in 2025, 5,000 MW in 2030, and nearly 6,000 MW by 2045. The government plans to invest USD 13 billion in the power sector, and hydropower would account for 17.7% -19.5% of the total installed capacity.
- Further, the region witnessed significant developments in small-scale hydro projects. For instance, in January 2024, the government of Meghalaya signed a Memorandum of Understanding (MOU) with ONGC Tripura Power Company Ltd (OTPC), marking a strategic initiative to tap into the state's vast hydropower potential. The MOU sets ambitious goals, including establishing a Pump Storage Hydro Power Project, various large and small-scale hydroelectric power ventures, and innovative solutions like floating solar projects.
- Therefore, based on the abovementioned factors, Asia-Pacific is expected to dominate the global small hydropower market during the forecast period.
Small Hydropower Industry Overview
The global small hydropower market is fragmented. Some major players (in no particular order) include Andritz AG, Voith GmbH & Co. KGaA, Siemens Energy AG, GE Renewable Energy, and Gilbert Gilkes & Gordon Ltd., among others.
Additional Benefits:
- The market estimate (ME) sheet in Excel format
- 3 months of analyst support
TABLE OF CONTENTS
1 INTRODUCTION
- 1.1 Scope of the Study
- 1.2 Market Definition
- 1.3 Study Assumptions
2 EXECUTIVE SUMMARY
3 RESEARCH METHODOLOGY
4 MARKET OVERVIEW
- 4.1 Introduction
- 4.2 Installed Capacity and Forecast, till 2029
- 4.3 Small Hydropower Installed Capacity Share, by Major Region, 2023
- 4.4 Small Hydropower Projects in Pipeline and Upcoming
- 4.5 Recent Trends and Developments
- 4.6 Government Policies and Regulations
- 4.7 Market Dynamics
- 4.7.1 Drivers
- 4.7.1.1 Surge in Demand for Clean and Sustainable Power
- 4.7.2 Restraints
- 4.7.2.1 Unstable Energy Supply
- 4.7.1 Drivers
- 4.8 Supply Chain Analysis
- 4.9 Porter's Five Forces Analysis
- 4.9.1 Bargaining Power of Suppliers
- 4.9.2 Bargaining Power of Consumers
- 4.9.3 Threat of New Entrants
- 4.9.4 Threat of Substitute Products and Services
- 4.9.5 Intensity of Competitive Rivalry
5 MARKET SEGMENTATION
- 5.1 Capacity
- 5.1.1 Up to 1 MW
- 5.1.2 1-10 MW
- 5.2 Application
- 5.2.1 Power Infrastructure
- 5.2.2 Civil Works
- 5.2.3 Other Applications
- 5.3 Geography
- 5.3.1 North America
- 5.3.1.1 United States
- 5.3.1.2 Canada
- 5.3.1.3 Rest of North America
- 5.3.2 Europe
- 5.3.2.1 Germany
- 5.3.2.2 United Kingdom
- 5.3.2.3 France
- 5.3.2.4 Italy
- 5.3.2.5 Spain
- 5.3.2.6 Nordic
- 5.3.2.7 Turkey
- 5.3.2.8 Russia
- 5.3.2.9 Rest of Europe
- 5.3.3 Asia-Pacific
- 5.3.3.1 China
- 5.3.3.2 India
- 5.3.3.3 Japan
- 5.3.3.4 South Korea
- 5.3.3.5 Malaysia
- 5.3.3.6 Thailand
- 5.3.3.7 Vietnam
- 5.3.3.8 Rest of Asia-Pacific
- 5.3.4 Middle East and Africa
- 5.3.4.1 Saudi Arabia
- 5.3.4.2 United Arab Emirates
- 5.3.4.3 Nigeria
- 5.3.4.4 Egypt
- 5.3.4.5 South Africa
- 5.3.4.6 Rest of Middle East and Africa
- 5.3.5 South America
- 5.3.5.1 Brazil
- 5.3.5.2 Argentina
- 5.3.5.3 Colombia
- 5.3.5.4 Rest of South America
- 5.3.1 North America
6 COMPETITIVE LANDSCAPE
- 6.1 Mergers and Acquisitions, Joint Ventures, Collaborations, and Agreements
- 6.2 Strategies Adopted by Leading Players
- 6.3 Company Profiles
- 6.3.1 Voith GmbH & Co. KGaA
- 6.3.2 Andritz AG
- 6.3.3 GE Renewable Energy
- 6.3.4 Siemens Energy AG
- 6.3.5 Gilbert Gilkes & Gordon Ltd.
- 6.3.6 Toshiba Energy Systems & Solutions Corporation
- 6.3.7 PJSC RusHydro
- 6.3.8 FLOVEL Energy Private Limited
- 6.3.9 Natel Energy, Inc.
- 6.3.10 Kolektor Group
- 6.4 List of Other Prominent Players
- 6.5 Market Ranking Analysis
7 MARKET OPPORTUNITIES AND FUTURE TRENDS
- 7.1 Integrating IoT with Hydropower and the Positive Outlook toward Small Hydropower Dams
