
北米の風力発電設備:市場シェア分析、産業動向、成長予測(2025~2030年)
North America Wind Power Equipment - Market Share Analysis, Industry Trends & Statistics, Growth Forecasts (2025 - 2030)- 発行日
- ページ情報
- 英文 100 Pages
- 納期
- 2~3営業日
- 商品コード
- 1630407
- カスタマイズ可能 お客様のご希望に応じて、既存データの加工や未掲載情報(例:国別セグメント)の追加などの対応が可能です。詳細はお問い合わせください。
- 適宜更新あり 本レポートは最新情報反映のため適宜更新し、内容構成変更を行う場合があります。ご検討の際はお問い合わせください。
- 翻訳ツール提供対象 PDF対応AI翻訳ツールの無料貸し出しサービスのご利用が可能です
概要
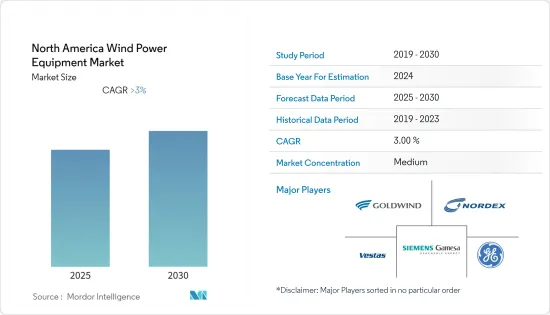
北米の風力発電設備市場は予測期間中に3%を超えるCAGRで推移する見込み。
2020年にはCOVID-19が市場に悪影響を及ぼしました。現在、市場は流行前のレベルに達しています。
主要ハイライト
- 中期的には、風力発電所への投資の増加や風力エネルギーのコスト削減といった要因が北米の風力発電設備市場を牽引するとみられます。
- 一方、太陽光発電や水力発電のようなクリーンな代替電源の採用増加が市場を抑制すると予想されます。
- カナダは2030年までに温室効果ガス排出量を30%削減することを約束しており、その目標を支えるクリーンな電力網の重要性を認識しています。この目標の一部は風力エネルギーで達成される見込みであり、市場関係者にとっては機会となる可能性があります。
- 米国は、風力発電セグメントへの投資が増加し、風力発電の設備容量が同地域で最も大きいことから、同地域の風力発電設備市場の最大市場になると予想されます。
北米の風力発電設備市場動向
陸上セグメントが市場を独占
- 陸上風力発電とは、土地に設置され、風を利用して発電する風力発電所を指します。北米地域では、陸上風力発電所が圧倒的に多く、その理由は、コストが安いこと、土地がまばらであること、グレートプレーンズのような地域で見られる高速の風が吹いていることです。
- 北米の陸上風力発電設備容量は、2021年の15万4,436メガワットから2022年には16万3,428メガワットへと5.8%増加しました。投資の増加により、設置容量は予測期間中にさらに増加すると予想されます。
- カナダ政府は、2025年までに風力発電容量を55GWまで増やし、同国のエネルギー需要の20%を満たすことを目指しています。しかし、この目標を達成するためには、まだ42GW以上の風力発電容量を新たに追加する必要があります。これは、浮体式洋上風力発電プロジェクト開発業者にとって投資機会となることが期待されます。
- さらに、国際再生可能エネルギー機関(IRENA)によると、平準化エネルギーコスト(LCOE)と世界加重平均総設備コストは、2016年の0.060米ドル/kWhと1,652米ドル/kWから、2020年には0.039米ドル/kWhと1,355米ドル/kWに減少します。さらに、資本コストの削減、このセグメントが成熟し続けることによる競争の激化、予測期間中の技術改善により、LCOEと加重平均コストはさらに低下すると予想されます。
- GWECによると、米国の陸上風力発電部門は2021年の年間新規導入量が世界で2番目に多く、約1,274万kWが稼働しました。米国における陸上風力発電の設置は、プロジェクト開発者が期限を守らなければならなかったため、計画されていた生産税額控除の段階的廃止が主要要因であり、これは風力発電設備市場にも直接的に貢献しました。
- したがって、陸上風力発電設備市場は、このセグメントへの投資の増加と新技術の進歩により、予測期間中に大きく成長すると予想されます。
市場を独占する米国
- 米国は風力発電の総設備容量で第2位の国であり、2022年には141GWの容量を記録し、北米の風力発電総設備容量の86%以上を占めました。米国では、風力発電による純発電量は2021年に3,797億7,000万キロワット時となり、これは同年に供給された電力の約9%にあたる。さらに、カンザス州、アイオワ州、オクラホマ州、ノースダコタ州、サウスダコタ州、ネブラスカ州、コロラド州、ミネソタ州、ニューメキシコ州、メイン州の10州では、風力発電による発電量が20%を超えました。
- Orsted A/Sは、Public Service Enterprise Group(PSEG)の支援を受けて、ニュージャージー州初の実用規模の洋上風力発電所を建設する予定です。この1,100MWのプロジェクトは、2020年代に着工し、2024年に稼働する予定です。Orsted A/Sは、ニュージャージー州沖の1,100MWのオーシャン・ウインドに12MWの風力タービンHaliade-Xを配備します。予測期間中、新規プロジェクトによって風力発電設備の需要が増加すると予想されます。
- 2022年4月、洋上風力発電開発業者のトライデント・ウインズは、ワシントン州沖でオリンピック・ウインドと呼ばれる浮体式洋上風力発電プロジェクトを開発するため、BOEMに2,000MWの未請求リース申請書を提出しました。
- 2022年4月、海洋エネルギー管理局は中央大西洋の情報募集と指名区域案を発表しました。389万7,388エーカーに及ぶ提案区域は、約3万MWの発電容量の開発を可能にし、固定式底面風力タービンと浮体式風力タービンの両方の配備をサポートする可能性が高く、2022年5月現在、米国には11の洋上風力発電のためのコールエリアがあり、浮体式構造物には5つのエリアが割り当てられています。
- 洋上風力発電セグメントでは、米国の各州が4万5,000MW近い洋上風力発電の調達目標を設定しています。さらに、12の洋上風力発電プロジェクトの開発により、2026年までに約1,030万kWの洋上風力発電が稼動すると予想されています。
- したがって、米国は、このセグメントへの大規模な投資と技術的進歩により、北米の風力発電設備市場を独占すると予想されます。
北米の風力発電設備産業概要
北米の風力発電設備市場は適度にセグメント化されています。この市場の主要企業(順不同)には、Nordex SE、General Electric Company、Siemens Gamesa Renewable Energy S.A.、Vestas Wind Systems AS、Xinjiang Goldwind Science & Technologyなどがあります。
その他の特典
- エクセル形式の市場予測(ME)シート
- 3ヶ月間のアナリストサポート
目次
第1章 イントロダクション
- 調査範囲
- 市場の定義
- 調査の前提
第2章 調査手法
第3章 エグゼクティブサマリー
第4章 市場概要
- イントロダクション
- 2028年までの市場規模と需要予測(単位:10億米ドル)
- 2028年までの風力エネルギー設置容量と予測(単位:GW)
- 北米の再生可能エネルギーミックス(2022年)
- 最近の動向と開発
- 政府の規制と施策
- 市場力学
- 促進要因
- 抑制要因
- サプライチェーン分析
- ポーターのファイブフォース分析
- 供給企業の交渉力
- 消費者の交渉力
- 新規参入業者の脅威
- 代替品の脅威
- 競争企業間の敵対関係の強さ
第5章 市場セグメンテーション
- 立地
- オンショア
- オフショア
- 設備タイプ
- ローター/ブレード
- タワー
- ギアボックス
- 発電機
- その他の設備タイプ
- 地域
- 米国
- カナダ
- その他の北米地域
第6章 競合情勢
- M&A、合弁事業、提携、協定
- 主要企業の戦略
- 企業プロファイル
- Nordex SE
- Xinjiang Goldwind Science & Technology Co., Ltd.
- General Electric Company
- Siemens Gamesa Renewable Energy S.A.
- Vestas Wind Systems AS
- Emergya Wind Technologies BV
- Acciona, S.A.
- Envision Energy
- Enercon GmbH
第7章 市場機会と今後の動向
目次
The North America Wind Power Equipment Market is expected to register a CAGR of greater than 3% during the forecast period.
In 2020, COVID-19 had a detrimental effect on the market. Presently, the market has reached pre-pandemic levels.
Key Highlights
- Over the medium term, factors such as rising investments in wind farms and reducing the cost of wind energy are likely to drive the North American wind power equipment market.
- On the other hand, increasing adoption of alternate clean power sources such as solar and hydropower is expected to restrain the market.
- Nevertheless, Canada has committed to reducing greenhouse gas emissions by 30 percent by 2030 and recognizes the importance of a clean electricity grid in supporting that objective. A part of the target is expected to be completed using wind energy, which may act as an opportunity for market players.
- The United States is expected to be the largest market for the region's wind power equipment market due to increasing investment in the sector and the highest installed capacity of wind energy in the region.
North America Wind Power Equipment Market Trends
Onshore Segment to Dominate the Market
- Onshore wind power refers to wind farms that are located on land and use the wind to generate electricity. The North American region is overwhelmingly composed of onshore wind farms due to their cheaper cost, sparse land, and high-speed winds that can be found in areas such as the Great Plains.
- Onshore installed wind capacity in North America increased by 5.8%, from 154,436 megawatts in 2021 to 163,428 megawatts in 2022. The installed capacity is expected to further increase in the forecast period due to increasing investments.
- The Canadian government aims to increase wind power capacity to 55 GW by 2025 to meet 20% of the country's energy needs. However, the country still needs to add more than 42 GW of new capacity to meet the targets. This, in turn, is expected to provide investment opportunities for floating offshore wind project developers.
- Further, according to the International Renewable Energy Agency (IRENA), the levelized cost of energy (LCOE) and global weighted average total installed cost decreased from 0.060 USD/kWh and 1652 USD/kW in 2016 to 0.039 USD/kWh and 1355 USD/kW in 2020. In addition, the LCOE and the weighted average cost are expected to decline further owing to reductions in capital costs, increased competition as the sector continues to mature, and improvements in technology during the forecast period.
- According to the GWEC, the United States' onshore wind sector reported the second-highest annual new installations in the world in 2021, with around 12.74 GW commissioned. The onshore wind installation in the United States was driven primarily by the planned Production Tax Credit phase-out as project developers had to meet their deadline, which also directly aided the wind power equipment market.
- Hence, the onshore wind power equipment market is expected to grow significantly in the forecast period due to increasing investments and new technological advances in the field.
United States to Dominate the Market
- The United States was the second-largest country in terms of total installed wind energy capacity, recording 141 GW of capacity in 2022, or more than 86% of the total wind energy capacity in North America. In the United States, the net electricity generation from wind power reached 379.77 billion kilowatt-hours in 2021, which is about 9% of the electricity delivered in the year. Moreover, wind provided more than 20% of the electricity produced in ten states, namely Kansas, Iowa, Oklahoma, North Dakota, South Dakota, Nebraska, Colorado, Minnesota, New Mexico, and Maine.
- Orsted A/S, with the support of Public Service Enterprise Group (PSEG), is expected to construct New Jersey's first utility-scale offshore wind farm. The 1,100 MW project was expected to start construction in the 2020s, with the wind farm becoming operational in 2024. Orsted A/S will deploy Haliade-X 12MW wind turbines on the 1,100MW Ocean Wind off the coast of New Jersey. New projects are expected to increase the demand for wind power equipment in the forecast period.
- In April 2022, offshore wind energy developer Trident Winds submitted a 2,000-MW unsolicited lease application to BOEM to develop a floating offshore wind project called Olympic Wind off Washington State.
- In April 2022, the Bureau of Ocean Energy Management announced its Central Atlantic draft Call for Information and Nominations Area. The proposed areas amounting to 3,897,388 acres were likely to enable the development of approximately 30,000 MW of generating capacity and support the deployment of both fixed-bottom and floating wind turbines, and as of May 2022, there were 11 call areas for offshore wind energy in the United States, with five areas allotted for floating structures.
- In the offshore wind sector, various states in the United States have established nearly 45,000 MW of offshore wind procurement targets. Additionally, around 10.3 GW of offshore wind energy is expected to come online by 2026 with the development of 12 offshore wind energy projects.
- Hence, the United States is expected to dominate the North American wind power equipment market due to significant investments and technological advancements in the sector.
North America Wind Power Equipment Industry Overview
The North American wind power equipment market is moderately fragmented. Some of the key players in this market (in no particular order) include Nordex SE, General Electric Company, Siemens Gamesa Renewable Energy S.A., Vestas Wind Systems AS, and Xinjiang Goldwind Science & Technology Co., Ltd.
Additional Benefits:
- The market estimate (ME) sheet in Excel format
- 3 months of analyst support
TABLE OF CONTENTS
1 INTRODUCTION
- 1.1 Scope of the Study
- 1.2 Market Definition
- 1.3 Study Assumptions
2 RESEARCH METHODOLOGY
3 EXECUTIVE SUMMARY
4 MARKET OVERVIEW
- 4.1 Introduction
- 4.2 Market Size and Demand Forecast in USD billion, till 2028
- 4.3 Wind Energy Installed Capacity and Forecast in GW, till 2028
- 4.4 North America Renewable Energy Mix, 2022
- 4.5 Recent Trends and Developments
- 4.6 Government Policies and Regulations
- 4.7 Market Dynamics
- 4.7.1 Drivers
- 4.7.2 Restraints
- 4.8 Supply Chain Analysis
- 4.9 Porter's Five Forces Analysis
- 4.9.1 Bargaining Power of Suppliers
- 4.9.2 Bargaining Power of Consumers
- 4.9.3 Threat of New Entrants
- 4.9.4 Threat of Substitute Products and Services
- 4.9.5 Intensity of Competitive Rivalry
5 MARKET SEGMENTATION
- 5.1 Location
- 5.1.1 Onshore
- 5.1.2 Offshore
- 5.2 Equipment Type
- 5.2.1 Rotor/Blade
- 5.2.2 Tower
- 5.2.3 Gearbox
- 5.2.4 Generator
- 5.2.5 Other Equipment Types
- 5.3 Geography
- 5.3.1 United States
- 5.3.2 Canada
- 5.3.3 Rest of North America
6 COMPETITIVE LANDSCAPE
- 6.1 Mergers and Acquisitions, Joint Ventures, Collaborations, and Agreements
- 6.2 Strategies Adopted by Leading Players
- 6.3 Company Profiles
- 6.3.1 Nordex SE
- 6.3.2 Xinjiang Goldwind Science & Technology Co., Ltd.
- 6.3.3 General Electric Company
- 6.3.4 Siemens Gamesa Renewable Energy S.A.
- 6.3.5 Vestas Wind Systems AS
- 6.3.6 Emergya Wind Technologies BV
- 6.3.7 Acciona, S.A.
- 6.3.8 Envision Energy
- 6.3.9 Enercon GmbH
7 MARKET OPPORTUNITIES AND FUTURE TRENDS
- 発行日
- 発行
- Mordor Intelligence
- ページ情報
- 英文 100 Pages
- 納期
- 2~3営業日


