
北米の風力発電:市場シェア分析、産業動向、成長予測(2025年~2030年)
North America Wind Power - Market Share Analysis, Industry Trends & Statistics, Growth Forecasts (2025 - 2030)- 発行日
- ページ情報
- 英文 102 Pages
- 納期
- 2~3営業日
- 商品コード
- 1630343
- カスタマイズ可能 お客様のご希望に応じて、既存データの加工や未掲載情報(例:国別セグメント)の追加などの対応が可能です。詳細はお問い合わせください。
- 適宜更新あり 本レポートは最新情報反映のため適宜更新し、内容構成変更を行う場合があります。ご検討の際はお問い合わせください。
- 翻訳ツール提供対象 PDF対応AI翻訳ツールの無料貸し出しサービスのご利用が可能です
概要
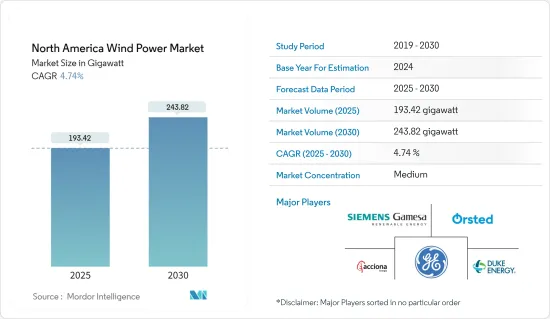
北米の風力発電市場規模は2025年に193.42ギガワットと推定され、予測期間(2025~2030年)のCAGRは4.74%で、2030年には243.82ギガワットに達すると予測されます。
主要ハイライト
- 長期的には、市場成長の主要要因として、有利な政府施策、風力発電プロジェクトへの投資の増加、風力エネルギーのコスト削減などが挙げられ、風力エネルギー導入の増加につながりました。
- その一方で、ガスベースの電力や太陽光発電などの代替エネルギー源の採用が増加していることが、同地域における市場成長の妨げになる可能性が高いです。
- 短期的な課題にもかかわらず、北米の風力発電産業は、陸上風力発電と洋上風力発電の両方で大きく成長すると予測されています。産業の専門家は、特に浮体式洋上風力プラットフォームにおける技術の進歩が、太平洋沿岸や大西洋の深海における膨大な可能性を解き放つだろうと予想しています。
- 米国はこの地域で最も設置容量が大きく、予測期間中も陸上風力発電の絶え間ない増加と今後の洋上風力発電プロジェクトに支えられ、最大の市場になると予想されています。
北米の風力発電市場の動向
市場を独占する陸上セグメント
- 陸上風力発電とは、陸上に設置された風力タービンが自然の空気の流れを利用して発電する電力を指します。北米で最も急成長している再生可能エネルギー技術のひとつです。また、風力タービンは大気汚染物質や水質汚染物質を放出しないため、将来のカーボンフリーのエネルギー産業にとっても重要です。
- 過去5年間で、陸上風力発電技術は、風速の低い北米のより多くの場所をカバーするために、設置されたメガワット容量あたりの発電量を最大化するように進化してきました。
- 例えば、2023年には北米の陸上風力発電設備は合計172.29GWとなります。米国は147.979GW、カナダは16.989GWです。これは、設置量が164.215GWであった2022年から4.92%の増加です。米国とカナダにおける発電コストの低下と投資の増加は、陸上風力タービンのさらなる設置を促進すると予想されます。
- さらに、米国は2023年6月に風力発電容量を650万kW増やし、108億米ドルを投資しました。この年に設置されたプロジェクトはすべて陸上であり、洋上プロジェクトは開始されていないです。このような取り組みにより、北米の陸上風力発電の総設備量を増やすことができます。
- 手頃な価格でクリーンかつ多様な電力供給へのニーズが高まるなか、全米の政府と電力会社は風力発電を実行可能なソリューションと考えています。さらに、この地域の比類ない風力資源により、風力エネルギー開発の経済的・環境的利益を最大化する十分な機会が存在します。
- 2024年、北米の陸上風力エネルギー産業は回復と拡大を示しています。米国エネルギー省(DOE)の最新報告によると、インフレ抑制法(IRA)により、近い将来の風力エネルギー導入予測が著しく改善されました。米国クリーンパワー協会(ACP)によると、米国の陸上風力発電パイプラインは、2024年第1四半期末までに約2,530万kWに達し、前年比で5万kW以上の増加を記録しました。
- 今後4年間で、北米は6,000万kWの陸上風力発電容量を追加すると予想され、その92%は米国、残りの8%はカナダで発生します。このような拡大は、有利な施策、投資、技術の進歩によってもたらされる可能性があります。米国は新たな陸上風力発電プロジェクトをリードし、再生可能エネルギーへの取り組みに大きく貢献すると考えられます。この成長は、よりクリーンなエネルギーへの移行と二酸化炭素排出量の削減をサポートします。
- 以上の点と最近の動向から、予測期間中は陸上部門が北米の風力発電市場を独占すると予想されます。
市場を独占する米国
- 米国の風力発電産業は、国内エネルギー生産を促進することを目的としたアメリカ・ファースト施策により、政府から絶大な支援を受けています。同国にはリース可能な広大な沿岸地域があるため、洋上風力発電セグメントは主要な開発セグメントと考えられています。
- 2023年の風力発電の総設備容量は14万8,020MWで、2022年の14万1,674MWから4.9%増加し、北米の風力発電総設備容量の90%以上を占め、第2位となりました。
- さらに、米国の電力会社規模で発電された総電力の約10%、4,250億kWhが、41州にわたる風力発電プロジェクトによるものでした。この期間における風力発電の主要5州は、テキサス州、アイオワ州、オクラホマ州、カンザス州、イリノイ州であり、これらの州を合わせると、同国の風力発電総出力の約59%を占めています。
- 2023年、Vestasは米国に約210万kWの風力発電設備を納入しました。さらに、Vestasはニューメキシコ州にあるSunZia Windプロジェクトで1,089MWを受注し、これはVestasにとって世界最大の陸上プロジェクトとなりました。また、Vestasは米国のサプライチェーンに19億米ドルを投入し、1,200社以上のサプライヤーと協力しました。これは、国内の風力発電容量が拡大し続けているにもかかわらず、米国がVestasのような国際企業に風力発電タービンや機器を依存していることを強調しています。
- 2024年、Natixis Corporate & Investment BankingはInvenergyに9億米ドルのグリーン信用状を提供しました。この融資は、南北アメリカ全域の広範な風力発電プロジェクトの成長を支援することを目的としています。Invenergyの再生可能エネルギープロジェクトは30GW以上に及び、風力発電のベンチャー企業が注目を集めています。さらに、ナティクシスCIBは、カンザス州とテキサス州における677MWの風力発電と太陽光発電施設への支援として12億7,000万米ドルを融資しました。この投資は、風力エネルギーのインフラ強化への献身を強調するものです。
- 米国風力エネルギー協会(AWEA)によると、風力発電市場は、設置された風力発電容量の大幅な伸びを目の当たりにしました。米国全体の風力発電容量の4分の1以上がテキサス州にあります。
- また、エネルギー省(DOE)によれば、洋上風力は年間2,000GW以上の発電能力を持つ可能性があります。さらに、アメリカ風力エネルギー協会(American Wind Energy Association)の関係者は、約700億米ドルの洋上風力発電プロジェクトが進行中であり、2030年までに完成する見込みであると述べています。
- 以上の点と最近の動向から、予測期間中は米国が北米の風力発電市場を独占すると予想されます。
北米の風力発電産業概要
北米の風力発電市場は細分化されています。同市場の主要企業には、Acciona Energia SA、Orsted AS、Duke Energy Corporation、General Electric Company、Siemens Gamesa Renewable Energy SAなどがあります。
その他の特典
- エクセル形式の市場予測(ME)シート
- 3ヶ月間のアナリストサポート
目次
第1章 イントロダクション
- 調査範囲
- 市場の定義
- 調査の前提
第2章 調査手法
第3章 エグゼクティブサマリー
第4章 市場概要
- イントロダクション
- 2029年までの設置容量と予測(単位:GW)
- 北米の再生可能エネルギーミックス、2023年
- 風力タービンの設置台数、2019~2023年
- 最近の動向と開発
- 政府の規制と施策
- 市場力学
- 促進要因
- 政府の支援施策とインセンティブ
- 風力エネルギーコストの低下
- 抑制要因
- ガス発電や太陽光発電などの代替エネルギー源の採用増加
- 促進要因
- サプライチェーン分析
- ポーターのファイブフォース分析
- 供給企業の交渉力
- 消費者の交渉力
- 新規参入業者の脅威
- 代替品の脅威
- 競争企業間の敵対関係
- 投資分析
第5章 市場セグメンテーション
- 立地別
- オンショア
- オフショア
- 地域別
- 米国
- カナダ
- その他の北米
第6章 競合情勢
- M&A、合弁事業、提携、協定
- 主要企業の戦略
- 企業プロファイル
- 風力ファーム事業者
- Acciona Energia SA
- Orsted AS
- Duke Energy Corporation
- NextEra Energy Inc.
- Trident Winds Inc.
- E.ON SE
- EDF SA
- EnBW Energie Baden-Wurttemberg AG
- 機器サプライヤー
- Envision Energy
- General Electric Company
- Siemens Gamesa Renewable Energy
- Vestas Wind Systems AS
- 風力ファーム事業者
- その他の主要国一覧
- 市場ランキング分析
第7章 市場機会と今後の動向
- 浮体式洋上風力プラットフォームの採用
目次
Product Code: 69531
The North America Wind Power Market size is estimated at 193.42 gigawatt in 2025, and is expected to reach 243.82 gigawatt by 2030, at a CAGR of 4.74% during the forecast period (2025-2030).
Key Highlights
- Over the long term, major factors attributing to the growth of the market include favorable government policies, the increasing investment in wind power projects, and the reduced cost of wind energy, which led to increased adoption of wind energy.
- On the other hand, the increasing adoption of alternate energy sources, such as gas-based power and solar power, is likely to hinder the market growth in the region.
- Nevertheless, despite potential short-term challenges, the North American wind energy power industry is projected to grow substantially, with both onshore and offshore wind installations. Industry experts anticipate that technological advances, particularly in floating offshore wind platforms, will unlock a vast potential along the Pacific coast and deeper Atlantic waters.
- The United States had the highest installed capacity in the region, and it is expected to be the largest market during the forecast period, bolstered by constant growth in onshore wind power additions and upcoming offshore wind power projects.
North America Wind Power Market Trends
Onshore Segment to Dominate the Market
- Onshore wind energy refers to the electricity produced by wind turbines situated on land, harnessing the natural flow of air. It is one of the fastest-growing renewable energy technologies in North America. It is also important for a future carbon-free energy industry because wind turbines do not release air or water pollutants.
- Over the last five years, onshore wind energy power generation technology has evolved to maximize electricity produced per megawatt capacity installed to cover more North American sites with lower wind speeds.
- For instance, in 2023, onshore wind energy installations in North America totaled 172.29 GW. The United States accounted for 147.979 GW, while Canada had 16.989 GW. This represented a 4.92% increase from 2022, when installations were at 164.215 GW. The decreasing cost of power generation and increased investments in the United States and Canada are expected to drive further onshore wind turbine installations.
- Moreover, in June 2023, the United States increased its wind power capacity by 6.5 GW, investing USD 10.8 billion. All projects installed during this year were onshore, as no offshore projects were initiated. This kind of initiative can boost North America's total onshore wind energy installations.
- With the increasing need for an affordable, clean, and diverse electricity supply, the government and utilities nationwide consider wind power a viable solution. Moreover, with the region's unparalleled wind resources, ample opportunities exist to maximize wind energy development's economic and environmental benefits.
- In 2024, the onshore wind energy industry in North America is demonstrating recovery and expansion. The latest reports from the US Department of Energy (DOE) suggest that the Inflation Reduction Act (IRA) has markedly improved projections for wind energy deployment in the near term. According to the American Clean Power Association (ACP), the land-based wind energy pipeline in the United States reached approximately 25.3 GW by the end of Q1 2024, marking an increase of over 5 GW compared to the previous year.
- In the next four years, North America is expected to add 60 GW of onshore wind capacity, with 92% of this growth occurring in the United States and the remaining 8% in Canada. This expansion may be driven by favorable policies, investments, and technological advancements. The United States will lead in new onshore wind projects, contributing significantly to renewable energy efforts. This growth supports the transition to cleaner energy and reduced carbon emissions.
- Owing to the above points and the recent developments, the onshore segment is expected to dominate the North American wind power market during the forecast period.
United States to Dominate the Market
- The US wind power industry is receiving immense support from the government due to the America First policy, which aims to boost domestic energy production. The offshore wind power sector is considered a major area of development, as the country has a large coastal area available for leasing.
- In 2023, the country had the second-largest total installed wind energy turbine capacity, with 148,020 MW, marking a 4.9% increase from the 141,674 MW installed in 2022, which accounted for over 90% of North America's total wind energy capacity.
- Additionally, approximately 10% of the total electricity generated at the utility-scale in the United States, equating to 425 billion kWh, was derived from wind energy projects across 41 states. The leading five states in terms of wind electricity generation during this period were Texas, Iowa, Oklahoma, Kansas, and Illinois, which together accounted for around 59% of the total wind electricity output in the country.
- In 2023, Vestas provided approximately 2.1 GW of wind capacity to the United States, representing the company's highest delivery volume in any nation during that year. Furthermore, Vestas obtained a substantial order of 1,089 MW for the SunZia Wind project located in New Mexico, which stands as the largest single onshore project worldwide for Vestas. The company also committed USD 1.9 billion to the US supply chain, collaborating with over 1,200 suppliers. This underscores the dependence of the United States on international firms such as Vestas for wind power turbines and equipment, even as domestic wind power generation capacity continues to expand.
- In 2024, Natixis Corporate & Investment Banking offered a Green Letter of Credit valued at USD 900 million to Invenergy. This loan is aimed at backing the growth of extensive wind energy projects throughout the Americas. Invenergy's collection of renewable energy projects spans more than 30 GW, featuring notable wind energy ventures. Furthermore, Natixis CIB has extended USD 1.27 billion in support for 677 MW of wind and solar facilities in Kansas and Texas. This investment underscores the dedication to enhancing wind energy infrastructure.
- According to the American Wind Energy Association (AWEA), the wind power market witnessed significant growth in the total installed wind power capacity, and the ongoing and dramatic onshore wind boom in Texas primarily drove this increase in capacity. More than a quarter of the total wind capacity of the United States is in Texas.
- Also, according to the Department of Energy (DOE), offshore wind has the potential to generate more than 2,000 GW of capacity per year. Adding to this, the American Wind Energy Association's officials have stated that around USD 70 billion of offshore wind power projects are in the pipeline and are expected to be completed by 2030.
- Owing to the above points and the recent developments, the United States is expected to dominate the North American wind power market during the forecast period.
North America Wind Power Industry Overview
The North American wind energy market is semi-fragmented. Some of the key players in the market include Acciona Energia SA, Orsted AS, Duke Energy Corporation, General Electric Company, and Siemens Gamesa Renewable Energy SA.
Additional Benefits:
- The market estimate (ME) sheet in Excel format
- 3 months of analyst support
TABLE OF CONTENTS
1 INTRODUCTION
- 1.1 Scope of the Study
- 1.2 Market Definition
- 1.3 Study Assumption
2 RESEARCH METHODOLOGY
3 EXECUTIVE SUMMARY
4 MARKET OVERVIEW
- 4.1 Introduction
- 4.2 Installed Capacity and Forecast in GW, until 2029
- 4.3 North America Renewable Energy Mix, 2023
- 4.4 Number of Wind Turbines Installed, 2019-2023
- 4.5 Recent Trends and Developments
- 4.6 Government Policies and Regulations
- 4.7 Market Dynamics
- 4.7.1 Drivers
- 4.7.1.1 Supportive Government Policies and Incentives
- 4.7.1.2 Declining Wind Energy Cost
- 4.7.2 Restraints
- 4.7.2.1 Increasing Adoption of Alternate Energy Sources, Such as Gas-based Power and Solar Power
- 4.7.1 Drivers
- 4.8 Supply Chain Analysis
- 4.9 Porter's Five Forces Analysis
- 4.9.1 Bargaining Power of Suppliers
- 4.9.2 Bargaining Power of Consumers
- 4.9.3 Threat of New Entrants
- 4.9.4 Threat of Substitutes Products and Services
- 4.9.5 Intensity of Competitive Rivalry
- 4.10 Invrestment Analysis
5 MARKET SEGMENTATION
- 5.1 By Location
- 5.1.1 Onshore
- 5.1.2 Offshore
- 5.2 By Geography
- 5.2.1 United States
- 5.2.2 Canada
- 5.2.3 Rest of North America
6 COMPETITIVE LANDSCAPE
- 6.1 Mergers and Acquisitions, Joint Ventures, Collaborations, and Agreements
- 6.2 Strategies Adopted by Leading Players
- 6.3 Company Profiles
- 6.3.1 Wind Farm Operators
- 6.3.1.1 Acciona Energia SA
- 6.3.1.2 Orsted AS
- 6.3.1.3 Duke Energy Corporation
- 6.3.1.4 NextEra Energy Inc.
- 6.3.1.5 Trident Winds Inc.
- 6.3.1.6 E.ON SE
- 6.3.1.7 EDF SA
- 6.3.1.8 EnBW Energie Baden-Wurttemberg AG
- 6.3.2 Equipment Suppliers
- 6.3.2.1 Envision Energy
- 6.3.2.2 General Electric Company
- 6.3.2.3 Siemens Gamesa Renewable Energy
- 6.3.2.4 Vestas Wind Systems AS
- 6.3.1 Wind Farm Operators
- 6.4 List of Other Prominent Countries
- 6.5 Market Ranking Analysis
7 MARKET OPPORTUNITIES AND FUTURE TRENDS
- 7.1 Adoption of Floating Offshore Wind Platforms
北米の風力発電:市場シェア分析、産業動向、成長予測(2025年~2030年)
- 発行日
- 発行
- Mordor Intelligence
- ページ情報
- 英文 102 Pages
- 納期
- 2~3営業日