
|
市場調査レポート
商品コード
1630389
アジア太平洋の電力-市場シェア分析、産業動向、成長予測(2025年~2030年)Asia-Pacific Power - Market Share Analysis, Industry Trends & Statistics, Growth Forecasts (2025 - 2030) |
||||||
カスタマイズ可能
適宜更新あり
|
|||||||
| アジア太平洋の電力-市場シェア分析、産業動向、成長予測(2025年~2030年) |
|
出版日: 2025年01月05日
発行: Mordor Intelligence
ページ情報: 英文 120 Pages
納期: 2~3営業日
|

全表示
- 概要
- 目次
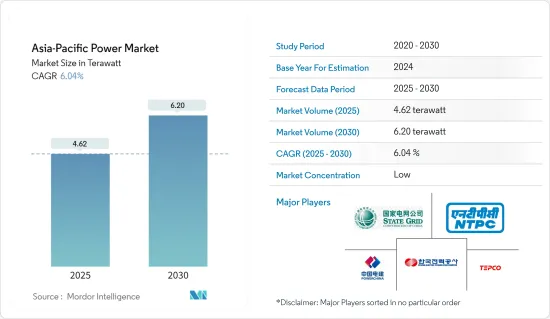
アジア太平洋の電力市場規模は2025年に4.62テラワットと推定され、予測期間中(2025~2030年)のCAGRは6.04%で、2030年には6.20テラワットに達すると予測されます。
主要ハイライト
- 中期的には、住宅、商業、工業セグメントでの電力需要の増加や、再生可能エネルギー源の導入に向けた政府の後押しと電力セクターへの投資の増加といった要因が市場を牽引すると予想されます。
- 一方、発電、送電、配電網の設置と近代化に必要な莫大な投資、石炭火力発電所の閉鎖計画に伴う民間部門の投資の低迷は、市場の成長を阻害すると予想されます。
- 太陽電池にテルル化カドミウムの薄膜コーティングを使用する薄膜技術で作られた太陽電池の新モデルは、効率が高く低コストであるため、このセグメントの機会になる可能性があります。
アジア太平洋電力市場の動向
火力発電が市場を独占
- アジア太平洋は、かなりの量の化石燃料エネルギー源で構成されており、以前の時代には、蒸気タービン、すなわち火力発電所を使用して発電することが、主要国の最初の選択肢となっていました。
- 2022年のアジア太平洋の発電量は約1万4,546.4 TWhでした。すべてのセグメントの中で火力発電の貢献度が最も高く、2022年の市場シェアは約67.7%です。
- 2023年1月現在、中国は世界で最も多くの石炭火力発電所を稼働させています。2023年1月まで、中国には約3092基の稼働中の石炭火力発電所、499基の建設中の石炭発電所、112基の発表済みの石炭発電所があります。したがって、このような動向は今後数年間、火力セクターを推進すると考えられます。
- 石炭以外では、天然ガスのような化石燃料による発電も大きな割合を占めています。2023年1月現在、国内には377基近くのガス発電所が稼動しています。ガス発電所は、今後予定されている様々なプロジェクトのために、今後数年間で増加する可能性が高いです。2023年1月現在、中国には建設中のガス発電所が238カ所、発表済みのガス発電所プロジェクトが78カ所あります。
- さらに、タイも火力エネルギー源に大きく依存しています。2022年、タイの発電容量で最も多いのは天然ガスの約11万4,640GWhで、石炭と褐炭がこれに続きます。
- 2022年10月、Mitsubishi Powerはタイのチョンブリで2,650MWの天然ガス火力発電所が完成したと発表しました。同社はM701JACパワートレインを発電所の共同所有者であるGulf Energy Development PCLとMitsui & The Gulf SRC(GSRC)発電所に納入しました。この発電所は、両社の合弁会社であるIndependent Power Development Co.(IPD)の下で開発された初のガス焚き独立発電プロジェクトです。GSRC発電所の最初の2基の660MWユニットは、それぞれ2021年3月と2021年10月に運転を開始しました。3基目と4基目は2022年に完成しました。
- このように、火力発電所の建設・運営コストの競合と火力発電部門への継続的な投資により、火力発電所がアジア太平洋の電力市場を独占する可能性が高いことは、上記の点からも明らかです。
インドは市場で大きなシェアを占めると予想される
- インドは世界有数の経済大国であり、完全自由化された広大な電力市場があります。インドの電力産業は、インドにおける発電、送電、配電、電力エネルギーの販売をカバーしています。
- インドは、アジア太平洋でも有数の発電・消費市場です。化石燃料を利用した発電、特に天然ガスと石炭が大きなシェアを占め、同国における電力市場の展開拡大に道を開いた。
- 電力省の統計によると、2023年10月現在、インドで発電される電力の56%以上(天然ガス6%、褐炭1.6%、ディーゼル0.1%、石炭49%)を化石燃料が占め、次いで再生可能エネルギーが約41.4%(水力11.2%、風力10.3%、太陽光16.1%、小水力1.2%、その他2.6%)を占めています。国内では再生可能エネルギーの割合が急速に増加しているが、短期的には化石燃料ベースの電源、特に石炭火力発電所がこのセグメントを支配すると考えられます。このような発電産業のシナリオは、予測期間中の電力市場の成長に影響を与えると予想されます。
- インドの電力セクターは、人口増加、エネルギー需要の増加、産業セクターの成長により、急速な変貌を遂げています。さらに、インドの発電ミックスは過去10年間で天然ガスと再生可能エネルギー発電にシフトしました。
- 再生可能エネルギー部門は、固定価格買取制度(FIT)を含むインドの再生可能エネルギー法規の作成と施行を担当する新・再生可能エネルギー省(MNRE)によって管理されています。
- 例えば、2022年現在、新・再生可能エネルギー省(MNRE)は、詳細プロジェクト報告書(DPR)の作成に対して、ソーラーパーク1件あたり最高250万インドルピーまでの中央資金援助(CFA)を提供しています。これに加えて、1MWあたり200万インドルピーまたは系統連系費用を含むプロジェクト費用の30%のいずれか低い方の金額を上限とするCFAも提供されます。さらに、200万インドルピー/MWのCFAは、ソーラーパークの内部インフラ開発についてはSPPDに、外部送電システム開発については中央送電事業者(CTU)/州送電事業者(STU)に、それぞれ60:40の割合で配分されます。
- また、インドはアジア太平洋で最大の再生可能エネルギー市場の一つです。インドの再生可能エネルギー設備容量は、2023年11月現在、水力発電を除いて132GW以上に達しています。太陽光、風力、バイオエネルギーがインドの主要な再生可能エネルギー源です。2023年11月時点で、水力発電を含む再生可能エネルギー発電は、総発電量の約41.4%を占めています。
- したがって、上記のような点から、インドは電力消費量が多く、電力事業への投資が大規模であることから、市場で大きなシェアを占めると予想されます。
アジア太平洋電力産業概要
アジア太平洋の電力市場は細分化されています。同市場の主要企業(順不同)には、Power Construction Corporation of China、NTPC Limited、Tokyo Electric Power Company Holdings、State Grid Corporation of China、Korea Electric Power Corporationなどがあります。
その他の特典
- エクセル形式の市場予測(ME)シート
- 3ヶ月間のアナリストサポート
目次
第1章 イントロダクション
- 調査範囲
- 市場の定義
- 調査の前提
第2章 調査手法
第3章 エグゼクティブサマリー
第4章 市場概要
- イントロダクション
- 2028年までの設置容量と需要予測(単位:TW)
- 最近の動向と開発
- 政府の規制と施策
- 市場力学
- 促進要因
- 指数関数的に増加する電力需要
- 再生可能エネルギーの採用
- 抑制要因
- 再生可能エネルギーインフラ構築のための巨額投資
- 促進要因
- サプライチェーン分析
- ポーターのファイブフォース分析
- 供給企業の交渉力
- 消費者の交渉力
- 新規参入業者の脅威
- 代替品の脅威
- 競争企業間の敵対関係
第5章 市場内訳
- 発電源
- 火力
- 水力
- 再生可能エネルギー
- その他
- 送配電(T&D)
- 地域
- 中国
- インド
- 日本
- 韓国
- その他のアジア太平洋
第6章 競合情勢
- 合併、買収、提携、合弁事業
- 主要企業の戦略
- Key Companies Profile
- Power Construction Corporation of China
- National Thermal Power Corporation Limited
- Tokyo Electric Power Company Holdings
- State Grid Corporation of China
- Korea Electric Power Corporation
- China Huaneng Group Co., Ltd.
- China Huadian Corporation Ltd.
- Tata Power Company Ltd
- Kansai Electric Power Co., Inc.
- Chubu Electric Power Co., Inc.
第7章 市場の可能性と今後の動向
- スマートグリッドネットワークの開発
The Asia-Pacific Power Market size is estimated at 4.62 terawatt in 2025, and is expected to reach 6.20 terawatt by 2030, at a CAGR of 6.04% during the forecast period (2025-2030).
Key Highlights
- Over the medium term, factors such as increasing demand for electricity in residential, commercial, and industrial segments and the governmental push towards the adoption of renewable energy sources coupled with rising investment in the power sector are expected to drive the market.
- On the other hand, a huge investment that is required for setting up and modernizing of power generation, transmission and distribution network, and weak private sector investment along with the plans to shut down coal-fired power plants are expected to impede the growth of the market.
- Nevertheless, new models of solar cells made of a thin film technology that uses thin coatings of cadmium telluride in solar cells, which has higher efficiency and lower cost, may prove to be an opportunity in the sector.
APAC Power Market Trends
Thermal Power to Dominate the Market
- The Asia Pacific region consists of a substantial amount of fossil fuel energy sources, which in earlier eras became the first choice of the major countries for generating power by the use of steam turbines, i.e. thermal power stations.
- Electricity generation in Asia-Pacifc was around 14546.4 TWh in 2022. Among all the segments, thermal power contributes the highest, with a market share of approximately 67.7% in 2022.
- As of January 2023, China has the highest number of operating coal thermal power plants in the world. Till January 2023, China has around 3092 units of operating coal thermal power plants, 499 under-construction coal power plants, and 112 announced coal power plants. Hence, such a trend would propel the thermal sector in the upcoming years.
- Apart from coal, the country has a significant share of electricity generation from fossil fuels like natural gas. As of January 2023, the country has nearly 377 operating gas power plants. The units for gas power plants are likely to increase during the upcoming years on account of various forthcoming projects. As of January 2023, China has around 238 under-construction gas power plants and 78 announced gas power plant projects.
- Furthermore, Thailand is also significantly reliant on thermal energy sources. In 2022, natural gas accounted for the highest power generation capacity in Thailand, with approximately 114.64 thousand GWh, followed by coal and lignite.
- In October 2022, Mitsubishi Power announced the completion of a 2,650-MW natural gas-fired power plant in Chonburi, Thailand. The company has delivered M701JAC power trains to the joint owner of the plant Gulf Energy Development PCL and Mitsui & Co., Ltd. The Gulf SRC (GSRC) power plant is the first gas-fired independent power project developed by the two companies under their joint venture, Independent Power Development Co. (IPD). The first two 660-MW units at the GSRC plant went online in March 2021 and October 2021, respectively. The third and fourth units were completed in 2022.
- Thus the above points clearly mention that, the thermal power plants are likely to dominate the Asia-Pacific power market due to their competitive costs of construction and operating and the continued investment in the thermal power sector.
India is Expected to Have a Significant Share in the Market
- India is one of the major economy in the world and is home to a vast power market that has been fully liberalized. The electric power industry in India covers the generation, transmission, distribution, and sale of electric energy in India.
- India is one of the prominent power-generation and consuming markets in the Asia-Pacific region. Fossil fuel-based power generation, particularly natural gas and coal, had a significant share, paving the way for the increased deployment of the power market in the country.
- According to the Ministry of Power statistics, as of October 2023, the total electricity generation was dominated by fossil fuels, which account for more than 56% (~6% from natural gas, 1.6% from lignite, ~0.1% from diesel, and ~49% from coal) of the electricity produced in India, followed by renewable energy, which accounts for about 41.4% (11.2 % from hydro, 10.3 % from wind, 16.1 % from solar, 1.2% from small hydro power and 2.6% other sources). Though the share of renewable power sources is increasing rapidly in the country, fossil fuels-based power sources, especially coal-fired power plants, are likely to dominate the sector in the short term. Such a scenario in the power generation industry is expected to influence the growth of the power market during the forecast period.
- The power sector in India is undergoing a rapid transformation, owing to the increasing population, rising energy demand, and growing industrial sector. Moreover, India's electricity generation mix shifted to natural gas, and renewable energy sources over the past decade.
- The renewable energy sector is governed by the Ministry of New & Renewable Energy (MNRE) which is responsible for creating and enforcing India's renewable energy laws and regulations, including the Feed-in Tariff system (FIT).
- For instance, as of 2022, the Ministry of New and Renewable Energy (MNRE) provides Central Financial Assistance (CFA) of up to INR 2.5 million per solar park for the preparation of Detailed Project Report (DPR). Besides this, CFA of up to INR 2 million per MW or 30% of the project cost, including grid-connectivity cost, whichever is lower, is also provided. Additionally, the CFA of INR 2 million/MW is apportioned on 60:40 basis towards development of internal infrastructure of solar park to the SPPD and for development of external transmission system to Central Transmission Utility (CTU)/ State Transmission Utility (STU) respectively.
- India is also one of the largest renewable energy markets in Asia-Pacific. India's renewable energy installed capacity reached more than 132 GW as of November 2023, excluding hydropower. Solar, wind, and bioenergy are the major renewable energy sources in the country. As of November 2023, renewable energy sources, including hydropower, accounted for approximately 41.4% of the total electricity generation mix.
- Therefore, with the above cited points, India is expected to have a significant share in the market due to its large electricity consumption and massive investment in power projects.
APAC Power Industry Overview
The Asia-Pacific power market is fragmented. Some of the key players in the market (in no particular order) incluge Power Construction Corporation of China, NTPC Limited, Tokyo Electric Power Company Holdings, State Grid Corporation of China, and Korea Electric Power Corporation., among others
Additional Benefits:
- The market estimate (ME) sheet in Excel format
- 3 months of analyst support
TABLE OF CONTENTS
1 INTRODUCTION
- 1.1 Scope of the Study
- 1.2 Market Definition
- 1.3 Study Assumptions
2 RESEARCH METHODOLOGY
3 EXECUTIVE SUMMARY
4 MARKET OVERVIEW
- 4.1 Introduction
- 4.2 Installed Capacity and Demand Forecast in TW, till 2028
- 4.3 Recent Trends and Developments
- 4.4 Government Policies and Regulations
- 4.5 Market Dynamics
- 4.5.1 Drivers
- 4.5.1.1 Exponentially Increasing Electricity Demand
- 4.5.1.2 Adoption of Renewable Energy
- 4.5.2 Restraints
- 4.5.2.1 Huge Investments for Setting Up Renewable Energy Infrastructure
- 4.5.1 Drivers
- 4.6 Supply Chain Analysis
- 4.7 Porter's Five Forces Analysis
- 4.7.1 Bargaining Power of Suppliers
- 4.7.2 Bargaining Power of Consumers
- 4.7.3 Threat of New Entrants
- 4.7.4 Threat of Substitutes Products and Services
- 4.7.5 Intensity of Competitive Rivalry
5 MARKET SEGEMENTATION
- 5.1 Power Generation Source
- 5.1.1 Thermal
- 5.1.2 Hydro
- 5.1.3 Renewables
- 5.1.4 Others
- 5.2 Power Transmission and Distribution (T&D)
- 5.3 Geography
- 5.3.1 China
- 5.3.2 India
- 5.3.3 Japan
- 5.3.4 South Korea
- 5.3.5 Rest of Asia-Pacific
6 COMPETITIVE LANDSCAPE
- 6.1 Mergers, Acquisitions, Collaboration and Joint Ventures
- 6.2 Strategies Adopted by Key Players
- 6.3 Key Companies Profile
- 6.3.1 Power Construction Corporation of China
- 6.3.2 National Thermal Power Corporation Limited
- 6.3.3 Tokyo Electric Power Company Holdings
- 6.3.4 State Grid Corporation of China
- 6.3.5 Korea Electric Power Corporation
- 6.3.6 China Huaneng Group Co., Ltd.
- 6.3.7 China Huadian Corporation Ltd.
- 6.3.8 Tata Power Company Ltd
- 6.3.9 Kansai Electric Power Co., Inc.
- 6.3.10 Chubu Electric Power Co., Inc.
7 MARKET OPPORTUNITIES and FUTURE TRENDS
- 7.1 Development of Smart Grid Network

