
|
市場調査レポート
商品コード
1910941
コンテナ輸送:市場シェア分析、業界動向と統計、成長予測(2026年~2031年)Container Shipping - Market Share Analysis, Industry Trends & Statistics, Growth Forecasts (2026 - 2031) |
||||||
カスタマイズ可能
適宜更新あり
|
|||||||
| コンテナ輸送:市場シェア分析、業界動向と統計、成長予測(2026年~2031年) |
|
出版日: 2026年01月12日
発行: Mordor Intelligence
ページ情報: 英文 200 Pages
納期: 2~3営業日
|

概要
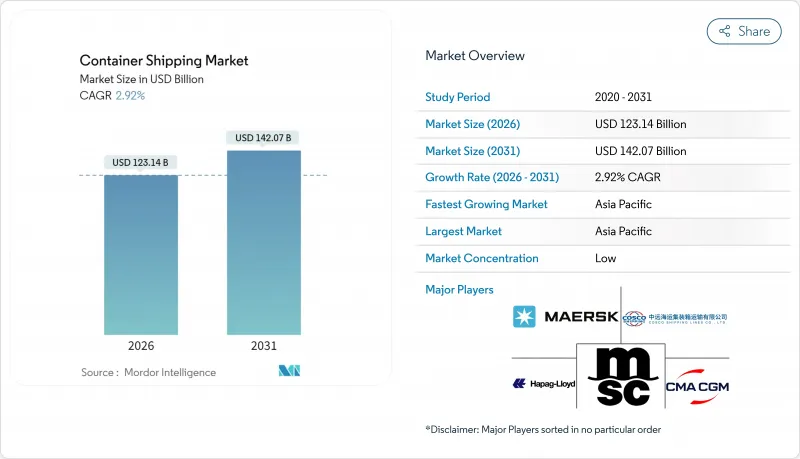
コンテナ海運市場は、2025年の1,196億5,000万米ドルから2026年には1,231億4,000万米ドルへ成長し、2026年から2031年にかけてCAGR2.92%で推移し、2031年までに1,420億7,000万米ドルに達すると予測されております。
貿易協定や電子商取引が基礎的な需要を補充している一方で、船隊全体の速度低下、紅海航路の継続的な迂回、規制コスト基盤の拡大が供給を抑制しています。海運会社はネットワークの信頼性向上に注力しており、新規アライアンスの形成では90%以上の定時運航率を目標としつつ、最も回復力のある航路へ輸送能力を再配分しています。陸上混雑への防御策として、また新たな収益源を獲得する手段として、ターミナル所有権の拡大が継続しています。燃料コストの変動性は依然として収益性を左右する主要因ですが、デュアルフューエル新造船の受注や段階的な効率化アップグレードにより、単位当たりの排出量と燃料消費量は漸減傾向にあります。こうした背景のもと、技術導入と環境規制対応が事業モデルを再構築する中、コンテナ海運市場は運賃主導の収益構造から効率性主導の収益構造へと移行しつつあります。
世界のコンテナ海運市場の動向と洞察
国際貿易量の増加
世界の商品貿易は、消費者支出の安定化と在庫補充サイクルを背景に回復基調にあり、海運会社は遊休船腹を北米及び地中海ゲートウェイへ再配置しています。紅海迂回による航路延長が一時的に過剰船腹を吸収し、新造船の投入が進む中でも運賃水準を維持しています。寄港データによれば、米国東海岸のハブ港では二桁の取扱量回復が確認され、コンテナ海運市場が迅速に貨物流向を再調整できる柔軟性を示しています。設備再配置コストは増加しているもの、バックホール利用率の向上により負担の一部は相殺されています。貿易成長の持続性は、依然として家計購買力と地政学的緊張の正常化速度に依存しています。
自由貿易協定の拡大
2024年12月に締結されたEU-メルコスール協定は、560億ユーロ(618億米ドル)の追加物品貿易を創出し、南大西洋のサービス構造を再構築する見込みです。サンタス港とブエノスアイレス港のターミナルを既に支配する海運会社は、従来カリブ海で積み替えられていた発着地間貨物を捕捉するため、専用ルートの整備を進めています。同時に、USMCA(米国・メキシコ・カナダ協定)の規定は北米域内近距離輸送(ニアショアリング)を強化しており、米国向け貨物を扱うメキシコ拠点のシェア上昇にその動向が表れています。より広範な地域化の流れを受け、船隊計画担当者は長距離東西幹線ルートへの依存から脱却し、短距離・高頻度の航路網設計へと舵を切っています。長期的には、コンテナ海運市場は関税障壁の低減に加え、滞留時間を短縮しサービス予測性を高める調和された通関手続きの恩恵を受けることになります。
変動する燃料油価格
超低硫黄燃料油(VLSF)の2024年平均価格はトン当たり630米ドルであり、EU排出量取引制度への海運部門の組み入れにより、欧州域内航路ではトン当たり170~210米ドルの追加コストが発生しております。価格変動により、運航会社は燃料調整係数を通じて運賃を調整せざるを得ませんが、この調整は市場変動に遅れがちで、利益率を低下させます。LNG、メタノール、従来型燃料油の価格差が拡大しているため、多燃料調達戦略は複雑化しています。ヘッジは部分的な緩和策となりますが、すべての運航会社が有しているわけではない高度な金融知識を必要とします。その結果、エネルギー効率化改修と減速航行は、コンテナ海運市場におけるコストショックを吸収するための即効性のある手段であり続けています。
セグメント分析
40フィートコンテナセグメントは2025年の収益の50.62%を占め、船舶の積載効率を最大化し、鉄道・トラックの規格に適合する業界の主力ユニットとしての地位を反映しています。40フィートコンテナの市場規模は、高積載型を好む設備更新サイクルと内陸インフラの改良に伴い拡大が見込まれます。電子機器・アパレル荷主からの堅調な需要が船隊稼働率を支え、高積載型設計の持続的生産が単位当たり積載率を向上させます。港湾側におけるダブルリフトクレーンスプレッダーへの投資も、このサイズへの運用上の選好をさらに強固にします。20フィートコンテナは、発展途上国における高密度貨物やインフラ制約のあるターミナルにとって依然として重要ですが、荷主がトン当たりカーボンフットプリント削減のために積載を統合する動きから、相対的なシェアは徐々に低下すると予想されます。45フィートコンテナなどの特殊サイズはパレット幅の貨物ニーズに対応しますが、復路需要の不足や特定鉄道回廊での互換性ギャップにより普及が制限されています。
40フィートコンテナの成長は、デジタル化されたコンテナ追跡システムにも支えられています。これによりドア・ツー・ドアの可視性が向上し、大量小売業者の在庫計画効率化が可能となります。リース会社はスマートボックス技術導入のためフリート更新を加速しており、資産回転率の向上と遊休時間の削減につながっています。これらの要因が相まって、2031年まで40フィートセグメントがコンテナ輸送市場の核であり続けるでしょう。
汎用コンテナは2025年の取扱量の63.40%を占め、消費者向け・産業向け貿易フローの大半を支えました。しかしながら、温度管理が必要な医薬品や生鮮食品への持続的な需要を背景に、リーファーユニットはCAGR3.36%を記録し、標準コンテナを上回る成長が見込まれます。断熱性能の向上、テレメトリー機能の統合、低消費電力化により、資本コストは上昇するもの冷蔵輸送サービスの収益性は向上しています。製薬企業は、製品の品質を損なうことなくコスト削減を実現する検証済みのコールドチェーン輸送ルートに惹かれ、高価値な生物学的製剤を航空輸送から海上輸送へ移行させています。食品サプライチェーンでは、廃棄物削減の推進により、高精度な冷蔵コンテナで継続監視され輸送される生鮮食品の割合が増加しています。その結果、海運会社は新造船設計においてより多くの冷蔵コンテナ用プラグを割り当てており、持続的なプレミアム需要への自信を示しています。汎用セグメントは成熟しているもの、コンテナ海運市場の中心であり続け、革新的な設計変更よりも、盗難防止ロックやエンドツーエンド追跡に重点を置いた漸進的なイノベーションが進められています。
並行する動向として、CO2ベースの冷凍システムのレトロフィットが進み、旧式のHFCユニットと比較してエネルギー効率の向上と地球温暖化係数の低減が図られています。こうした技術アップグレードと、食品・医薬品分野の規制促進要因が相まって、リーファーコンテナは収益成長の最前線に留まり続ける見込みです。
コンテナ輸送市場レポートは、コンテナサイズ(20フィートTEU、40フィートFEU、その他)、コンテナタイプ(一般貨物、リーファー)、サービス(フルコンテナ積載FCL、小口貨物LCL)、エンドユーザー産業(消費財・小売、製造・自動車など)、地域(北米、南米、アジア太平洋、欧州、中東・アフリカ)ごとに分類されています。市場予測は金額ベース(米ドル)で提供されます。
地域別分析
アジア太平洋地域は2025年の収益の40.55%を占め、コンテナ海運市場の製造・輸出拠点としての地位を強化しています。中国のGDP成長率が5%近くを維持し、上海、寧波・舟山、釜山における港湾自動化が加速していることが、同地域のスロット需要を支えています。ASEANのサプライチェーン統合と電子部品の流れに後押しされ、アジア域内貿易航路では最高水準の頻度増加が記録されています。アジア・欧州間貨物における夏季の代替航路として北極海航路が台頭し、追加的な回復力層を提供していますが、採用は依然として耐氷船の不足と地政学的リスクによって制約されています。内陸鉄道網と自由貿易地域への継続的な投資が堅調な見通しを支えており、同地域は2031年までCAGR4.12%を達成すると予測されています。
北米では2024年、小売業の在庫補充とECフルフィルメント需要を牽引役として、積載コンテナ輸入量が13.1%の回復を見せました。サバンナやニューヨーク・ニュージャージーなどの東海岸ゲートウェイは、西海岸の労働問題に伴う荷主の分散化と、大型ネオパナマックス船に対応する航路の深掘りの恩恵を受けました。メキシコ西海岸のラサロ・カルデナス港は、米国中西部への鉄道接続性を提供し、アジアからの直行便を誘致しています。ロングビーチターミナルの改修では、ゼロエミッションのヤード設備を重視しており、州の規制に適合するとともに、同地域のコンテナ海運市場の環境配慮度を高めています。潜在的な労働交渉が短期的な変動要因となる一方、陸上在庫バッファーとニアショアリングへの構造的動向が中期的な成長を支えています。
欧州の状況は複雑です。ロッテルダムやアントワープ・ブルージュといった北部ハブ港は2023年の低迷後、小幅な増加にとどまりました。一方、地中海中継ハブ港はスエズ運河回避により約30%の取扱量急増を享受しました。このため、FuelEU MaritimeやETS枠組みによる規制コスト上昇にもかかわらず、南欧のコンテナ海運市場規模は拡大しました。港湾コミュニティシステムや複合輸送鉄道回廊への投資により内陸部への接続性は改善されていますが、危機時の迂回航路において地中海ハブが溢れ出し弁となる場合、混雑リスクは依然として残っています。ブレグジット関連の通関摩擦は安定化しましたが、英国のゲートウェイでは2021年以前と比べて東アジア直行便の取扱量が引き続き低水準です。
その他の特典:
- エクセル形式の市場予測(ME)シート
- アナリストによる3ヶ月間のサポート
よくあるご質問
目次
第1章 イントロダクション
- 調査の前提条件と市場の定義
- 調査範囲
第2章 調査手法
第3章 エグゼクティブサマリー
第4章 市場情勢
- 市場概要
- 市場促進要因
- 国際貿易量の増加
- 自由貿易協定の拡大
- 急速な電子商取引のコンテナ化
- IMO 2023年炭素規制が船隊更新を促進
- 北極海航路の実行可能性(北方航路)
- AIを活用した予測航路設定とスケジュール管理
- 市場抑制要因
- 変動する燃料油価格
- 地政学的貿易摩擦の激化
- 慢性的な港湾周辺の混雑によるボトルネック
- デジタル船舶ー陸上システムへのサイバー攻撃
- バリュー/サプライチェーン分析
- 規制情勢
- テクノロジーの展望
- ポーターのファイブフォース
- 新規参入業者の脅威
- 買い手の交渉力
- 供給企業の交渉力
- 代替品の脅威
- 競争企業間の敵対関係
- 価格分析
第5章 市場規模と成長予測(金額、10億米ドル)
- コンテナサイズ別
- 20フィート(TEU)
- 40フィート(FEU)
- その他
- コンテナタイプ別
- 一般
- リーファー
- サービス別
- フルコンテナ積載(FCL)
- 小口貨物(LCL)
- エンドユーザー業界別
- 消費財・小売業
- 製造業および自動車産業
- 医療・医薬品
- 電子機器および電気機器
- 工業用化学品および原材料
- その他
- 地域別
- 北米
- 米国
- カナダ
- メキシコ
- 南米
- ブラジル
- ペルー
- チリ
- アルゼンチン
- その他南米
- アジア太平洋地域
- インド
- 中国
- 日本
- オーストラリア
- 韓国
- 東南アジア(シンガポール、マレーシア、タイ、インドネシア、ベトナム、フィリピン)
- その他アジア太平洋地域
- 欧州
- 英国
- ドイツ
- フランス
- スペイン
- イタリア
- ベネルクス(ベルギー、オランダ、ルクセンブルク)
- 北欧諸国(デンマーク、フィンランド、アイスランド、ノルウェー、スウェーデン)
- その他欧州地域
- 中東・アフリカ
- アラブ首長国連邦
- サウジアラビア
- 南アフリカ
- ナイジェリア
- その他中東・アフリカ地域
- 北米
第6章 競合情勢
- 市場集中度
- 戦略的動向
- 市場シェア分析
- 企業プロファイル
- MSC Mediterranean Shipping Company
- A.P. Moller-Maersk
- CMA CGM
- COSCO Shipping Lines
- Hapag-Lloyd
- ONE(Ocean Network Express)
- Evergreen Marine
- Yang Ming
- HMM Co.
- PIL(Pacific International Lines)
- ZIM Integrated Shipping
- OOCL
- Wan Hai Lines
- Matson
- X-Press Feeders
- SITC International
- Zhonggu Logistics
- Antong Holdings
- Hyundai Merchant Marine
- IRISL Group

