
|
市場調査レポート
商品コード
1911704
トウモロコシ種子:市場シェア分析、業界動向と統計、成長予測(2026年~2031年)Corn Seed - Market Share Analysis, Industry Trends & Statistics, Growth Forecasts (2026 - 2031) |
||||||
カスタマイズ可能
適宜更新あり
|
|||||||
| トウモロコシ種子:市場シェア分析、業界動向と統計、成長予測(2026年~2031年) |
|
出版日: 2026年01月12日
発行: Mordor Intelligence
ページ情報: 英文 120 Pages
納期: 2~3営業日
|

概要
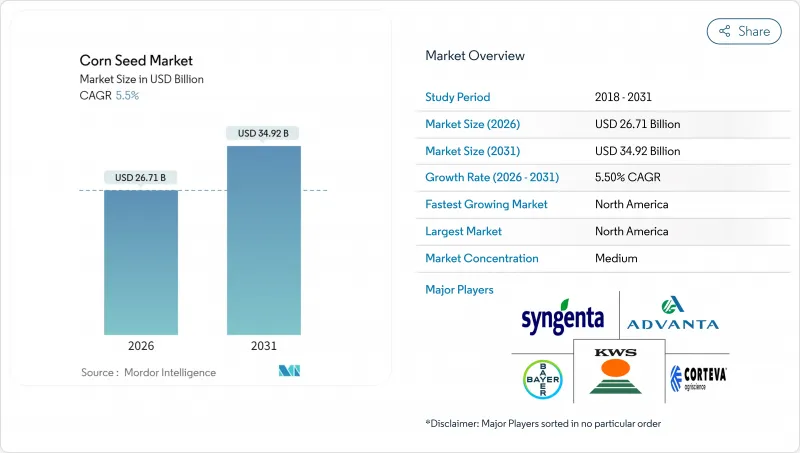
トウモロコシ種子市場は、2025年に253億2,000万米ドルと評価され、2026年の267億1,000万米ドルから2031年までに349億2,000万米ドルに達すると予測されております。
予測期間(2026年~2031年)におけるCAGRは5.50%と見込まれております。
ハイブリッド交配種の更新サイクルが短縮化していること、複合形質技術がプレミアム価格を実現していること、デジタル農学サービスが種子パッケージに不可欠となりつつあることが相まって、主要生産地域全体で収益成長を加速させています。気候変動の影響により、干ばつや高温に耐性のある遺伝資源への需要が高まっています。一方、遺伝子編集技術を用いた作物の規制プロセスが迅速化され、製品開発の流れが変化しています。遺伝学、栽培処方、資材物流を連携させる精密農業プラットフォームは、供給者と農家の関係を強化し、切り替えコストを上昇させています。同時に、低コストの農家直販チャネルが、これまで十分にサービスが行き届いていなかった小規模農家層を開拓し、トウモロコシ種子市場の基盤を拡大しています。
世界のトウモロコシ種子市場の動向と洞察
複合形質トランスジェニック雑種の高い採用率
スタック特性ハイブリッドは、除草剤耐性と害虫被害を抑制し雑草防除を簡素化する複数のBtタンパク質を統合しているため、北米の種子販売において最大のシェアを占めています。バイエル社のSmartStax PROプラットフォームは主要コーンベルト州で展開され、高害虫圧条件下において単一形質品種比8~12%の収量優位性を実証しています。アルゼンチン・ブラジルでは安全性が実証された製品の承認期間が約24ヶ月に短縮され、商業化が加速しています。競争上の優位性は、現在では特性組み合わしの幅広さと、袋内避難地帯の利便性に依存しています。農学的な簡便性を重視する農家が増える中、トウモロコシ種子市場は利益率を守る多特性パッケージへと移行を続けています。主要輸出国における採用の強さは、米国やブラジルの作付面積を技術性能のベンチマークとする輸入依存地域の特性選好にも影響を与えています。
急速な機械化とハイブリッド更新サイクル
インドでは農業機械化サブミッションによる補助金拡充により、2022年以降コンバイン導入率が35%増加。これにより農家は耐倒伏性に優れた新型ハイブリッド品種への転換が可能となりました。ケニア、ガーナ、ナイジェリアでも開発銀行の機械導入プログラムを通じ同様の動きが顕在化。頑丈な茎と成熟期の同期性を備えた機械対応型ハイブリッドへの新規需要が喚起されています。ライフサイクルの短縮化は、各農家が好む遺伝資源の入れ替えを加速させることで、トウモロコシ種子市場の累積規模を拡大します。機械収穫耐性に関する強力な選抜プログラムを有する育種家は、農家が古い系統をより頻繁に更新するため、競争上の優位性を獲得します。この移行はまた、ハイブリッドの性能に関するデータフローを増幅させ、地域に根差した育種判断を強化し、高付加価値種子クラスの採用を促進します。
形質使用料の集中化が小売種子価格を押し上げる
バイオテクノロジー分野の3大企業における特許の集積により、2020年から2024年にかけて形質使用料が増加し、新興経済国における小規模農家にとって小売種子価格が手の届かない水準となりました。現在ではプレミアム遺伝子組み換えハイブリッド種子の店頭価格にライセンシング費用が反映されており、コスト制約のある地域での販売量拡大が制限されています。ブラジルとインドにおける独占禁止法調査は競合上の懸念を浮き彫りにしていますが、現時点では是正措置には至っておらず、既存企業の価格決定力が維持されています。農家が投入コストを精査する中、従来型ハイブリッド種や自家保存種に戻るケースも見られ、トウモロコシ種子市場における技術集約型層の成長を抑制しています。エンドユーザーの反発は、公共部門の育種プログラムに影響を与え、辺境地域向けのロイヤリティフリー代替品開発を促進しています。
セグメント分析
ハイブリッド種子は2025年に総売上の90.12%を占め、トウモロコシ種子市場の基盤としての地位を確固たるものにしております。除草剤耐性と害虫抵抗性を複合化した形質を有する遺伝子組み換えハイブリッドがこのカテゴリーを構成し、多形質パッケージを活用することで圃場における雑草・害虫防除を簡素化しております。導入が最も急速に進んでいるのは米国、ブラジル、アルゼンチンの商業農家であり、デジタル農学ツールが地理空間マッピングを通じてハイブリッドの投資収益率を実証しています。非遺伝子組み換えハイブリッドは、欧州の特定諸国における強い需要を基盤に、有機栽培システムやGMO規制地域で依然として重要性を保っています。一方、遺伝子編集技術による遺伝子組み換えのトリガー回避が後押しし、高タンパク質品種やワキシーコーン品種が特殊用途のニッチ市場を開拓中です。
自然交配品種とハイブリッド派生品種は、種子保存の利点と小規模農家向けの低資本要件に後押しされ、CAGR5.78%で拡大しています。公共部門の育種プログラムはロイヤリティフリーの遺伝資源を提供し、民間業者が非公式ネットワークを通じて流通させることで、遠隔地域への普及を促進しています。これらの動向が相まって、トウモロコシ種子市場は技術クラス間で多様性を維持し、高収益のバイオテクノロジー系品種と量産志向の伝統的種子のバランスを保っています。
トウモロコシ種子市場レポートは、育種技術(ハイブリッド品種、開放受粉品種、ハイブリッド派生品種)および地域(アフリカ、アジア太平洋、欧州など)別に分類されています。市場予測は金額(米ドル)および数量(メトリックトン)で提供されます。
地域別分析
2025年時点で北米はトウモロコシ種子市場の49.62%を占め、アジア太平洋地域は比較的低いシェアを維持しています。中国では現在、外国企業との合弁事業が奨励される政策が実施され、独自の形質へのアクセスが開放される一方、現地の遺伝資源管理は維持されています。インドでは、州政府の補助金と連動した販売店ネットワークの拡大によりハイブリッド品種導入が進み、従来品種と比較して平均収量が大幅に増加しました。インドネシアやベトナムなどの新興経済国では、家禽や水産養殖向けの飼料需要が高まる中、耐病性のある熱帯ハイブリッド種への移行が進んでいます。地域的な育種重点はべと病抵抗性、穂腐病耐性、モンスーン変動下での安定性に置かれており、これがアジア太平洋地域のトウモロコシ種子市場における持続的な優位性を支えています。
北米地域は2031年までにCAGR7.08%で拡大し、全地域中最も高い成長が見込まれます。精密農業の深化、遺伝子編集技術の認可、農学サービスのパッケージ化がプレミアム価格設定力を強化しているためです。メキシコではバイオテクノロジーを多用する商業農場と在来種の栽培が共存する二重構造が特徴であり、供給業者は異なる顧客基盤向けに別個の製品ラインを管理する必要があります。
遺伝子編集技術に関する規制の明確化により、アミノ酸含有量向上などの形質が迅速に商業展開され、栄養価の高いトウモロコシに対する飼料工場の需要を取り込んでいます。カナダの温暖化するプレーリー気候はトウモロコシの適地を拡大し、温帯地域におけるトウモロコシ種子市場の規模をさらに拡大しています。欧州、南米、アフリカ、中東では政策や気候によって多様な需要パターンが見られますが、これらの地域を合わせた導入状況は、地域に適した遺伝資源、カスタマイズされた管理手法、柔軟なライセンシング条件の必要性を浮き彫りにしています。
その他の特典:
- エクセル形式の市場予測(ME)シート
- アナリストによる3ヶ月間のサポート
よくあるご質問
目次
第1章 イントロダクション
- 調査の前提条件と市場の定義
- 調査範囲
- 調査手法
第2章 レポート提供
第3章 エグゼクティブサマリーおよび主要な調査結果
第4章 主要な業界動向
- 作付面積
- 最も人気のある形質
- 育種技術
- 規制の枠組み
- バリューチェーン及び流通チャネル分析
- 市場促進要因
- 複合形質を持つトランスジェニック雑種品種の高い採用率
- 急速な機械化とハイブリッド品種への更新サイクル
- 種子とデジタル農学を統合した精密農業プラットフォームの拡大
- 遺伝子編集トウモロコシ品種の規制迅速化が加速
- 干ばつや熱波の頻発化に伴う気候変動に強い種子の需要
- 低コストの農家向け直接販売型電子商取引種子チャネルの台頭
- 市場抑制要因
- 形質使用料の集中化が小売種子価格を押し上げている
- Bt毒素に対する害虫の耐性強化が研究開発コストを押し上げる
- 厳格な遺伝子組み換え規制と共存ルール
- 偽造種子の蔓延が認証流通経路への信頼を損なう
第5章 市場規模と成長予測(金額および数量)
- 育種技術
- ハイブリッド品種
- 非遺伝子組み換えハイブリッド
- トランスジェニックハイブリッド
- 除草剤耐性ハイブリッド品種
- 害虫抵抗性ハイブリッド品種
- その他の特性
- 自然交配品種および交配品種
- ハイブリッド品種
- 地域
- アフリカ
- 育種技術別
- 国別
- エジプト
- エチオピア
- ガーナ
- ケニア
- ナイジェリア
- 南アフリカ
- タンザニア
- その他アフリカ
- アジア太平洋地域
- 育種技術別
- 国別
- オーストラリア
- バングラデシュ
- 中国
- インド
- インドネシア
- 日本
- ミャンマー
- パキスタン
- フィリピン
- タイ
- ベトナム
- その他アジア太平洋地域
- 欧州
- 育種技術別
- 国別
- フランス
- ドイツ
- イタリア
- オランダ
- ポーランド
- ルーマニア
- ロシア
- スペイン
- トルコ
- ウクライナ
- 英国
- その他欧州地域
- 中東
- 育種技術別
- 国別
- イラン
- サウジアラビア
- その他中東
- 北米
- 育種技術別
- 国別
- カナダ
- メキシコ
- 米国
- その他北米地域
- 南米
- 育種技術別
- 国別
- アルゼンチン
- ブラジル
- その他南米
- アフリカ
第6章 競合情勢
- 主要な戦略的動きs
- 市場シェア分析
- 企業概要
- 企業プロファイル
- Advanta Seeds-UPL
- Bayer AG
- Charoen Pokphand Group(CP Group)
- Corteva Agriscience
- Groupe Limagrain
- Hefei Fengle Seed Industry Co. Ltd
- Kaveri Seeds
- KWS SAAT SE & Co. KGaA
- Syngenta Group
- Yuan Longping High-Tech Agriculture Co. Ltd
- Stine Seed Company
- Mahyco
- DLF A/S
- Rijk ZwaaRijk Zwaan Zaadteelt en Zaadhandel B.V.
- Seed Co International

