|
|
市場調査レポート
商品コード
1438366
シリカサンド:市場シェア分析、業界動向と統計、成長予測(2024-2029)Silica Sand - Market Share Analysis, Industry Trends & Statistics, Growth Forecasts (2024 - 2029) |
||||||

|
|||||||
カスタマイズ可能
適宜更新あり
|
|||||||

| シリカサンド:市場シェア分析、業界動向と統計、成長予測(2024-2029) |
|
出版日: 2024年02月15日
発行: Mordor Intelligence
ページ情報: 英文 120 Pages
納期: 2~3営業日
|

全表示
- 概要
- 目次
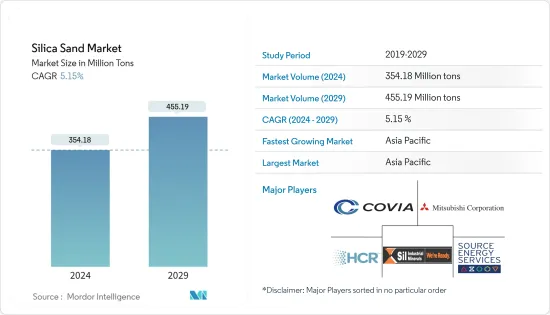
シリカサンド市場規模は2024年に3億5,418万トンと推定され、2029年までに4億5,519万トンに達すると予測されており、予測期間(2024年から2029年)中に5.15%のCAGRで成長します。
COVID-19により市場は悪影響を受けました。パンデミックのため、世界中のいくつかの国がウイルスの蔓延を抑えるためにロックダウンに入りました。多くの企業や工場の閉鎖により、世界中の供給ネットワークが混乱し、世界の生産、配送スケジュール、製品販売に悪影響が及んでいます。現在、市場はCOVID-19感染症のパンデミックから回復し、大幅に増加しています。
主なハイライト
- 中期的には、市場の成長を牽引する主な要因は、鋳造業界からの需要の増加とガラス業界からの需要の増加です。
- 反対に、代替品の入手可能性とシリカサンド採掘の環境への影響への懸念により、市場の成長が抑制される可能性があります。
- 成長する水処理産業は、今後数年間で市場の機会となる可能性があります。
- アジア太平洋が最も高い市場シェアを占めており、この地域は予測期間中に市場を独占する可能性があります。
シリカサンド市場動向
市場を独占する石油・ガス産業
- 石油産業では、ケイ砂はフラクサンドと呼ばれます。ここで重要なのはシリカの硬度です。化学的に純度が高いため、腐食性環境を攻撃する可能性があります。その顆粒の堆積により地層の削りくずが最大化され、深井戸にポンプで汲み上げられると、石油の流量の向上に役立ちます。
- 「フラックスサンド」としても知られるシリカサンドは、石油・ガス会社が非在来型の低浸透性貯留層から天然ガス、液体天然ガス、石油を生産するために使用する完成方法である水圧破砕(「フラッキング」)での使用に由来しています。
- シリカサンドは、頁岩を破砕して、岩石の細孔から天然ガス、石油、天然ガス液体を放出するプロセスに不可欠です。高圧の水流によって小さな穴が大きな亀裂に強制されると、水圧破砕砂がこれらの亀裂を開いたままにし、化石燃料を放出し続けます。これらの亀裂を広げるために白砂(またはその他の種類の天然または合成物質)を使用する場合、それはプロパントと呼ばれます。
- ウォーターポンプが停止されているときは、天然ガスと石油が抽出される細孔が収縮しないように、亀裂を開いたままにしておく必要があります。そのため、プロパントは可能な限り耐久性があり、耐衝撃性がなければなりません。プロパントは、亀裂による巨大な圧力に長く耐えることができます。より多くの石油を抽出できるようになり、井戸の効率が最大化されます。
- 国際エネルギー機関によると、世界の石油消費量は2026年までに日量1億410万バレルに達すると予想されています。これは現在のレベルより日量440万バレル増加することになります。さらに、国際エネルギー機関は、世界の石油需要が2023年に日量190万バレル増加して記録的な日量10170万バレルになると予測しており、これは新型コロナウイルス感染症の制限が解除された中国の増加分のほぼ半分に相当します。
- 世界の石油需要は日量570万バレル(日量100万バレル)増加すると予想されており、2025年までに中国とインドが増加分の約半分を占めるようになります。同時に、世界の石油生産能力は5.9バレル増加すると予想されています。 MB/日。 OPEC(石油輸出国機構)がさらに1.4 mb/日の原油および天然ガスの液体生産能力を構築するにつれて、非OPEC(石油輸出国機構)の供給は4.5 mb/d増加する可能性があり、調査対象の石油・ガス業界の市場に対する需要の増加を示しています。
- 2022年の北米の原油と液体燃料の総生産量は日量2,781万バレルだったが、2021年は日量2,644万バレルだった。米国エネルギー情報局(EIA)によると、米国の原油生産量は、2022年 12月の年間1,211万5,000バレルに対し、2023年 1月には1,246万2,000バレルに達しました。米国は、石油探査において世界をリードする国の1つです。非在来型原油埋蔵量は、調査対象となっている国内の市場にとって大きなチャンスであることを示しています。
- したがって、上記の点により、石油・ガス産業が市場を独占する可能性が高く、その結果、予測期間中にシリカサンドの需要が高まることが予想されます。
アジア太平洋地域が市場を独占
- アジア太平洋地域は調査対象市場を独占すると予想されており、中国やインドなどの主要経済国が地域全体の成長を牽引しています。
- 石油・ガス部門は、中国におけるシリカサンドの最大の応用産業の1つです。中国は過去20年にわたり、成長する経済に合わせて精製能力を拡大するための投資を行ってきました。さらに、中国は長期にわたってあらゆる種類の原油の精製能力を拡大し続けています。エネルギー調査によると、中国は2025年末に2,000万バレルの精製能力を登録する可能性が高く、これが今後数年間のシリカサンドの需要を引き起こすことになるでしょう。
- さらに、中国の原油生産量は2022年最初の2か月で3,347万トンを記録し、前年同期比約4.6%増加しました。中国国家統計局によると、1日あたりの原油生産量は約57万6,000トン。
- ガラス製造産業は、建設業界や自動車業界を含むいくつかの業界でのガラス採用の増加に伴い、中国で最も急速に成長しています。中国国家統計局によると、中国は2023年4月に約4,307万平方メートルの強化ガラスを生産しました。さらに、2022年の強化ガラスの総生産量は約5億8,000万平方メートルとなった。
- 2022年 7月の時点で、国連はインドの現在の人口を14億人以上と推定しています。急速な都市化と人口増加により、今後数年間で石油需要が増加すると予想されます。インド・ブランド・エクイティ財団(IBEF)によると、インドは2045年までに日量1,100万バレルを記録する可能性が高いです。ディーゼル需要は2029~30年までに2倍の163トンに増加すると予測されています。同国は世界第3位の石油輸入国で、年間約2億4,900万トン(日量500万バレルに相当)の精製能力があります。その精製能力は今後5年間で年間2億9,800万トンに増加すると予想されています。
- さらに、インドのガラス産業の成長は主に建設部門によって牽引されてきました。住宅建築プロジェクトにおける板ガラスの需要が高まっているため、建設およびインフラ業界はインドの板ガラス市場で最高の市場シェアを占めています。さらに、インドに拠点を置くこのメーカーは、生産能力と製品ポートフォリオを大幅に拡大しています。
- 2022年3月、フランスのフロートガラスメーカーであるサンゴバンは、インド・チェンナイ西部のスリペルアンブドゥールにあるワールド・ガラス・キャンパスの新しいフロートガラス施設と統合窓ラインに500カロールインドルピー(6,763万米ドル)を投資しました。
- 前述の要因は、アジア太平洋地域のシリカサンド市場の強い成長の可能性を示しています。
その他の特典
- エクセル形式の市場予測(ME)シート
- 3か月のアナリストサポート
目次
第1章 イントロダクション
- 調査の前提条件
- 調査範囲
第2章 調査手法
第3章 エグゼクティブサマリー
第4章 市場力学
- 促進要因
- 鋳造業界からの需要の増加
- ガラス業界からの需要の拡大
- 抑制要因
- 代替要員の確保
- 砂の違法採掘
- シリカサンド採掘による環境への影響への懸念
- 業界のバリューチェーン分析
- ポーター・ファイブ・フォース
- 供給企業の交渉力
- 消費者の交渉力
- 新規参入業者の脅威
- 代替製品やサービスの脅威
- 競合の程度
第5章 市場セグメンテーション(市場規模(数量))
- エンドユーザー産業
- ガラス製造
- 鋳物工場
- 化学品の製造
- 建設
- 塗料とコーティング
- セラミックスおよび耐火物
- 濾過
- 石油・ガス
- その他のエンドユーザー産業
- 地域
- アジア太平洋
- 中国
- インド
- 日本
- 韓国
- その他アジア太平洋地域
- 北米
- 米国
- カナダ
- メキシコ
- 欧州
- ドイツ
- 英国
- イタリア
- フランス
- その他欧州
- 南米
- ブラジル
- アルゼンチン
- その他南米
- 中東とアフリカ
- サウジアラビア
- 南アフリカ
- その他中東およびアフリカ
- アジア太平洋
第6章 競合情勢
- 合併と買収、合弁事業、コラボレーション、および契約
- 市場シェア(%)**/ランキング分析
- 有力企業が採用した戦略
- 企業プロファイル
- Badger Mining Corporation
- Chongqing Changjiang River Moulding Material Group Co. Ltd
- Covia Holdings LLC
- Euroquarz GmbH
- Hi-Crush Inc.
- JFE Mineral &Alloy Company Ltd
- Mitsubishi Corporation
- PUM GROUP
- Sibelco
- Sil Industrial Minerals
- Source Energy Services
- Superior Silica Sands
- Tochu Corporation
- US Silica
第7章 市場機会と将来の動向
- 成長する水処理産業
- その他の機会
The Silica Sand Market size is estimated at 354.18 Million tons in 2024, and is expected to reach 455.19 Million tons by 2029, growing at a CAGR of 5.15% during the forecast period (2024-2029).
The market was negatively impacted due to COVID-19. Owing to the pandemic, several countries worldwide went into lockdown to curb the spread of the virus. The shutdown of numerous companies and factories has disrupted worldwide supply networks and harmed global production, delivery schedules, and product sales. Currently, the market has recovered from the COVID-19 pandemic and increasing at a significant rate.
Key Highlights
- Over the medium term, the major factors driving the market growth are the increasing demand from the foundry industry and the growing demand from the glass industry.
- On the flip side, the availability of substitutes and concerns over the environmental impacts of silica sand mining is likely to restrain the market growth.
- The growing water treatment industry is likely to act as an opportunity for the market in the coming years.
- Asia-Pacific accounted for the highest market share, and the region is likely to dominate the market during the forecast period.
Silica Sand Market Trends
Oil and Gas Industry to Dominate the Market
- In the oil industry, silica sand is referred to as frac sand. The hardness of silica is important here. Because of its chemical purity, it can attack corrosive environments. Its granules deposit maximizes formation cuttings, and when pumped down in deep wells, it helps improve the oil flow rate.
- Silica sand, also known as "frac sand," comes from its use in hydraulic fracturing ("fracking"), a completion method used by oil and gas companies to produce natural gas, natural gas liquids, and oil from unconventional, low permeability reservoirs such as shale.
- Silica sand is essential in the process of fracturing shale to release natural gas, oil, and natural gas liquids from pores in the rock. When the high-pressure water stream forces the small perforations to become larger fractures, fracking sand keeps these fractures open to continue releasing fossil fuels. When white sand (or any other type of natural or synthetic substance) is used to prop open these fractures, it is referred to as a proppant.
- When the water pumps are turned off, the fractures must be kept open so the pores from which natural gas and oil are extracted do not deflate. That is why a proppant must be as durable and crush-resistant as possible. The longer the proppant can withstand the enormous pressure of the fractures. The more petroleum can be extracted, maximizing the well's efficiency.
- According to the International Energy Agency, global oil consumption is expected to reach 104.1 million barrels per day by 2026. This would be a 4.4 mb/d increase over current levels. Furthermore, the International Energy Agency projects that global oil demand will increase by 1.9 mb/d in 2023 to a record 101.7 mb/d, nearly half of the increase from China when its Covid limitations were lifted.
- The global oil demand is expected to rise by 5.7 mb/d (million barrels per day), with China and India accounting for about half of the growth by 2025. At the same time, the world's oil production capacity is expected to rise by 5.9 mb/d. Non-OPEC (Organization of the Petroleum Exporting Countries) supply is likely to increase by 4.5 mb/d as OPEC builds another 1.4 mb/d of crude and natural gas liquids capacity, indicating increased demand for the studied market in the oil and gas industry.
- The total production of crude oil and liquid fuels in North America in 2022 was 27.81 million barrels per day, while in 2021 was 26.44 million barrels per day. According to the US Energy Information Administration (EIA), crude oil production in the United States reached 12,462 thousand barrels in January 2023, compared to 12,115 thousand barrels annually in December 2022. The United States is one of the leading countries globally in the exploration of unconventional crude oil reserves, indicating a massive opportunity for the studied market in the country.
- Thus, due to the abovementioned points, the oil and gas industry is likely to dominate the market, which, in turn, is expected to enhance the demand for silica sand during the forecast period.
Asia-Pacific Region to Dominate Market
- The Asian-Pacific region is expected to dominate the studied market, with major economies like China and India leading the growth across the region.
- The oil and gas sector is one of the largest application industries for silica sand in China. China has invested to scale up its refining capacity over the past two decades to its growing economy. Moreover, for a long-term period, China has continuously expanded its refining capacity for all types of crudes. According to Institute for Energy Research, China is likely to register 20 million barrels of refining capacity at the end of 2025, which will trigger the demand for silica sand in the upcoming years.
- Moreover, the crude oil output of China has registered 33.47 million tons in the first two months of 2022, about 4.6% up from the same period of the previous year. According to the National Bureau of Statistics China, the daily output of crude oil is nearly 576,000 tons.
- The glass manufacturing industry is growing at the fastest rate in China, coupled with the growing adoption of glass in several industries, including construction and automotive. According to the National Bureau of Statistics of China, China produced approximately 43.07 million square meters of reinforced glass in April 2023. Additionally, in 2022, the total production of reinforced glass accounted for nearly 580 million square meters.
- As of July 2022, the United Nations has estimated the current population of India over 1.4 billion. Rapid urbanization and expanding population will raise oil demand in the upcoming years. According to India Brand Equity Foundation (IBEF), India will likely register 11 million barrels daily by 2045. Diesel demand is projected to be doubled to 163 MT by 2029-30. The country is the world's third-biggest oil importer and has a refining capacity of about 249 million tons annually, equivalent to 5 million barrels per day. Its refining capacity is expected to climb to 298 million tons annually over the next five years.
- Furthermore, the Indian glass industry's growth has been driven primarily by the construction sector. The construction and infrastructure industry holds the highest market share in the Indian flat glass market due to the growing demand for flat glass in residential building projects. Additionally, the manufacturer based in India is significantly expanding their production capacities and product portfolio. For instance:
- In March 2022, Saint-Gobain, a French manufacturer of float glass, invested INR 500 crore (USD 67.63 million) in a new float glass facility and an integrated window line at its World Glass Campus in Sriperumbudur, west of Chennai, India.
- The aforementioned factors indicate strong growth potential for the silica sand market in the Asian-Pacific region.
Silica Sand Industry Overview
The global silica sand market is consolidated in nature. Some of the major companies in the market (not in any particular order) include Hi-Crush Inc., Covia Holdings LLC, Source Energy Services, Mitsubishi Corporation, and Sil Industrial Minerals, among others.
Additional Benefits:
- The market estimate (ME) sheet in Excel format
- 3 months of analyst support
TABLE OF CONTENTS
1 INTRODUCTION
- 1.1 Study Assumptions
- 1.2 Scope of the Study
2 RESEARCH METHODOLOGY
3 EXECUTIVE SUMMARY
4 MARKET DYNAMICS
- 4.1 Drivers
- 4.1.1 Increasing Demand from the Foundry Industry
- 4.1.2 Growing Demand from the Glass Industry
- 4.2 Restraints
- 4.2.1 Availability of Substitutes
- 4.2.2 Illegal Mining of Sand
- 4.2.3 Concerns over Environmental Impacts of Silica Sand Mining
- 4.3 Industry Value Chain Analysis
- 4.4 Porter Five Forces
- 4.4.1 Bargaining Power of Suppliers
- 4.4.2 Bargaining Power of Consumers
- 4.4.3 Threat of New Entrants
- 4.4.4 Threat of Substitute Products and Services
- 4.4.5 Degree of Competition
5 MARKET SEGMENTATION (Market Size in Volume)
- 5.1 End-user Industry
- 5.1.1 Glass Manufacturing
- 5.1.2 Foundry
- 5.1.3 Chemical Production
- 5.1.4 Construction
- 5.1.5 Paints and Coatings
- 5.1.6 Ceramics and Refractories
- 5.1.7 Filtration
- 5.1.8 Oil and Gas
- 5.1.9 Other End-user Industries
- 5.2 Geography
- 5.2.1 Asia-Pacific
- 5.2.1.1 China
- 5.2.1.2 India
- 5.2.1.3 Japan
- 5.2.1.4 South Korea
- 5.2.1.5 Rest of Asia-Pacific
- 5.2.2 North America
- 5.2.2.1 United States
- 5.2.2.2 Canada
- 5.2.2.3 Mexico
- 5.2.3 Europe
- 5.2.3.1 Germany
- 5.2.3.2 United Kingdom
- 5.2.3.3 Italy
- 5.2.3.4 France
- 5.2.3.5 Rest of Europe
- 5.2.4 South America
- 5.2.4.1 Brazil
- 5.2.4.2 Argentina
- 5.2.4.3 Rest of South America
- 5.2.5 Middle East and Africa
- 5.2.5.1 Saudi Arabia
- 5.2.5.2 South Africa
- 5.2.5.3 Rest of Middle East and Africa
- 5.2.1 Asia-Pacific
6 COMPETITIVE LANDSCAPE
- 6.1 Mergers and Acquisitions, Joint Ventures, Collaborations, and Agreements
- 6.2 Market Share(%)**/Ranking Analysis
- 6.3 Strategies Adopted by Leading Players
- 6.4 Company Profiles
- 6.4.1 Badger Mining Corporation
- 6.4.2 Chongqing Changjiang River Moulding Material Group Co. Ltd
- 6.4.3 Covia Holdings LLC
- 6.4.4 Euroquarz GmbH
- 6.4.5 Hi-Crush Inc.
- 6.4.6 JFE Mineral & Alloy Company Ltd
- 6.4.7 Mitsubishi Corporation
- 6.4.8 PUM GROUP
- 6.4.9 Sibelco
- 6.4.10 Sil Industrial Minerals
- 6.4.11 Source Energy Services
- 6.4.12 Superior Silica Sands
- 6.4.13 Tochu Corporation
- 6.4.14 U.S. Silica
7 MARKET OPPORTUNITIES AND FUTURE TRENDS
- 7.1 Growing Water Treatment Industry
- 7.2 Other Opportunities

