|
|
市場調査レポート
商品コード
1660559
メタゲノミクスの世界市場:市場規模、シェア、予測、動向分析:オファリング別、技術別、用途別、地域別-2031年までの予測Metagenomics Market Size, Share, Forecast & Trends Analysis by Offering, Technology, Application - Global Forecast to 2031 |
||||||
|
|||||||
カスタマイズ可能
|
|||||||

| メタゲノミクスの世界市場:市場規模、シェア、予測、動向分析:オファリング別、技術別、用途別、地域別-2031年までの予測 |
|
出版日: 2025年01月22日
発行: Meticulous Research
ページ情報: 英文 154 Pages
納期: 即納可能
|

全表示
- 概要
- 図表
- 目次
世界のメタゲノミクスの市場規模は、2024年から2031年に15.6%のCAGRで拡大し、2031年までに67億1,000万米ドルに達すると予測されています。
世界のメタゲノミクス市場の成長は、シーケンシングコストの低下、農業ゲノミクスへの注目の高まり、F&B産業の拡大、ゲノムマッピングプログラムの急増が原動力となっています。しかし、装置のコストが高く、規制や標準化への懸念が市場の成長を抑制しています。
さらに、バイオインフォマティクスとゲノムデータ管理ソリューションの採用が増加し、大規模ゲノムシークエンシングプロジェクトを支援する政府のイニシアチブが市場成長の機会を生み出すと期待されています。しかし、データの保存、取り扱い、解釈、機密保持に関する懸念、熟練した専門家の不足は、世界の自動注射器市場における大きな課題です。
オファリング別では、消耗品セグメントが予測期間中に16.3%の高いCAGRを記録すると予測されています。このセグメントのCAGRが高いのは、消耗品の繰り返し使用と微生物遺伝子プロファイリングの需要の高まりが、メタゲノミクス市場における消耗品の需要を促進しているためです。微生物遺伝子プロファイリングには、大量のサンプルと反復的な手順が必要なため、キットとリージェントが広く使用されています。
技術別では、2024年には16Sシーケンシングセグメントが39.5%と大きなシェアを占めました。ヒトマイクロバイオームやさまざまな環境における微生物群集の理解に注目が集まっていることから、16Sシーケンシングなどの技術に対する需要が高まっています。16Sシーケンシングは、環境サンプル中の新たな生物活性化合物の同定に役立ち、創薬やバイオテクノロジー応用を前進させる。微生物学者による16Sシーケンスの利用の増加が、このセグメントの最大シェアの成長に寄与しています。
当レポートでは、世界のメタゲノミクス市場について調査し、市場の現状とともに、オファリング別、技術別、用途別、地域別の動向、および市場に参入する企業のプロファイルなどを提供しています。
目次
第1章 市場の定義と範囲
第2章 調査手法
第3章 エグゼクティブサマリー
第4章 市場の成長に影響を与える要因
- 概要
- 促進要因
- 抑制要因
- 機会
- 課題
- 動向
- ポーターのファイブフォース分析
第5章 メタゲノミクス市場の評価、オファリング別
- 概要
- 消耗品
- 機器
- ソフトウェア・サービス
第6章 メタゲノミクス市場の評価、技術別
- 概要
- 16Sシークエンシング
- ショットガンシーケンス
- 全ゲノム微生物配列解析
- その他
第7章 メタゲノミクス市場の評価、用途別
- 概要
- 環境
- 臨床診断
- 創薬
- バイオテクノロジー
- その他
第8章 メタゲノミクス市場の評価、地域別
- 概要
- 北米
- 米国
- カナダ
- 欧州
- ドイツ
- フランス
- 英国
- イタリア
- スペイン
- その他
- アジア太平洋
- 中国
- 日本
- インド
- オーストラリア
- その他
- ラテンアメリカ
- 中東・アフリカ
第9章 競合分析
- 概要
- 主な成長戦略
- 競合ベンチマーキング
- 競合ダッシュボード
- 主要参入企業別市場シェア/ランキング分析、2023年
第10章 企業プロファイル(事業概要、財務概要、製品ポートフォリオ、戦略開発、SWOT分析)
- Illumina, Inc.
- Thermo Fisher Scientific Inc.
- F. Hoffman-La-Roche Ltd
- Pacific Biosciences of California Inc.
- QIAGEN N.V.
- Revvity, Inc.
- Oxford Nanopore Technlogies PLC
- Takara Bio, Inc.
- Bio-Rad Laboratories, Inc.
- Agilent Technologies, Inc.
- 10X Genomics, Inc.
- Promega Corporation
- Cantata Bio, LLC
- Zymo Research Corporation
第11章 付録
LIST OF TABLES
- Table 1. Global Metagenomics Market, By Offering, 2022-2031 (USD Million)
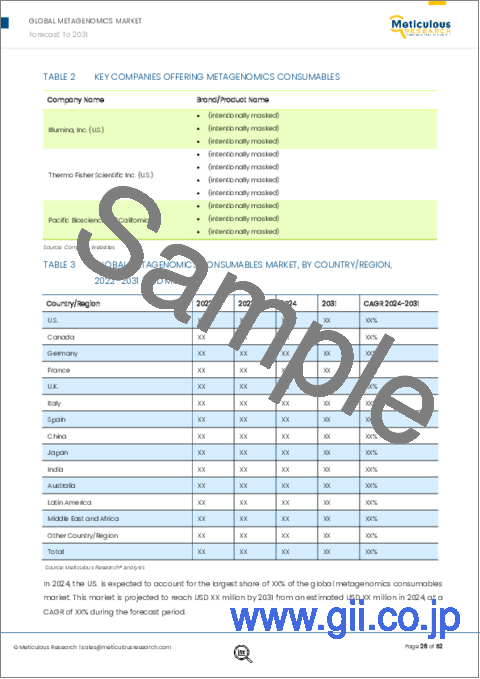
- Table 2. Key Companies Offering Metagenomics Consumables
- Table 3. Global Metagenomics Consumables Market, By Country/Region, 2022-2031 (USD Million)
- Table 4. Key Companies Offering Metagenomics Instruments
- Table 5. Global Metagenomics Instruments Market, By Country/Region, 2022-2031 (USD Million)
- Table 6. Key Companies Offering Metagenomics Software
- Table 7. Global Metagenomics Software & Services Market, By Country/ Region, 2022-2031 (USD Million)
- Table 8. Global Metagenomics Market, By Technology, 2022-2031 (USD Million)
- Table 9. Applications of 16S Sequencing
- Table 10. Global Metagenomics Market For 16s Sequencing, By Country/Region, 2022-2031 (USD Million)
- Table 11. Global Metagenomics Market For Shotgun Sequencing, By Country/ Region, 2022-2031 (USD Million)
- Table 12. Global Metagenomics Market For Whole Genome Microbial Sequencing, By Country/Region, 2022-2031 (USD Million)
- Table 13. Global Metagenomics Market For Other Technologies, By Country/ Region, 2022-2031 (USD Million)
- Table 14. Global Metagenomics Market, By Application, 2022-2031 (USD Million)
- Table 15. Global Metagenomics Market For Environmental, By Country/Region, 2022-2031 (USD Million)
- Table 16. Global Metagenomics Market For Clinical Diagnostics, By Country/ Region, 2022-2031 (USD Million)
- Table 17. Global Metagenomics Market For Drug Discovery, By Country/Region, 2022-2031 (USD Million)
- Table 18. Global Metagenomics Market For Biotechnology, By Country/Region, 2022-2031 (USD Million)
- Table 19. Global Metagenomics Market For Other Applications, By Country/ Region, 2022-2031 (USD Million)
- Table 20. Global Metagenomics Market, By Country/Region, 2022-2031 (USD Million)
- Table 21. North America: Metagenomics Market, By Country, 2022-2031 (USD Million)
- Table 22. North America: Metagenomics Market, By Offering, 2022-2031 (USD Million)
- Table 23. North America: Metagenomics Market, By Technology, 2022-2031 (USD Million)
- Table 24. North America: Metagenomics Market, By Application, 2022-2031 (USD Million)
- Table 25. U.S.: Metagenomics Market, By Offering, 2022-2031 (USD Million)
- Table 26. U.S.: Metagenomics Market, By Technology, 2022-2031 (USD Million)
- Table 27. U.S.: Metagenomics Market, By Application, 2022-2031 (USD Million)
- Table 28. Canada: Metagenomics Market, By Offering, 2022-2031 (USD Million)
- Table 29. Canada: Metagenomics Market, By Technology, 2022-2031 (USD Million)
- Table 30. Canada: Metagenomics Market, By Application, 2022-2031 (USD Million)
- Table 31. Europe: Metagenomics Market, By Country/Region, 2022-2031 (USD Million)
- Table 32. Europe: Metagenomics Market, By Offering, 2022-2031 (USD Million)
- Table 33. Europe: Metagenomics Market, By Technology, 2022-2031 (USD Million)
- Table 34. Europe: Metagenomics Market, By Application, 2022-2031 (USD Million)
- Table 35. Germany: Metagenomics Market, By Offering, 2022-2031 (USD Million)
- Table 36. Germany: Metagenomics Market, By Technology, 2022-2031 (USD Million)
- Table 37. Germany: Metagenomics Market, By Application, 2022-2031 (USD Million)
- Table 38. France: Metagenomics Market, By Offering, 2022-2031 (USD Million)
- Table 39. France: Metagenomics Market, By Technology, 2022-2031 (USD Million)
- Table 40. France: Metagenomics Market, By Application, 2022-2031 (USD Million)
- Table 41. U.K.: Metagenomics Market, By Offering, 2022-2031 (USD Million)
- Table 42. U.K.: Metagenomics Market, By Technology, 2022-2031 (USD Million)
- Table 43. U.K.: Metagenomics Market, By Application, 2022-2031 (USD Million)
- Table 44. Italy: Metagenomics Market, By Offering, 2022-2031 (USD Million)
- Table 45. Italy: Metagenomics Market, By Technology, 2022-2031 (USD Million)
- Table 46. Italy: Metagenomics Market, By Application, 2022-2031 (USD Million)
- Table 47. Spain: Metagenomics Market, By Offering, 2022-2031 (USD Million)
- Table 48. Spain: Metagenomics Market, By Technology, 2022-2031 (USD Million)
- Table 49. Spain: Metagenomics Market, By Application, 2022-2031 (USD Million)
- Table 50. Rest of Europe: Metagenomics Market, By Offering, 2022-2031 (USD Million)
- Table 51. Rest of Europe: Metagenomics Market, By Technology, 2022-2031 (USD Million)
- Table 52. Rest of Europe: Metagenomics Market, By Application, 2022-2031 (USD Million)
- Table 53. Asia-Pacific: Metagenomics Market, By Country/Region, 2022-2031 (USD Million)
- Table 54. Asia-Pacific: Metagenomics Market, By Offering, 2022-2031 (USD Million)
- Table 55. Asia-Pacific: Metagenomics Market, By Technology, 2022-2031 (USD Million)
- Table 56. Asia-Pacific: Metagenomics Market, By Application, 2022-2031 (USD Million)
- Table 57. China: Metagenomics Market, By Offering, 2022-2031 (USD Million)
- Table 58. China: Metagenomics Market, By Technology, 2022-2031 (USD Million)
- Table 59. China: Metagenomics Market, By Application, 2022-2031 (USD Million)
- Table 60. Japan: Metagenomics Market, By Offering, 2022-2031 (USD Million)
- Table 61. Japan: Metagenomics Market, By Technology, 2022-2031 (USD Million)
- Table 62. Japan: Metagenomics Market, By Application, 2022-2031 (USD Million)
- Table 63. India: Metagenomics Market, By Offering, 2022-2031 (USD Million)
- Table 64. India: Metagenomics Market, By Technology, 2022-2031 (USD Million)
- Table 65. India: Metagenomics Market, By Application, 2022-2031 (USD Million)
- Table 66. Australia: Metagenomics Market, By Offering, 2022-2031 (USD Million)
- Table 67. Australia: Metagenomics Market, By Technology, 2022-2031 (USD Million)
- Table 68. Australia: Metagenomics Market, By Application, 2022-2031 (USD Million)
- Table 69. Rest of Asia-Pacific: Metagenomics Market, By Offering, 2022-2031 (USD Million)
- Table 70. Rest of Asia-Pacific: Metagenomics Market, By Technology, 2022-2031 (USD Million)
- Table 71. Rest of Asia-Pacific: Metagenomics Market, By Application, 2022-2031 (USD Million)
- Table 72. Middle East & Africa: Metagenomics Market, By Offering, 2022-2031 (USD Million)
- Table 73. Middle East & Africa: Metagenomics Market, By Technology, 2022-2031 (USD Million)
- Table 74. Middle East & Africa: Metagenomics Market, By Application, 2022-2031 (USD Million)
- Table 75. Latin America: Metagenomics Market, By Offering, 2022-2031 (USD Million)
- Table 76. Latin America: Metagenomics Market, By Technology, 2022-2031 (USD Million)
- Table 77. Latin America: Metagenomics Market, By End User, 2022-2031 (USD Million)
- Table 78. Recent Developments, By Company, 2021-2024
LIST OF FIGURES
- Figure 1. Market Ecosystem
- Figure 2. Secondary Sources referenced for this study
- Figure 3. Primary Research Techniques
- Figure 4. Key Executives Interviewed
- Figure 5. Breakdown of Primary Interviews (Supply Side & Demand Side)
- Figure 6. Market Sizing & Growth Forecast Approach
- Figure 7. Global Metagenomics Market, By Offering, 2024 VS. 2031 (USD Million)
- Figure 8. Global Metagenomics Market, By Technology, 2024 VS. 2031 (USD Million)
- Figure 9. Global Metagenomics Market, By Application, 2024 VS. 2031 (USD Million)
- Figure 10. Global Metagenomics Market, By Geography, 2024 VS. 2031 (USD Million)
- Figure 11. Impact Analysis of Market Dynamics
- Figure 12. Porter's Five Forces Analysis
- Figure 13. Global Metagenomics Market, By Offering, 2024 VS. 2031 (USD Million)
- Figure 14. Global Metagenomics Market, By Technology, 2024 VS. 2031 (USD Million)
- Figure 15. Shotgun Sequencing Workflow
- Figure 16. Global Metagenomics Market, By Application, 2024 VS. 2031 (USD Million)
- Figure 17. Global Metagenomics Market, By Geography, 2024 VS. 2031 (USD Million)
- Figure 18. North America: Metagenomics Market Snapshot
- Figure 19. Europe: pharmaceutical R&D Expenditures, 2000-2022 (USD Million)
- Figure 20. Europe: Metagenomics Market Snapshot
- Figure 21. Rest of Europe: pharmaceutical R&D Expenditures, 2022 (Usd Million)
- Figure 22. Asia Pacific: Metagenomics Market Snapshot
- Figure 23. Latin America: Metagenomics Market Snapshot
- Figure 24. Middle East & Africa: Metagenomics Market Snapshot
- Figure 25. Key Growth Strategies Adopted By Leading Players, 2021-2024
- Figure 26. Metagenomics Market: Competitive Benchmarking, By Offering
- Figure 27. Metagenomics Market: Competitive Benchmarking, By Region
- Figure 28. Metagenomics Market: Competitive Dashboard
- Figure 29. Metagenomics Market: Market Share Analysis, By Key Players (2023)
- Figure 30. Illumina, Inc. : Financial Snapshot (2023)
- Figure 31. Thermo Fisher Scientific Inc.: Financial Snapshot (2023)
- Figure 32. F. Hoffman-La Roche Ltd: Financial Snapshot (2023)
- Figure 33. Pacific Biosciences of California Inc.: Financial Snapshot (2023)
- Figure 34. QIAGEN N.V.: Financial Snapshot (2023)
- Figure 35. Revvity, Inc.: Financial Snapshot (2023)
- Figure 36. Oxford Nanopore Technologies PLC.: Financial Snapshot (2023)
FIGURE 37. TAKARA BIO, INC.: FINANCIAL SNAPSHOT (2023)
- Figure 38. Bio-Rad Laboratories, Inc.: Financial SNAPSHOT (2023)
- Figure 39 Agilent Technologies, Inc.: Financial Snapshot (2023)
FIGURE 40 10X Genomics, Inc.: Financial Overview (2023)
Metagenomics Market Size, Share, Forecast & Trends Analysis by Offering (Consumable, Instruments, Software), Technology (16S, Shotgun, Whole Genome Sequencing Microbial Sequencing), Application (Environmental, Clinical, Drug Discovery) - Global Forecast to 2031
The global metagenomics market is projected to reach $6.71 billion by 2031 at a CAGR of 15.6% from 2024 to 2031.
Succeeding extensive secondary and primary research and in-depth analysis of the market scenario, the report comprises the analysis of key industry drivers, restraints, challenges, and opportunities. The growth of the global metagenomics market is driven by decreasing sequencing cost, increasing focus on Agri genomics, expansion of F&B industry, and surge in genome mapping programs. However, high cost of instruments and regulatory and standardization concerns are restraining the market's growth.
Furthermore, rising adoption of bioinformatics and genomic data management solutions and government initiatives supporting large-scale genomic sequencing projects are expected to generate market growth opportunities. However, data storage, handling, interpretation, and confidentiality concerns and lack of skilled professionals are major challenges in the global autoinjector market.
The report offers a competitive landscape based on an extensive assessment of the product portfolio offerings, geographic presences, and key strategic developments adopted by leading market players in the industry over years (2021-2024). The key players operating in the metagenomics market are Illumina, Inc. (U.S.), Thermo Fisher Scientific Inc. (U.S.), F. Hoffmann-La Roche Ltd (Switzerland), Pacific Biosciences of California Inc. (U.S.), QIAGEN N.V. (Netherlands), Revvity, Inc. (U.S.), Oxford Nanopore Technologies Plc. (U.K.), Takara Bio, Inc. (Japan), Bio-Rad Laboratories, Inc. (U.S.), Agilent Technologies, Inc. (U.S.), 10X GENOMICS, INC. (U.S.), Promega Corporation (U.S.), Cantata Bio, LLC, and Zymo Research Corporation (U.S.).
Among all the offerings studied in this report, the consumables segment is projected to register the highest CAGR of 16.3% during the forecast period. The high CAGR of the segment is attributed to the recurring use of consumables and the rising demand for microbial gene profiling are driving the demand for consumables in the metagenomics market. Kits and regents are widely used for microbial gene profiling as it requires a high volume of samples and repetitive procedures.
Among all the technologies studies in this report, in 2024, 16S sequencing segment is accounted for the larger share of 39.5%. The rising focus on understanding the human microbiome and microbial communities in various environments has led to increased demand for techniques such as 16S sequencing. 16S sequencing helps in identifying new bioactive compounds in environmental samples, advances drug discovery and biotechnological applications. The increasing usage of 16S sequencing by microbiologists is contributing to the growth of largest share of the segment.
Among all the applications studied in this report, in 2024, environmental application segment is accounted for the largest share of 26.6%. The segment's larger share can be attributed to the rapid industrialization, urbanization, and agricultural activities. Growing urbanization and industrialization have resulted in the production and release of a variety of harmful organic and inorganic pollutants into the environment. These harmful substances build up and survive for lengthy periods, degrading the surrounding environment. This creates a demand for metagenomic solutions for environmental research purposes.
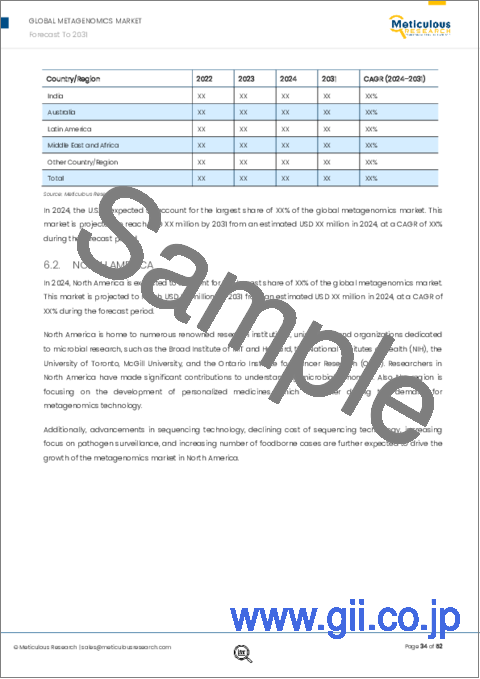
An in-depth analysis of the geographical scenario of the global metagenomics market provides detailed qualitative and quantitative insights into the five major geographies (North America, Europe, Asia-Pacific, Latin America, and the Middle East & Africa) along with the coverage of major countries in each region. North America is projected to register the highest CAGR of 16.9% during the forecast period. The fastest growth of the market is due to the growing focus on the development of personalized medicines and increasing research activities in the field of microbial genomics are driving the demand for metagenomics products in the region. Additionally, advancements in sequencing technology and declining cost of sequencing technology are further expected to drive the metagenomics market in the region.
Scope of the Report:
Metagenomics Market Assessment-by Offering
- Consumables
- Instruments
- Software & Services
- Sequencing & Data Analysis Services
Metagenomics Market Assessment-by Technology
- 16S Sequencing
- Shotgun Metagenomic Sequencing
- Whole Genome Sequencing
- Other Technologies
(Note: Other technologies include targeted microbial sequencing, meta transcriptome sequencing, and pyrosequencing.)
Metagenomics Market Assessment-by Application
- Environmental Applications
- Clinical Diagnostics
- Drug Discovery
- Biotechnology
- Other Applications
(Note: Other applications include food & nutrition, agriculture & soil health, marine microbiomes, and extremophiles.)
Metagenomics Market Assessment-by Geography
- North America
- U.S.
- Canada
- Europe
- Germany
- U.K.
- France
- Italy
- Spain
- Rest of Europe (RoE)
- Asia-Pacific (APAC)
- China
- Japan
- India
- Australia
- Rest of Asia-Pacific (RoAPAC)
- Latin America
- Middle East & Africa
TABLE OF CONTENTS
1. Market Definition & Scope
- 1.1. Market Definition
- 1.2. Market Ecosystem
- 1.3. Currency & Limitations
- 1.4. Key Stakeholders
2. Research Methodology
- 2.1. Research Approach
- 2.2. Process of Data Collection And Validation
- 2.2.1. Secondary Research
- 2.2.2. Primary Research/Interviews With Key Opinion Leaders From The Industry
- 2.3. Market Sizing And Forecast
- 2.3.1. Market Size Estimation Approach
- 2.3.2. Growth Forecast Approach
- 2.3.3. Market Share Analysis
- 2.4. Assumptions For The Study
3. Executive Summary
4. Factors Affecting Market Growth
- 4.1. Overview
- 4.2. Drivers
- 4.2.1. Decreasing Costs of Sequencing
- 4.2.2. Increasing Focus on Agrigenomics
- 4.2.3. Growth in Genome Mapping Programs
- 4.3. Restraints
- 4.3.1. High Instrument Costs
- 4.3.2. Regulatory & Standardization Concerns
- 4.4. Opportunity
- 4.4.1. Rising Adoption of Bioinformatics & Genomics Data Management Solutions
- 4.4.2. Government Initiatives Supporting Large Scale Genomic Sequencing Projects
- 4.5. Challenges
- 4.5.1. Data Storage, Handling, Interpretation and Confidentiality Concerns
- 4.6. Trends
- 4.6.1. Automation in Sequencing Technology
- 4.6.2. Portable Sequencing Instruments
- 4.7. Porter's Five Forces Analysis
5. Metagenomics Market Assessment-By Offering
- 5.1. Overview
- 5.2. Consumbles
- 5.3. Instruments
- 5.4. Software & Services
6. Metagenomics Market Assessment-By Technology
- 6.1. Overview
- 6.2. 16S Sequencing
- 6.3. Shotgun Sequencing
- 6.4. Whole Genome Microbial Sequencing
- 6.5. Other Technologies
7. Metagenomics Market Assessment-By Application
- 7.1. Overview
- 7.2. Environmental Applications
- 7.3. Clinical Diagnostics
- 7.4. Drug Discovery
- 7.5. Biotechnology
- 7.6. Other Applications
8. Metagenomics Market Assessment-By Geography
- 8.1. Overview
- 8.2. North America
- 8.2.1. U.S.
- 8.2.2. Canada
- 8.3. Europe
- 8.3.1. Germany
- 8.3.2. France
- 8.3.3. Uk
- 8.3.4. Italy
- 8.3.5. Spain
- 8.3.6. Rest of Europe (Roe)
- 8.4. Asia-Pacific
- 8.4.1. China
- 8.4.2. Japan
- 8.4.3. India
- 8.4.4. Australia
- 8.4.5. Rest of Asia-Pacific (Roapac)
- 8.5. Latin America
- 8.6. Middle East & Africa
9. Competition Analysis
- 9.1. Overview
- 9.2. Key Growth Strategies
- 9.3. Competitive Benchmarking
- 9.4. Competitive Dashboard
- 9.4.1. Industry Leaders
- 9.4.2. Market Differentiators
- 9.4.3. Vanguards
- 9.4.4. Emerging Companies
- 9.5. Market Share/Ranking Analysis, By The Key Players, 2023
10. Company Profiles (Business Overview, Financial Overview, Product Portfolio, Strategic Developments, And Swot Analysis*)
- 10.1. Illumina, Inc. (U.S.)
- 10.2. Thermo Fisher Scientific Inc. (U.S.)
- 10.3. F. Hoffman-La-Roche Ltd (Switzerland)
- 10.4. Pacific Biosciences of California Inc. (U.S.)
- 10.5. QIAGEN N.V. (Netherlands)
- 10.6. Revvity, Inc. (U.S.)
- 10.7. Oxford Nanopore Technlogies PLC (U.K.)
- 10.8. Takara Bio, Inc. (Japan)
- 10.9. Bio-Rad Laboratories, Inc. (U.S.)
- 10.10. Agilent Technologies, Inc. (U.S.)
- 10.11. 10X Genomics, Inc. (U.S.)
- 10.12. Promega Corporation (U.S.)
- 10.13. Cantata Bio, LLC (U.S.)
- 10.14. Zymo Research Corporation (U.S.)
(Note: Swot Analysis* Will Be Provided of The Top 5 Companies)
11. Appendix
- 11.1. Available Customization
- 11.2. Related Reports
