|
|
市場調査レポート
商品コード
1424834
ゲノミクス市場:技術別、用途別、エンドユーザー別、サービス別 - 世界予測(2031年まで)Genomics Market by Technology, Application, End User, Offering - Global Forecast to 2031 |
||||||
|
|||||||
カスタマイズ可能
|
|||||||

| ゲノミクス市場:技術別、用途別、エンドユーザー別、サービス別 - 世界予測(2031年まで) |
|
出版日: 2024年02月12日
発行: Meticulous Research
ページ情報: 英文 320 Pages
納期: 即納可能
|

全表示
- 概要
- 図表
- 目次
世界のゲノミクス市場は、2024年から2031年までのCAGR11.1%で、2031年までに705億2,000万米ドルに達すると予測されます。
広範な2次調査と1次調査、市場シナリオの詳細な分析を経て、当レポートは主要な業界促進要因、抑制要因、課題、機会の分析から構成されています。ゲノミクス市場の成長は、遺伝性疾患の有病率の上昇、臨床ワークフローへのゲノミクスデータの組み込みの増加、ゲノミクスプロジェクトへの資金提供や投資の増加、ヘルスケア分野でのゲノミクスの応用の拡大、医薬品研究開発費の増加、シーケンシングのコスト低下、ヘルスケア支出の増加などが原動力となっています。しかし、ゲノミクスにおける標準化されたアプローチの欠如や、ゲノミクスデータのセキュリティとプライバシーに対する懸念が、この市場の成長を抑制しています。
さらに、個別化医薬品や遺伝子治療の採用が増加していることから、市場の成長機会が生まれると期待されています。しかし、熟練したバイオインフォマティクスとゲノミクスの人材不足、ゲノミクス技術の商業化と拡張は、市場利害関係者にとって大きな課題です。
当レポートでは、4年間(2020年~2024年)における製品ポートフォリオの提供、地域的プレゼンス、業界をリードする市場プレイヤーが採用した主な戦略的発展の広範な評価に基づく競合情勢を提供しています。世界のゲノミクス市場に参入している主要企業は、Agilent Technologies, Inc.(米国)、Bio-Rad Laboratories, Inc.(米国)、Danaher Corporation(米国)、Thermo Fisher Scientific Inc.(米国)、Illumina, Inc.(米国)、QIAGEN N.V.(オランダ)、Pacific Biosciences of California, Inc.(米国)、Oxford Nanopore Technologies Plc.(英国)、Eppendorf SE(ドイツ)、Myriad Genetics, Inc.(米国)、Revvity, Inc.(旧PerkinElmer, Inc.米国)、BGI Genomics Co.Ltd.(中国)です。
本レポートで調査したすべての製品の中で、消耗品セグメントは予測期間中に最も高いCAGRを記録すると予測されています。このセグメントのCAGRが最も高いのは、遺伝性疾患の有病率の増加、遺伝学的検査の採用の増加、機器よりも消耗品の定期的な購入に起因しています。遺伝性疾患の有病率の増加が遺伝学的検査の需要を引き起こし、それが消耗品の採用を促進しています。例えば、MJH Life Sciences(米国)が2022年に発表した報告書によると、世界では年間約30万人の赤ちゃんが鎌状赤血球症で生まれ、世界人口の5%近くが鎌状赤血球症に罹患しています。
本レポートで調査したすべての技術の中で、2024年にはポリメラーゼ連鎖反応(PCR)分野がゲノミクス市場で最大のシェアを占めると予想されます。臨床診断におけるPCRの使用の増加、PCRの技術的進歩、ゲノミクス研究のための共同研究、これらの研究調査におけるPCRの使用は、このセグメントの最大シェアに貢献している要因の一部です。製品の発売がこのセグメントの大きな市場シェアをさらに押し上げています。例えば、2023年3月、Bio-Rad Laboratoriesは、シーケンシング、クローニング、ジェノタイピングなどのPCRアプリケーションを最適化するPTC Tempo 96およびPTC Tempo Deepwellサーマルサイクラーを発売しました。
本レポートで調査したすべてのアプリケーションの中で、2024年には診断分野がゲノミクス市場で最大のシェアを占めると予想されています。腫瘍学、新生児スクリーニング、肝炎検査におけるゲノミクスの利用が、このセグメントの最大シェアに寄与しています。新生児スクリーニングは、既知の遺伝性疾患を特定するために新生児を対象に行われる検査です。政府機関は、早期発見、診断、介入を通じて新生児の遺伝性疾患の発生率を低下させるため、新生児スクリーニングを支援しています。例えば、2022年12月、英国政府は新生児の希少疾患診断を迅速化するために1億1,060万米ドル(1億500万英ポンド)以上を投資しました。このようなイニシアチブは、このセグメントの最大シェアを牽引する上で重要な役割を果たしています。
本レポートで調査したすべてのエンドユーザーの中で、製薬・バイオテクノロジー企業セグメントは予測期間中に最も高いCAGRを記録すると予想されています。このセグメントのCAGRが最も高いのは、製薬&バイオテクノロジー企業による研究開発の増加、調査方法におけるゲノミクスの利用率の上昇、バイオテクノロジー企業の増加によるものです。さらに、慢性疾患の罹患率の増加は、医薬品開発プロセスの迅速化の必要性を加速し、製薬会社におけるゲノミクスの採用をさらに促進しています。
世界のゲノミクス市場の地域別シナリオの詳細分析では、5つの主要地域(北米、欧州、アジア太平洋、ラテンアメリカ、中東・アフリカ)の詳細な質的・量的洞察と、各地域の主要国のカバレッジを提供しています。2024年には、北米がゲノミクス市場で最大のシェアを占めると予想されています。北米には、ゲノミクス研究を専門とする著名な研究機関、大学、組織が多数存在します。この地域は、医薬品研究開発費の増加と主要企業の存在により、がんゲノミクスに大きく貢献しています。例えば、カナダでは製薬企業による創薬のための研究開発費が増加しており、ゲノミクス需要を牽引しています。例えば、2019年の16億米ドルから22億米ドルに対し、2020年のカナダの製薬セクターの研究開発費総額は18億米ドルから24億米ドルと推定されています。このように、研究機関の存在、遺伝性疾患の検査の増加、医薬品R&D支出の増加が最大の地域シェアを支えています。
目次
第1章 イントロダクション
第2章 調査手法
第3章 エグゼクティブサマリー
第4章 市場洞察
- 概要
- 市場成長への影響要因
- 市場力学の影響分析
- 要因分析
- 技術動向
- ゲノミクス市場:規制分析
- 北米
- 欧州
- アジア太平洋
- ラテンアメリカ
- 中東・アフリカ
- 遺伝子治療とゲノミクス編集に関するガイドラインと規制
- 価格分析
- ポーターのファイブフォース分析
第5章 ゲノミクス市場評価:製品別
- 概要
- 消耗品
- 機器
- ソフトウェア
- サービス
第6章 ゲノミクス市場評価:技術別
- 概要
- ポリメラーゼ連鎖反応(PCR)
- シーケンシング
- 次世代シーケンシング(NGS)
- その他のシーケンシング技術
- 核酸抽出と精製
- マイクロアレイ
- その他の技術
第7章 ゲノミクス市場評価:用途別
- 概要
- 診断
- 創薬・医薬品開発
- ライフサイエンス調査
- がん研究
- 幹細胞調査
- その他のライフサイエンス調査
- その他の用途
第8章 ゲノミクス市場評価:エンドユーザー別
- 概要
- 製薬・バイオテクノロジー企業
- 病院・クリニック
- 診断研究所
- CRO(医薬品開発業務受託機関)
- 学術・研究機関
- その他のエンドユーザー
第9章 ゲノミクス市場評価:地域別
- 概要
- 北米
- 米国
- カナダ
- 欧州
- ドイツ
- フランス
- 英国
- イタリア
- スペイン
- その他欧州
- アジア太平洋
- 中国
- 日本
- インド
- その他アジア太平洋
- ラテンアメリカ
- ブラジル
- メキシコ
- その他ラテンアメリカ
- 中東・アフリカ
第10章 競合分析
- イントロダクション
- 主要成長戦略
- 競合ベンチマーキング
- 競合ダッシュボード
- 業界リーダー
- 市場差別化要因
- 先行企業
- 新興企業
- 市場シェア分析
- Thermo Fisher Scientific Inc.(米国)
- Illumina, Inc.(米国)
- Qiagen N.V.(オランダ)
第11章 企業プロファイル(企業概要、財務スナップショット、製品ポートフォリオ、戦略的展開)
- Thermo Fisher Scientific Inc.
- Illumina, Inc
- Qiagen N.V.
- Danaher Corporation
- Agilent Technologies, Inc.
- Bio-Rad Laboratories, Inc.
- Pacific Biosciences of California, Inc.
- Oxford Nanopore Technologies plc
- Eppendorf SE
- Myriad Genetics, Inc.
- Reevity, Inc.(Formerly PerkinElmer, Inc.)
- BGI Genomics Co.,Ltd.
(注:上位5社のSWOT分析を掲載)
第12章 付録
- Table 1 Regulatory Authorities Governing Genomic Products, by Country/Region
- Table 2 Guidelines for Gene Therapy and Genome Editing, by Regulatory Body
- Table 3 Pricing: Genomics Instruments
- Table 4 Pricing: Genomics Consumables
- Table 5 Average Selling Prices: Genomics Instruments
- Table 6 Average Selling Prices: Genomics Consumables
- Table 7 Global Genomics Market, by Offering, 2022-2031 (USD Million)
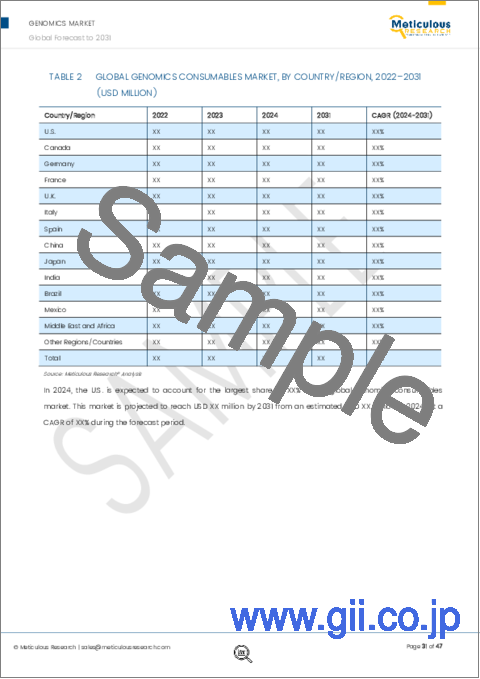
- Table 8 Global Genomics Consumables Market, by Country/Region, 2022-2031 (USD Million)
- Table 9 Global Genomics Instruments Market, by Country/Region, 2022-2031 (USD Million)
- Table 10 Global Genomics Software Market, by Country/Region, 2022-2031 (USD Million)
- Table 11 Global Genomics Services Market, by Country/Region, 2022-2031 (USD Million)
- Table 12 Global Genomics Market, by Technology, 2022-2031 (USD Million)
- Table 13 Global Genomics Market for Polymerase Chain Reaction, by Country/Region, 2022-2031 (USD Million)
- Table 14 Global Genomics Market for Sequencing, by Type, 2022-2031 (USD Million)
- Table 15 Global Genomics Market for Sequencing, by Country/Region, 2022-2031 (USD Million)
- Table 16 Global Genomics Market for Next-Generation Sequencing, by Country/Region, 2022-2031 (USD Million)
- Table 17 Global Genomics Market for Other Sequencing Technologies, by Country/Region, 2022-2031 (USD Million)
- Table 18 Global Genomics Market for Nucleic Acid Extraction and Purification, by Country/Region, 2022-2031 (USD Million)
- Table 19 Global Genomics Market for Microarrays, by Country/Region, 2022-2031 (USD Million)
- Table 20 Global Genomics Market for Other Technologies, by Country/Region, 2022-2031 (USD Million)
- Table 21 Global Genomics Market, by Application, 2022-2031 (USD Million)
- Table 22 Global Genomics Market for Diagnostics, by Country/Region, 2022-2031 (USD Million)
- Table 23 Global Genomics Market for Drug Discovery and Development, by Country/Region, 2022-2031 (USD Million)
- Table 24 Global Genomics Market for Life Sciences Research, by Type, 2022-2031 (USD Million)
- Table 25 Global Genomics Market for Life Sciences Research, by Country/Region, 2022-2031 (USD Million)
- Table 26 Number of New Cancer Cases, by Region, 2020 Vs. 2040 (In Million)
- Table 27 Global Genomics Market for Cancer Research, by Country/Region, 2022-2031 (USD Million)
- Table 28 Global Genomics Market for Stem Cell Research, by Country/Region, 2022-2031 (USD Million)
- Table 29 Global Genomics Market for Other Life Sciences Research, by Country/Region, 2022-2031 (USD Million)
- Table 30 Global Genomics Market for Other Applications, by Country/Region, 2022-2031 (USD Million)
- Table 31 Global Genomics Market, by End User, 2022-2031 (USD Million)
- Table 32 Global Genomics Market for Pharmaceutical & Biotechnology Companies, by Country/Region, 2022-2031 (USD Million)
- Table 33 Global Genomics Market for Hospitals & Clinics, by Country/Region, 2022-2031 (USD Million)
- Table 34 Global Genomics Market for Diagnostic Laboratories, by Country/Region, 2022-2031 (USD Million)
- Table 35 Global Genomics Market for Contract Research Organizations (CROs) by Country/Region, 2022-2031 (USD Million)
- Table 36 Global Genomics Market for Academic & Research Institutes, by Country/Region, 2022-2031 (USD Million)
- Table 37 Global Genomics Market for Other End Users, by Country/Region, 2022-2031 (USD Million)
- Table 38 Global Genomics Market, by Country/Region, 2022-2031 (USD Million)
- Table 39 North America: Genomics Market, by Country, 2022-2031 (USD Million)
- Table 40 North America: Genomics Market, by Offering, 2022-2031 (USD Million)
- Table 41 North America: Genomics Market, by Technology, 2022-2031 (USD Million)
- Table 42 North America: Sequencing Market, by Type, 2022-2031 (USD Million)
- Table 43 North America: Genomics Market, by Application, 2022-2031 (USD Million)
- Table 44 North America: Genomics Market for Life Science Research, by Type, 2022-2031 (USD Million)
- Table 45 North America: Genomics Market, by End User, 2022-2031 (USD Million)
- Table 46 U.S.: Genomics Market, by Offering, 2022-2031 (USD Million)
- Table 47 U.S.: Genomics Market, by Technology, 2022-2031 (USD Million)
- Table 48 U.S.: Sequencing Market, by Type, 2022-2031 (USD Million)
- Table 49 U.S.: Genomics Market, by Application, 2022-2031 (USD Million)
- Table 50 U.S.: Genomics Market for Life Science Research, by Type, 2022-2031 (USD Million)
- Table 51 U.S.: Genomics Market, by End User, 2022-2031 (USD Million)
- Table 52 Canada: Genomics Market, by Offering, 2022-2031 (USD Million)
- Table 53 Canada: Genomics Market, by Technology, 2022-2031 (USD Million)
- Table 54 Canada: Sequencing Market, by Type, 2022-2031 (USD Million)
- Table 55 Canada: Genomics Market, by Application, 2022-2031 (USD Million)
- Table 56 Canada: Genomics Market for Life Science Research, by Type, 2022-2031 (USD Million)
- Table 57 Canada: Genomics Market, by End User, 2022-2031 (USD Million)
- Table 58 Europe: Genomics Market, by Country/Region, 2022-2031 (USD Million)
- Table 59 Europe: Genomics Market, by Offering, 2022-2031 (USD Million)
- Table 60 Europe: Genomics Market, by Technology, 2022-2031 (USD Million)
- Table 61 Europe: Sequencing Market, by Type, 2022-2031 (USD Million)
- Table 62 Europe: Genomics Market, by Application, 2022-2031 (USD Million)
- Table 63 Europe: Genomics Market for Life Science Research, by Type, 2022-2031 (USD Million)
- Table 64 Europe: Genomics Market, by End User, 2022-2031 (USD Million)
- Table 65 Germany: Genomics Market, by Offering, 2022-2031 (USD Million)
- Table 66 Germany: Genomics Market, by Technology, 2022-2031 (USD Million)
- Table 67 Germany: Sequencing Market, by Type, 2022-2031 (USD Million)
- Table 68 Germany: Genomics Market, by Application, 2022-2031 (USD Million)
- Table 69 Germany: Genomics Market for Life Science Research, by Type, 2022-2031 (USD Million)
- Table 70 Germany: Genomics Market, by End User, 2022-2031 (USD Million)
- Table 71 France: Genomics Market, by Offering, 2022-2031 (USD Million)
- Table 72 France: Genomics Market, by Technology, 2022-2031 (USD Million)
- Table 73 France: Sequencing Market, by Type, 2022-2031 (USD Million)
- Table 74 France: Genomics Market, by Application, 2022-2031 (USD Million)
- Table 75 France: Genomics Market for Life Science Research, by Type, 2022-2031 (USD Million)
- Table 76 France: Genomics Market, by End User, 2022-2031 (USD Million)
- Table 77 U.K.: Genomics Market, by Offering, 2022-2031 (USD Million)
- Table 78 U.K.: Genomics Market, by Technology, 2022-2031 (USD Million)
- Table 79 U.K.: Sequencing Market, by Type, 2022-2031 (USD Million)
- Table 80 U.K.: Genomics Market, by Application, 2022-2031 (USD Million)
- Table 81 U.K.: Genomics Market for Life Science Research, by Type, 2022-2031 (USD Million)
- Table 82 U.K.: Genomics Market, by End User, 2022-2031 (USD Million)
- Table 83 Italy: Genomics Market, by Offering, 2022-2031 (USD Million)
- Table 84 Italy: Genomics Market, by Technology, 2022-2031 (USD Million)
- Table 85 Italy: Sequencing Market, by Type, 2022-2031 (USD Million)
- Table 86 Italy: Genomics Market, by Application, 2022-2031 (USD Million)
- Table 87 Italy: Genomics Market for Life Science Research, by Type, 2022-2031 (USD Million)
- Table 88 Italy: Genomics Market, by End User, 2022-2031 (USD Million)
- Table 89 Spain: Genomics Market, by Offering, 2022-2031 (USD Million)
- Table 90 Spain: Genomics Market, by Technology, 2022-2031 (USD Million)
- Table 91 Spain: Sequencing Market, by Type, 2022-2031 (USD Million)
- Table 92 Spain: Genomics Market, by Application, 2022-2031 (USD Million)
- Table 93 Spain: Genomics Market for Life Science Research, by Type, 2022-2031 (USD Million)
- Table 94 Spain: Genomics Market, by End User, 2022-2031 (USD Million)
- Table 95 Rest of Europe: Genomics Market, by Offering, 2022-2031 (USD Million)
- Table 96 Rest of Europe: Genomics Market, by Technology, 2022-2031 (USD Million)
- Table 97 Rest of Europe: Sequencing Market, by Type, 2022-2031 (USD Million)
- Table 98 Rest of Europe: Genomics Market, by Application, 2022-2031 (USD Million)
- Table 99 Rest of Europe: Genomics Market for Life Science Research, by Type, 2022-2031 (USD Million)
- Table 100 Rest of Europe: Genomics Market, by End User, 2022-2031 (USD Million)
- Table 101 Asia-Pacific: Genomics Market, by Country/Region, 2022-2031 (USD Million)
- Table 102 Asia-Pacific: Genomics Market, by Offering, 2022-2031 (USD Million)
- Table 103 Asia-Pacific: Genomics Market, by Technology, 2022-2031 (USD Million)
- Table 104 Asia-Pacific: Sequencing Market, by Type, 2022-2031 (USD Million)
- Table 105 Asia-Pacific: Genomics Market, by Application, 2022-2031 (USD Million)
- Table 106 Asia-Pacific: Genomics Market for Life Science Research, by Type, 2022-2031 (USD Million)
- Table 107 Asia-Pacific: Genomics Market, by End User, 2022-2031 (USD Million)
- Table 108 China: Genomics Market, by Offering, 2022-2031 (USD Million)
- Table 109 China: Genomics Market, by Technology, 2022-2031 (USD Million)
- Table 110 China: Sequencing Market, by Type, 2022-2031 (USD Million)
- Table 111 China: Genomics Market, by Application, 2022-2031 (USD Million)
- Table 112 China: Genomics Market for Life Science Research, by Type, 2022-2031 (USD Million)
- Table 113 China: Genomics Market, by End User, 2022-2031 (USD Million)
- Table 114 Japan: Genomics Market, by Offering, 2022-2031 (USD Million)
- Table 115 Japan: Genomics Market, by Technology, 2022-2031 (USD Million)
- Table 116 Japan: Sequencing Market, by Type, 2022-2031 (USD Million)
- Table 117 Japan: Genomics Market, by Application, 2022-2031 (USD Million)
- Table 118 Japan: Genomics Market for Life Science Research, by Type, 2022-2031 (USD Million)
- Table 119 Japan: Genomics Market, by End User, 2022-2031 (USD Million)
- Table 120 India: Genomics Market, by Offering, 2022-2031 (USD Million)
- Table 121 India: Genomics Market, by Technology, 2022-2031 (USD Million)
- Table 122 India: Sequencing Market, by Type, 2022-2031 (USD Million)
- Table 123 India: Genomics Market, by Application, 2022-2031 (USD Million)
- Table 124 India: Genomics Market for Life Science Research, by Type, 2022-2031 (USD Million)
- Table 125 India: Genomics Market, by End User, 2022-2031 (USD Million)
- Table 126 Rest of Asia-Pacific: Genomics Market, by Offering, 2022-2031 (USD Million)
- Table 127 Rest of Asia-Pacific: Genomics Market, by Technology, 2022-2031 (USD Million)
- Table 128 Rest of Asia-Pacific: Sequencing Market, by Type, 2022-2031 (USD Million)
- Table 129 Rest of Asia-Pacific: Genomics Market, by Application, 2022-2031 (USD Million)
- Table 130 Rest of Asia-Pacific: Genomics Market for Life Science Research, by Type, 2022-2031 (USD Million)
- Table 131 Rest of Asia-Pacific: Genomics Market, by End User, 2022-2031 (USD Million)
- Table 132 Latin America: Genomics Market, by Country/Region, 2022-2031 (USD Million)
- Table 133 Latin America: Genomics Market, by Offering, 2022-2031 (USD Million)
- Table 134 Latin America: Genomics Market, by Technology, 2022-2031 (USD Million)
- Table 135 Latin America: Sequencing Market, by Type, 2022-2031 (USD Million)
- Table 136 Latin America: Genomics Market, by Application, 2022-2031 (USD Million)
- Table 137 Latin America: Genomics Market for Life Science Research, by Type, 2022-2031 (USD Million)
- Table 138 Latin America: Genomics Market, by End User, 2022-2031 (USD Million)
- Table 139 Brazil: Genomics Market, by Offering, 2022-2031 (USD Million)
- Table 140 Brazil: Genomics Market, by Technology, 2022-2031 (USD Million)
- Table 141 Brazil: Sequencing Market, by Type, 2022-2031 (USD Million)
- Table 142 Brazil: Genomics Market, by Application, 2022-2031 (USD Million)
- Table 143 Brazil: Genomics Market for Life Science Research, by Type, 2022-2031 (USD Million)
- Table 144 Brazil: Genomics Market, by End User, 2022-2031 (USD Million)
- Table 145 Mexico: Genomics Market, by Offering, 2022-2031 (USD Million)
- Table 146 Mexico: Genomics Market, by Technology, 2022-2031 (USD Million)
- Table 147 Mexico: Sequencing Market, by Type, 2022-2031 (USD Million)
- Table 148 Mexico: Genomics Market, by Application, 2022-2031 (USD Million)
- Table 149 Mexico: Genomics Market for Life Science Research, by Type, 2022-2031 (USD Million)
- Table 150 Mexico: Genomics Market, by End User, 2022-2031 (USD Million)
- Table 151 Rest of Latin America: Genomics Market, by Offering, 2022-2031 (USD Million)
- Table 152 Rest of Latin America: Genomics Market, by Technology, 2022-2031 (USD Million)
- Table 153 Rest of Latin America: Sequencing Market, by Type, 2022-2031 (USD Million)
- Table 154 Rest of Latin America: Genomics Market, by Application, 2022-2031 (USD Million)
- Table 155 Rest of Latin America: Genomics Market for Life Science Research, by Type, 2022-2031 (USD Million)
- Table 156 Rest of Latin America: Genomics Market, by End User, 2022-2031 (USD Million)
- Table 157 Middle East & Africa: Genomics Market, by Offering, 2022-2031 (USD Million)
- Table 158 Middle East & Africa: Genomics Market, by Technology, 2022-2031 (USD Million)
- Table 159 Middle East & Africa: Sequencing Market, by Type, 2022-2031 (USD Million)
- Table 160 Middle East & Africa: Genomics Market, by Application, 2022-2031 (USD Million)
- Table 161 Middle East & Africa: Genomics Market for Life Science Research, by Type, 2022-2031 (USD Million)
- Table 162 Middle East & Africa: Genomics Market, by End User, 2022-2031 (USD Million)
- Table 163 Recent Developments, by Company, 2020-2024
LIST OF FIGURES
- Figure 1 Research Process
- Figure 2 Secondary Sources Referred for This Study
- Figure 3 Primary Research Techniques
- Figure 4 Key Executives Interviewed
- Figure 5 Breakdown of Primary Interviews (Supply Side & Dem and Side)
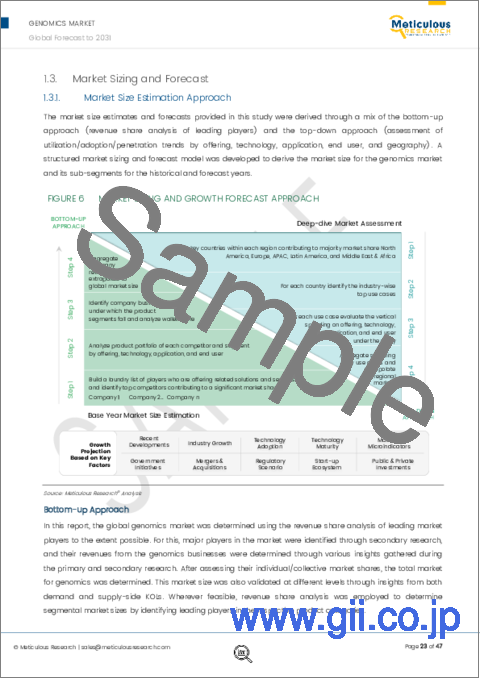
- Figure 6 Market Sizing and Growth Forecast Approach
- Figure 7 Global Genomics Market, by Offering, 2024 Vs. 2031 (USD Million)
- Figure 8 Global Genomics Market, by Technology, 2024 Vs. 2031 (USD Million)
- Figure 9 Global Genomics Market, by Application, 2024 Vs. 2031 (USD Million)
- Figure 10 Global Genomics Market, by End User, 2024 Vs. 2031 (USD Million)
- Figure 11 Genomics Market, by Geography
- Figure 12 Impact Analysis of Market Dynamics
- Figure 13 Healthcare Expenditure as A Percentage of GDP in Major Countries, 2015 Vs. 2020
- Figure 14 Global Pharmaceutical R&D Expenditure, 2012-2022 (USD Billion)
- Figure 15 Estimated Number of New Cancer Cases, by Region, 2020 Vs. 2030 (in Thousand)
- Figure 16 Percentage of FDA Approvals for Personalized Medicine, 2015-2021
- Figure 17 USFDA Regulatory Pathways for Genomic Products
- Figure 18 EU Regulatory Pathway IVDR 2017/746
- Figure 19 China: Medical Device Classification and Pre-Market Requirements for IVD Devices
- Figure 20 Porter's Five Forces Analysis
- Figure 21 Global Genomics Market, by Offering, 2024 Vs. 2031 (USD Million)
- Figure 22 Global Genomics Market, by Technology, 2024 Vs. 2031 (USD Million)
- Figure 23 Global Genomics Market, by Application, 2024 Vs. 2031 (USD Million)
- Figure 24 Global Pharmaceutical R&D Expenditure, 2014-2026 (USD Billion)
- Figure 25 Cancer Incidence Cases, 2020 Vs. 2040
- Figure 26 Global Genomics Market, by End User, 2024 Vs. 2031 (USD Million)
- Figure 27 Global Pharmaceutical R&D Spending, 2012-2026 (USD Billion)
- Figure 28 Global Genomics Market Assessment, by Region, 2024 Vs. 2031 (USD Million)
- Figure 29 North America: Genomics Market Snapshot
- Figure 30 Europe: Genomics Market Snapshot
- Figure 31 Asia-Pacific: Genomics Market Snapshot
- Figure 32 Latin America: Genomics Market Snapshot
- Figure 33 Key Growth Strategies Adopted by Leading Players, 2020-2023
- Figure 34 Genomics Market: Competitive Benchmarking, by Offering
- Figure 35 Genomics Market: Competitive Benchmarking, by Geography
- Figure 36 Competitive Dashboard: Genomics Market
- Figure 37 Global Genomics Market Share Analysis, by Key Players
- Figure 38 Thermo Fisher Scientific, Inc.: Financial Overview (2022)
- Figure 39 Illumina, Inc.: Financial Overview (2022)
- Figure 40 Qiagen N.V.: Financial Overview (2022)
- Figure 41 Danaher Corporation: Financial Overview (2022)
- Figure 42 Agilent Technologies, Inc.: Financial Overview (2023)
- Figure 43 Bio-Rad Laboratories, Inc.: Financial Overview (2022)
- Figure 44 Pacific Biosciences of California, Inc.: Financial Overview (2022)
- Figure 45 Oxford Nanopore Technologies plc.: Financial Overview (2022)
- Figure 46 Eppendorf SE: Financial Overview (2022)
- Figure 47 Myriad Genetics, Inc.: Financial Overview (2022)
- Figure 48 PerkinElmer, Inc.: Financial Overview (2022)
- Figure 49 BGI Genomics Co.,Ltd.: Financial Overview (2022)
Genomics Market by Technology (Sequencing, Microarray, PCR, Nucleic Acid Extraction) Application (Drug Discovery, Diagnostic, Research) End User (Pharmaceutical, Hospital, Academic) Offering (Instrument, Consumable, Software)-Global Forecast to 2031
The global genomics market is projected to reach $70.52 billion by 2031, at a CAGR of 11.1% from 2024 to 2031.
Succeeding extensive secondary and primary research and in-depth analysis of the market scenario, the report comprises the analysis of key industry drivers, restraints, challenges, and opportunities. The growth of the genomics market is driven by the rising prevalence of genetic diseases, the increasing incorporation of genomic data in clinical workflows, increasing funding and investments in genomics projects, the growing applications of genomics in the healthcare sector, rising pharmaceutical R&D expenditures, decreasing cost of sequencing, and increasing healthcare spending. However, the lack of standardized approaches in genomics and concerns over the security & privacy of genomic data restrain the growth of this market.
Moreover, the rising adoption of personalized medicines and gene therapies is expected to generate market growth opportunities. However, the shortage of skilled bioinformatics and genomics personnel and the commercialization and scaling of genomic technologies are major challenges for market stakeholders.
The report offers a competitive landscape based on an extensive assessment of the product portfolio offerings, geographic presences, and key strategic developments adopted by leading market players in the industry over four years (2020-2024). The key players operating in the global genomics market are Agilent Technologies, Inc. (U.S.), Bio-Rad Laboratories, Inc. (U.S.), Danaher Corporation (U.S.), Thermo Fisher Scientific Inc. (U.S.), Illumina, Inc. (U.S.), QIAGEN N.V. (Netherlands), Pacific Biosciences of California, Inc. (U.S.), Oxford Nanopore Technologies Plc. (U.K.), Eppendorf SE (Germany), Myriad Genetics, Inc. (U.S.), Revvity, Inc. (Formerly PerkinElmer, Inc.) (U.S.), and BGI Genomics Co. Ltd (China).
Among all the offerings studied in this report, the consumables segment is projected to register the highest CAGR during the forecast period. The highest CAGR of this segment is attributed to the increasing prevalence of genetic diseases, growing adoption of genetic testing, and recurring purchase of consumables over instruments. An increase in the prevalence of genetic disease cases has triggered the demand for genetic tests, which is driving the adoption of consumables. For instance, according to a report published by MJH Life Sciences (U.S.) in 2022, approximately 300,000 babies are born with sickle cell disease per year globally, and nearly 5% of the world's population is affected by the disease.
Among all the technologies studied in this report, in 2024, the polymerase chain reaction (PCR) segment is expected to account for the largest share of the genomics market. The increasing use of PCR in clinical diagnostics, technological advancements in PCR, collaborations for genomic research, and the use of PCR in these research studies are some of the factors contributing to the segment's largest share. Product launches further boost this segment's large market share. For instance, in March 2023, Bio-Rad Laboratories launched PTC Tempo 96 and PTC Tempo Deepwell Thermal Cyclers to optimize PCR applications such as sequencing, cloning, and genotyping.
Among all the applications studied in this report, in 2024, the diagnostics segment is expected to account for the largest share of the genomics market. The use of genomics in oncology, newborn screening, and hepatitis testing is contributing to the largest share of the segment. Genomics is used in newborn screening, which are laboratory tests performed on newborn babies to identify known genetic diseases. Government agencies support newborn screening to reduce the incidence of genetic disorders among newborns through early detection, diagnosis, and intervention. For instance, in December 2022, the government of the U.K. invested more than USD 110.6 million (GBP 105 million) to speed up the rare disease diagnosis in newborns. Such initiatives play a vital role in driving the segment's largest share.
Among all the end users studied in this report, the pharmaceutical & biotechnology companies' segment is expected to record the highest CAGR during the forecast period. The highest CAGR of the segment is attributed to the increasing research & development by pharmaceutical & biotechnology companies, the rising utilization of genomics for research processes, and an increasing number of biotechnology companies. Moreover, the rising incidence of chronic diseases has accelerated the need to expedite drug development processes, further propelling the adoption of genomics among pharmaceutical companies.
An in-depth analysis of the geographical scenario of the global genomics market provides detailed qualitative and quantitative insights into the five major geographies (North America, Europe, Asia-Pacific, Latin America, and the Middle East & Africa) along with the coverage of major countries in each region. In 2024, North America is expected to account for the largest share of the genomics market. North America is home to numerous renowned research institutions, universities, and organizations dedicated to genomics research; the region has made significant contributions to cancer genomics, with rising pharmaceutical R&D expenditure and the presence of key players. For instance, R&D spending by pharmaceutical companies in Canada for drug discovery has increased, driving the demand for genomics. For instance, in 2020, total R&D expenditure in Canada's pharmaceutical sector was estimated at between USD 1.8 billion and USD 2.4 billion, compared to USD 1.6 billion and USD 2.2 billion in 2019. Thus, the presence of research institutes, rising testing for genetic disorders, and increasing pharmaceutical R&D expenditure is supporting the largest regional share.
Scope of the Report:
Genomics Market Assessment-by Offering
- Systems
- Consumables
- Software
- Services
Genomics Market Assessment-by Technology
- Polymerase Chain Reaction (PCR)
- Sequencing
- NGS
- Other Sequencing Technologies
- Nucleic Acid Extraction and Purification
- Microarray
- Other Technologies
Note: Other sequencing technologies include pyrosequencing, degradome sequencing, sanger sequencing, chromatin immunoprecipitation (ChIP) sequencing, and methylation sequencing.
Note: Other technologies include cell counting, transfection, and gene editing.
Genomics Market Assessment-by Application
- Diagnostics
- Drug Discovery & Development
- Life Sciences Research
- Cancer Research
- Stem Cell Research
- Other Life Sciences Research
- Other Applications
Note: Other life sciences research applications include cardiovascular research, osteoporosis, immunology, neurobiology, cellular and molecular biology, and diabetes
Note: Other applications include agriculture, forensics, and environmental.
Genomics Market Assessment-by End User
- Pharmaceutical & Biotechnology Companies
- Hospitals & Clinics
- Diagnostics Laboratories
- Contract Research Organizations (CROs)
- Academic & Research Institutes
- Other End Users
Note: Other end users include food & beverage companies, agriculture companies, and forensics.
Genomics Market Assessment-by Geography
- North America
- U.S.
- Canada
- Europe
- Germany
- France
- U.K.
- Italy
- Spain
- Rest of Europe
- Asia-Pacific
- China
- Japan
- India
- Rest of Asia-Pacific
- Latin America
- Brazil
- Mexico
- Rest of Latin America
- Middle East & Africa
TABLE OF CONTENTS
1. Introduction
- 1.1. Market Definition & Scope
- 1.2. Market Ecosystem
- 1.3. Currency & Limitations
- 1.4. Key Stakeholders
2. Research Methodology
- 2.1. Research Approach
- 2.2. Process of Data Collection and Validation
- 2.2.1. Secondary Research
- 2.2.2. Primary Research/Interviews with Key Opinion Leaders of the Industry
- 2.3. Market Sizing and Forecast
- 2.3.1. Market Size Estimation Approach
- 2.3.2. Growth Forecast Approach
- 2.3.3. Market Share Analysis
- 2.4. Assumptions for the Study
3. Executive Summary
4. Market Insights
- 4.1. Overview
- 4.2. Factors Affecting Market Growth
- 4.2.1. Impact Analysis of Market Dynamics
- 4.2.1.1. Rising Prevalence of Genetic Diseases and the Incorporation of Genomic Data in Clinical Workflows Driving Market Growth
- 4.2.1.2. Concerns Over the Security & Privacy of Genomic Data Limiting the Adoption of Genomics Products
- 4.2.1.3. Rising Adoption of Personalized Medicines and Gene Therapies
- 4.2.1.4. Commercializing and Scaling Genomic Technologies Remain Major Challenges for Market Stakeholders
- 4.2.2. Factor Analysis
- 4.2.1. Impact Analysis of Market Dynamics
- 4.3. Technology Trends
- 4.4. Genomics Market: Regulatory Analysis
- 4.4.1. North America
- 4.4.1.1. U.S.
- 4.4.1.2. Canada
- 4.4.2. Europe
- 4.4.2.1. Shift From Pre-Approval to A Lifecycle Approach
- 4.4.2.2. Classification Changes
- 4.4.2.3. Stronger Supervision
- 4.4.2.4. Clearer Rights and Responsibilities for Economic Operators
- 4.4.2.5. Traceability/EUDAMED
- 4.4.2.6. General Safety and Performance Requirements
- 4.4.2.7. Performance Evaluation and Clinical Evidence
- 4.4.3. Asia-Pacific
- 4.4.3.1. China
- 4.4.3.2. Japan
- 4.4.3.3. India
- 4.4.4. Latin America
- 4.4.5. Middle East & Africa
- 4.4.6. Guidelines and Regulations for Gene Therapy and Genome Editing
- 4.4.1. North America
- 4.5. Pricing Analysis
- 4.6. Porter's Five Forces Analysis
- 4.6.1. Bargaining Power of Buyers
- 4.6.2. Bargaining Power of Suppliers
- 4.6.3. Threat of Substitutes
- 4.6.4. Threat of New Entrants
- 4.6.5. Degree of Competition
5. Genomics Market Assessment-by Offering
- 5.1. Overview
- 5.2. Consumables
- 5.3. Instruments
- 5.4. Software
- 5.5. Services
6. Genomics Market Assessment-by Technology
- 6.1. Overview
- 6.2. Polymerase Chain Reaction (PCR)
- 6.3. Sequencing
- 6.3.1. Next-Generation Sequencing (NGS)
- 6.3.2. Other Sequencing Technologies
- 6.4. Nucleic Acid Extraction & Purification
- 6.5. Microarray
- 6.6. Other Technologies
7. Genomics Market Assessment-by Application
- 7.1. Overview
- 7.2. Diagnostics
- 7.3. Drug Discovery & Development
- 7.4. Life Sciences Research
- 7.4.1. Cancer Research
- 7.4.2. Stem Cell Research
- 7.4.3. Other Life Sciences Research
- 7.5. Other Applications
8. Genomics Market Assessment-by End User
- 8.1. Overview
- 8.2. Pharmaceutical & Biotechnology Companies
- 8.3. Hospitals & Clinics
- 8.4. Diagnostic Laboratories
- 8.5. Contract Research Organizations (CROs)
- 8.6. Academic & Research Institutes
- 8.7. Other End Users
9. Genomics Market Assessment-by Geography
- 9.1. Overview
- 9.2. North America
- 9.2.1. U.S.
- 9.2.2. Canada
- 9.3. Europe
- 9.3.1. Germany
- 9.3.2. France
- 9.3.3. U.K.
- 9.3.4. Italy
- 9.3.5. Spain
- 9.3.6. Rest Of Europe
- 9.4. Asia-Pacific
- 9.4.1. China
- 9.4.2. Japan
- 9.4.3. India
- 9.4.4. Rest Of Asia-Pacific
- 9.5. Latin America
- 9.5.1. Brazil
- 9.5.2. Mexico
- 9.5.3. Rest of Latin America
- 9.6. Middle East & Africa
10. Competition Analysis
- 10.1. Introduction
- 10.2. Key Growth Strategies
- 10.3. Competitive Benchmarking
- 10.4. Competitive Dashboard
- 10.4.1. Industry Leaders
- 10.4.2. Market Differentiators
- 10.4.3. Vanguards
- 10.4.4. Emerging Companies
- 10.5. Market Share Analysis
- 10.5.1. Thermo Fisher Scientific Inc. (U.S.)
- 10.5.2. Illumina, Inc. (U.S.)
- 10.5.3. Qiagen N.V. (Netherlands)
11. Company Profiles (Company Overview, Financial Snapshot, Product Portfolio, and Strategic Developments)
- 11.1. Thermo Fisher Scientific Inc.
- 11.2. Illumina, Inc
- 11.3. Qiagen N.V.
- 11.4. Danaher Corporation
- 11.5. Agilent Technologies, Inc.
- 11.6. Bio-Rad Laboratories, Inc.
- 11.7. Pacific Biosciences of California, Inc.
- 11.8. Oxford Nanopore Technologies plc
- 11.9. Eppendorf SE
- 11.10. Myriad Genetics, Inc.
- 11.11. Reevity, Inc. (Formerly PerkinElmer, Inc.)
- 11.12. BGI Genomics Co.,Ltd.
(Note: SWOT Analysis of Top 5 Companies is Provided)
12. Appendix
- 12.1. Available Customization
- 12.2. Related Reports

