|
|
市場調査レポート
商品コード
1403331
臨床ラボオートメーション市場:製品別、エンドユーザー別、地域別 - 世界予測(2030年まで)Clinical Lab Automation Market by Product (Liquid Handling, Nucleic Acid Purification System, Microplate Reader, Automated ELISA, Software), End User (Hospital Laboratories, Diagnostic Laboratories) - Global Forecast to 2030 |
||||||

|
|||||||
カスタマイズ可能
|
|||||||

| 臨床ラボオートメーション市場:製品別、エンドユーザー別、地域別 - 世界予測(2030年まで) |
|
出版日: 2024年01月09日
発行: Meticulous Research
ページ情報: 英文 209 Pages
納期: 即納可能
|

全表示
- 概要
- 図表
- 目次
世界の臨床ラボオートメーション市場は、2023年から2030年にかけてCAGR 7.8%で成長し、2030年までに37億2,000万米ドルに達すると予測されています。
包括的な一次および二次調査と市場シナリオの詳細な分析に続き、調査では業界の主要促進要因・抑制要因・課題・機会を提供します。市場は、世界の高齢者人口の増加、感染症の流行増加、臨床ラボラトリー機器の技術の進歩によって牽引されています。
しかし、先進的な臨床ラボオートメーション機器のコストが高いこと、途上国における資金やインフラの制約があることが、この市場の成長を抑制する可能性があります。さらに、機器のメンテナンスや修理費用、患者データのセキュリティやプライバシーに対する懸念は、この市場で事業を展開するプレーヤーにとって大きな課題となります。
製品別では、2023年にはシステムセグメントが臨床ラボオートメーション市場で最大のシェアを占めると予想されています。このセグメントの大きな市場シェアは、医薬品開発への注目が高まっていること、エラーを減らしながら効率と生産性を向上させる自動リキッドハンドリングシステムの利点に起因しています。
エンドユーザー別では、2023年には病院検査室セグメントが臨床ラボオートメーション市場で最大のシェアを占めると予測されています。このセグメントの大きな市場シェアは、医療支出の増加、医療インフラの継続的な改善、高度な技術やテクノロジーの活用などの要因によるものです。
世界の臨床ラボオートメーション市場における地域別シナリオの詳細分析では、5つの主要地域(北米、欧州、アジア太平洋、中東・アフリカ、ラテンアメリカ)の詳細な定性的および定量的洞察を、各地域の主要国のカバレッジとともに提供しています。
2023年には、北米が世界の臨床ラボオートメーション市場で最大のシェアを占め、次いで欧州、アジア太平洋、ラテンアメリカ、中東・アフリカが続くと予想されています。アジア太平洋は、世界の臨床ラボオートメーション市場で最も急成長している地域になると予想されています。
目次
第1章 イントロダクション
第2章 調査手法
第3章 エグゼクティブサマリー
第4章 市場洞察
- 市場
- 概要
- 市場成長への影響要因
- 市場力学の影響分析
- 要因分析
- 規制分析
- 市場概要
- 北米
- 米国
- カナダ
- 欧州
- アジア太平洋
- 中国
- 日本
- インド
- ラテンアメリカ
- 中東
- 価格分析
- 業界動向
- 熟練専門家の不足による自動化システムの使用の増加
- 次世代シーケンシング技術の応用拡大
- ポーターのファイブフォース分析
第5章 臨床ラボオートメーション市場の評価:製品別
- 概要
- システム
- 自動リキッドハンドリングシステム
- 自動ELISAシステム
- 自動核酸精製システム
- 自動マイクロプレートリーダー
- その他
- ソフトウェア
第6章 臨床ラボオートメーション市場の評価:エンドユーザー別
- 概要
- 病院検査室
- 診断検査室
- その他
第7章 臨床ラボオートメーション市場の評価:地域別
- 概要
- 北米
- 米国
- カナダ
- 欧州
- ドイツ
- フランス
- 英国
- イタリア
- スペイン
- その他欧州
- アジア太平洋
- 中国
- 日本
- インド
- その他アジア太平洋地域
- ラテンアメリカ
- 中東・アフリカ
第8章 競合分析
- 概要
- 主要成長戦略
- 競合ベンチマーキング
- 競合ダッシュボード
- 市場シェア分析(2022年)
- Danaher Corporation(U.S.)
- Hamilton Company(U.S.)
- Abbott Laboratories(U.S.)
第9章 企業プロファイル(企業概要、財務概要、製品ポートフォリオ、戦略的展開、SWOT分析)
- Danaher Corporation
- Hamilton Company
- Abbott Laboratories
- F. Hoffmann-La Roche AG
- Thermo Fisher Scientific, Inc.
- Bio-Rad Laboratories, Inc.
- Revvity, Inc.(Formerly Known as PerkinElmer, Inc.)
- Agilent Technologies, Inc.
- Waters Corporation
- Tecan Group Ltd.
- Siemens Healthineers Ag
- Becton, Dickinson, and Company
- Hudson Robotics, Inc.
(注:上位5社のSWOT分析を掲載)
第10章 付録
- Table 1 HIV Prevalence, by Region, 2022
- Table 2 Global: No. of Deaths Due to Cardiovascular Diseases, 1990-2021
- Table 3 Key FDA Regulations for the Clinical Lab Automation Market
- Table 4 Classification of Automated Clinical Laboratory Instruments
- Table 5 Central Drugs Standard Control Organisation (CDSCO) Medical Device Classification
- Table 6 India: Laws Regulating the Life Sciences Industry
- Table 7 Clinical Lab Automation Instruments and Systems: Pricing Details
- Table 8 Automated NGS Workstations: Pricing Details
- Table 9 Global Clinical Lab Automation Market, by Product, 2021-2030 (USD Million)
- Table 10 Global Clinical Lab Automation Systems Market, by Type, 2021-2030 (USD Million)
- Table 11 Global Clinical Lab Automation Systems Market, by Country/Region, 2021-2030 (USD Million)
- Table 12 Global Automated Liquid Handling Systems Market, by Country/Region, 2021-2030 (USD Million)
- Table 13 Type of Automated ELISA Systems
- Table 14 Global Automated ELISA Systems Market, by Country/Region, 2021-2030 (USD Million)
- Table 15 Global Automated Nucleic Acid Purification Systems Market, by Country/Region, 2021-2030 (USD Million)
- Table 16 Recent Advancements in Microplate Reader Technology
- Table 17 Global Automated Microplate Readers Market, by Country/Region, 2021-2030 (USD Million)
- Table 18 Global Other Clinical Lab Automation Systems Market, by Country/Region, 2021-2030 (USD Million)
- Table 19 Global Clinical Lab Automation Software Market, by Country/Region, 2021-2030 (USD Million)
- Table 20 Global Clinical Lab Automation Market, by End User, 2021-2030 (USD Million)
- Table 21 Global Clinical Lab Automation Market for Hospital Laboratories, by Country/Region, 2021-2030 (USD Million)
- Table 22 Global Clinical Lab Automation Market for Diagnostic Laboratories, by Country/Region, 2021-2030 (USD Million)
- Table 23 Global Clinical Lab Automation Market for Other End Users, by Country/Region, 2021-2030 (USD Million)
- Table 24 Global Clinical Lab Automation Market, by Country/Region, 2021-2030 (USD Million)
- Table 25 North America: Clinical Lab Automation Market, by Country, 2021-2030 (USD Million)
- Table 26 North America: Clinical Lab Automation Market, by Product, 2021-2030 (USD Million)
- Table 27 North America: Clinical Lab Automation Systems Market, by Type, 2021-2030 (USD Million)
- Table 28 North America: Clinical Lab Automation Market, by End User, 2021-2030 (USD Million)
- Table 29 U.S.: Key Macro & Micro Indicators
- Table 30 U.S.: Clinical Lab Automation Market, by Product, 2021-2030 (USD Million)
- Table 31 U.S.: Clinical Lab Automation Systems Market, by Type, 2021-2030 (USD Million)
- Table 32 U.S.: Clinical Lab Automation Market, by End User, 2021-2030 (USD Million)
- Table 33 Canada: Key Macro & Micro Indicators
- Table 34 Canada: Clinical Lab Automation Market, by Product, 2021-2030 (USD Million)
- Table 35 Canada: Clinical Lab Automation Systems Market, by Type, 2021-2030 (USD Million)
- Table 36 Canada: Clinical Lab Automation Market, by End User, 2021-2030 (USD Million)
- Table 37 Europe: Clinical Lab Automation Market, by Country/Region, 2021-2030 (USD Million)
- Table 38 Europe: Clinical Lab Automation Market, by Product, 2021-2030 (USD Million)
- Table 39 Europe: Clinical Lab Automation Systems Market, by Type, 2021-2030 (USD Million)
- Table 40 Europe: Clinical Lab Automation Market, by End User, 2021-2030 (USD Million)
- Table 41 Germany: Key Macro & Micro Indicators
- Table 42 Germany: Clinical Lab Automation Market, by Equipment, 2021-2030 (USD Million)
- Table 43 Germany: Clinical Lab Automation Market Systems Market, by Type, 2021-2030 (USD Million)
- Table 44 Germany: Clinical Lab Automation Market, by End User, 2021-2030 (USD Million)
- Table 45 France: Key Macro & Indicators
- Table 46 France: Clinical Lab Automation Market, by Product, 2021-2030 (USD Million)
- Table 47 France: Clinical Lab Automation Systems Market, by Type, 2021-2030 (USD Million)
- Table 48 France: Clinical Lab Automation Market, by End User, 2021-2030 (USD Million)
- Table 49 U.K.: Prevalence of Various Chronic Conditions
- Table 50 U.K.: Key Macro & Micro Indicators
- Table 51 U.K.: Clinical Lab Automation Market, by Product, 2021-2030 (USD Million)
- Table 52 U.K.: Clinical Lab Automation Systems Market, by Type, 2021-2030 (USD Million)
- Table 53 U.K.: Clinical Lab Automation Market, by End User, 2021-2030 (USD Million)
- Table 54 Italy: Key Macro & Micro Indicators
- Table 55 Italy: Clinical Lab Automation Market, by Product, 2021-2030 (USD Million)
- Table 56 Italy: Clinical Lab Automation Systems Market, by Type, 2021-2030 (USD Million)
- Table 57 Italy: Clinical Lab Automation Market, by End User, 2021-2030 (USD Million)
- Table 58 Spain: Key Macro & Micro Indicators
- Table 59 Spain: Clinical Lab Automation Market, by Product, 2021-2030 (USD Million)
- Table 60 Spain: Clinical Lab Automation Systems Market, by Type, 2021-2030 (USD Million)
- Table 61 Spain: Clinical Lab Automation Market, by End User, 2021-2030 (USD Million)
- Table 62 Rest of Europe: Percent of Elderly Population (2012 Vs 2021 Vs 2022)
- Table 63 Rest of Europe: Cancer Statistics (2020 Vs. 2030)
- Table 64 Rest of Europe: Diabetes Statistics (2021 Vs. 2030) (In Thousands)
- Table 65 Rest of Europe: Clinical Lab Automation Market, by Product, 2021-2030 (USD Million)
- Table 66 Rest of Europe: Clinical Lab Automation Systems Market, by Type, 2021-2030 (USD Million)
- Table 67 Rest of Europe: Clinical Lab Automation Market, by End User, 2021-2030 (USD Million)
- Table 68 Asia-Pacific: Clinical Lab Automation Market, by Country, 2021-2030 (USD Million)
- Table 69 Asia-Pacific: Clinical Lab Automation Market, by Product, 2021-2030 (USD Million)
- Table 70 Asia-Pacific: Clinical Lab Automation Systems Market, by Type, 2021-2030 (USD Million)
- Table 71 Asia-Pacific: Clinical Lab Automation Market, by End User, 2021-2030 (USD Million)
- Table 72 China: Key Macro & Micro Indicators
- Table 73 China: Clinical Lab Automation Market, by Product, 2021-2030 (USD Million)
- Table 74 China: Clinical Lab Automation Systems Market, by Type, 2021-2030 (USD Million)
- Table 75 China: Clinical Lab Automation Market, by End User, 2021-2030 (USD Million)
- Table 76 Japan: Key Macro & Micro Indicators
- Table 77 Japan: Clinical Lab Automation Market, by Product, 2021-2030 (USD Million)
- Table 78 Japan: Clinical Lab Automation Systems Market, by Type, 2021-2030 (USD Million)
- Table 79 Japan: Clinical Lab Automation Market, by End User, 2021-2030 (USD Million)
- Table 80 India: Key Macro & Micro Indicators
- Table 81 India: Clinical Lab Automation Market, by Product, 2021-2030 (USD Million)
- Table 82 India: Clinical Lab Automation Systems Market, by Type, 2021-2030 (USD Million)
- Table 83 India: Clinical Lab Automation Market, by End User, 2021-2030 (USD Million)
- Table 84 Estimated Number of New Cancer Cases, by Country, 2020 Vs. 2030
- Table 85 RoAPAC: Number of People with Diabetes (2021 Vs. 2030 Vs.2045) (In Thousands)
- Table 86 Rest of Asia-Pacific: Clinical Lab Automation Market, by Product, 2021-2030 (USD Million)
- Table 87 Rest of Asia-Pacific: Clinical Lab Automation Systems Market, by Type, 2021-2030 (USD Million)
- Table 88 Rest of Asia-Pacific: Clinical Lab Automation Market, by End User, 2021-2030 (USD Million)
- Table 89 Latin America: Clinical Lab Automation Market, by Product, 2021-2030 (USD Million)
- Table 90 Latin America: Clinical Lab Automation Systems Market, by Type, 2021-2030 (USD Million)
- Table 91 Latin America: Clinical Lab Automation Market, by End User, 2021-2030 (USD Million)
- Table 92 Middle East & Africa: Clinical Lab Automation Market, by Product, 2021-2030 (USD Million)
- Table 93 Middle East & Africa: Clinical Lab Automation Systems Market, by Type, 2021-2030 (USD Million)
- Table 94 Middle East & Africa: Clinical Lab Automation Market, by End User, 2021-2030 (USD Million)
- Table 95 Recent Developments, by Company, 2020-2023
LIST OF FIGURES
- Figure 1 Research Process
- Figure 2 Secondary Sources Referenced for This Study
- Figure 3 Primary Research Techniques
- Figure 4 Key Executives Interviewed
- Figure 5 Breakdown of Primary Interviews (Supply-Side & Demand-Side)
- Figure 6 Market Sizing and Growth Forecast Approach
- Figure 7 Global Clinical Lab Automation Market, by Product, 2023 Vs. 2030 (USD Million)
- Figure 8 Global Clinical Lab Automation Market, by End User, 2023 Vs. 2030 (USD Million)
- Figure 9 Clinical Lab Automation Market Size, by Geography
- Figure 10 Global Clinical Lab Automation Market: Impact Analysis of Market Drivers, Restraints, Opportunities, and Challenges (2023-2030)
- Figure 11 Population Aged 65 Years or Over, by Region, 2020 Vs. 2030 (In Million)
- Figure 12 Global: Estimated Number of New Cancer Cases, 2020-2040 (In Million)
- Figure 13 Global Prevalence of Diabetes, 2000-2045 (In Million)
- Figure 14 Global: Total Number of Accredited Testing Laboratories, 2016-2020
- Figure 15 Incidence of Tuberculosis, by Region, 2021 (In Million)
- Figure 16 EU Regulatory Pathway - IVDR 2017/746
- Figure 17 China: Medical Devices Classification and Pre-Market Requirements for IVD Devices
- Figure 18 Porter's Five Forces Analysis
- Figure 19 Global Clinical Lab Automation Market, by Product, 2023 Vs 2030 (USD Million)
- Figure 20 Advantages of Using Automated ELISA Systems
- Figure 21 Global Clinical Lab Automation Market, by End User, 2023 Vs. 2030 (USD Million)
- Figure 22 Global Clinical Lab Automation Market, by Country/Region, 2023 Vs. 2030 (USD Million)
- Figure 23 North America: Clinical Lab Automation Market Snapshot
- Figure 24 Geriatric Population in Canada (2019-2050)
- Figure 25 Estimated Number of New Cancer Cases (2020-2040)
- Figure 26 Europe: Clinical Lab Automation Market Snapshot
- Figure 27 U.K.: Number of New Sexually Transmitted Infections Diagnosed Per 100,000 Population, 2017-2021
- Figure 28 Italy: Percentage of The Population Aged 65 & Above, 2010-2021
- Figure 29 Spain: Number of People Living with HIV (2010-2021)
- Figure 30 Asia-Pacific: Clinical Lab Automation Market Snapshot
- Figure 31 China: Number of New Cancer Cases (2020-2040) (In Million)
- Figure 32 Japan: Share of Geriatric Population in Total Population (65 and Over)
- Figure 33 Brazil: Number of People with Diabetes (In Thousands)
- Figure 34 Key Growth Strategies Adopted by Leading Players 2020-2023
- Figure 35 Clinical Lab Automation Market: Competitive Benchmarking by Product Type
- Figure 36 Clinical Lab Automation Market: Competitive Benchmarking, by Region
- Figure 37 Competitive Dashboard: Clinical Lab Automation Market
- Figure 38 Global Clinical Lab Automation Market Share Analysis, by Key Players (2022)
- Figure 39 Danaher Corporation: Financial Overview (2022)
- Figure 40 Abbott Laboratories: Financial Overview (2022)
- Figure 41 F. Hoffmann-La Roche AG: Financial Overview (2022)
- Figure 42 Thermo Fisher Scientific, Inc.: Financial Overview (2022)
- Figure 43 Bio-Rad Laboratories, Inc.: Financial Overview (2022)
- Figure 44 PerkinElmer, Inc.: Financial Overview (2022)
- Figure 45 Agilent Technologies, Inc.: Financial Overview (2022)
- Figure 46 Waters Corporation: Financial Overview (2022)
- Figure 47 Tecan Group Ltd.: Financial Overview (2022)
- Figure 48 Siemens Healthineers Ag: Financial Overview (2022)
- Figure 49 Becton, Dickinson, and Company: Financial Overview (2022)
The global clinical lab automation market is projected to reach $3.72 billion by 2030, at a CAGR of 7.8% from 2023 to 2030.
Following a comprehensive primary and secondary study and an in-depth analysis of the market scenario, this report provides the key drivers, constraints, challenges, and opportunities of the industry. This market is driven by the rising global geriatric population, increasing prevalence of infectious diseases, and technological advancements in clinical laboratory instruments. Furthermore, increasing demand for automated instruments due to technological advancements, efficiency, and accuracy; technological advancements in molecular diagnostics; and emerging economies provide significant growth opportunities for this market.
However, the high costs of advanced clinical lab automation equipment and funding and infrastructure limitations in developing countries may restrain the growth of this market. Additionally, equipment maintenance and repair costs and concerns over the security and privacy of patient data pose a major challenge for the players operating in this market.
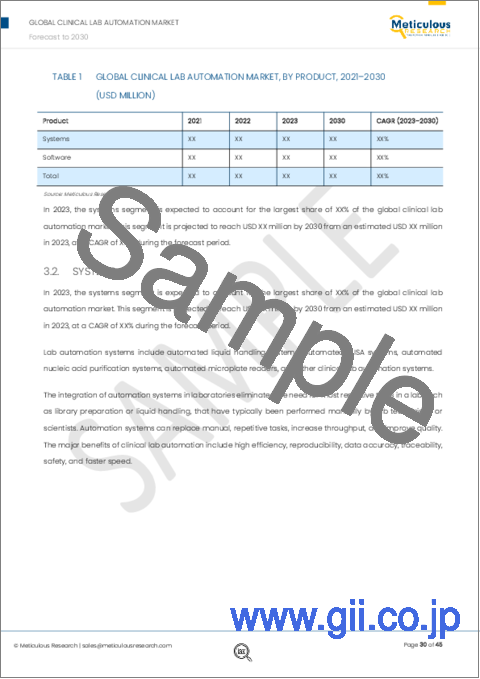
Among products, in 2023, the systems segment is expected to account for the largest share of the clinical lab automation market. The large market share of this segment is attributed to the increased focus on drug development, and the advantages of automated liquid handling systems to increase efficiency and productivity while reducing errors.
Among end users, in 2023, the hospital laboratories segment is expected to account for the largest share of the clinical lab automation market. The large market share of this segment is attributed to factors such as rising healthcare expenditures, continuous improvements in healthcare infrastructure, and the utilization of advanced techniques and technologies.
An in-depth analysis of the geographical scenario of the global clinical lab automation market provides detailed qualitative and quantitative insights for the five major geographies (North America, Europe, Asia-Pacific, the Middle East & Africa, and Latin America) along with the coverage of major countries in each region.
In 2023, North America is expected to account for the largest share of the global clinical lab automation market, followed by Europe, Asia-Pacific, Latin America, and the Middle East & Africa. Asia-Pacific is expected to be the fastest-growing region of the global clinical lab automation market.
The key players operating in the global clinical lab automation market are Thermo Fisher Scientific, Inc. (U.S.), Bio-Rad Laboratories, Inc. (U.S.), Danaher Corporation (U.S.), Revvity, Inc. (Formerly known as PerkinElmer, Inc.) (U.S.), F. Hoffmann-La Roche AG (Switzerland), Agilent Technologies, Inc. (U.S.), Waters Corporation (U.S.), Tecan Group Ltd. (Switzerland), Siemens Healthineers AG (Germany), Becton, Dickinson, and Company (U.S.), Abbott Laboratories (U.S.), Hudson Robotics, Inc. (U.S.), and Hamilton Company (U.S.).
Scope of the Report:
Clinical Lab Automation Market Assessment-by Product
- Systems
- Automated Liquid Handling Systems
- Automated ELISA Systems
- Automated Nucleic Acid Purification Systems
- Automated Microplate Readers
- Other Systems
- Clinical Lab Automation Software
Note: Other systems include automated incubators, automated cell counters, and cell imaging systems.
Clinical Lab Automation Market Assessment-by End User
- Hospital Laboratories
- Diagnostic Laboratories
- Other End Users
Note: Other end users include blood banks, forensic labs, and clinical research organizations
Clinical Lab Automation Market Assessment-by Geography
- North America
- U.S.
- Canada
- Europe
- Germany
- U.K.
- France
- Italy
- Spain
- Rest of Europe (RoE)
- Asia-Pacific (APAC)
- China
- Japan
- India
- Rest of APAC (RoAPAC)
- Latin America
- Middle East & Africa
TABLE OF CONTENTS
1. Introduction
- 1.1. Market Definition & Scope
- 1.2. Market Ecosystem
- 1.3. Currency & Limitations
- 1.4. Key Stakeholders
2. Research Methodology
- 2.1. Research Approach
- 2.2. Process of Data Collection and Validation
- 2.2.1. Secondary Research
- 2.2.2. Primary Research/Interviews with Key Opinion Leaders from the Industry
- 2.3. Market Sizing and Forecasting
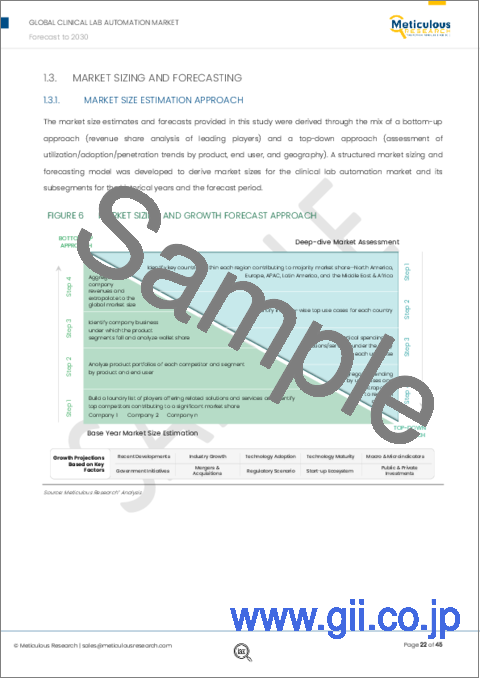
- 2.3.1. Market Size Estimation Approach
- 2.3.2. Growth Forecast Approach
- 2.3.3. Market Share Analysis
- 2.4. Assumptions for the Study
3. Executive Summary
4. Market Insights
- 4.1. Overview
- 4.2. Factors Affecting Market Growth
- 4.2.1. Impact Analysis of Market Dynamics
- 4.2.2. Factor Analysis
- 4.3. Regulatory Analysis
- 4.3.1. Overview
- 4.3.2. North America
- 4.3.2.1. U.S.
- 4.3.2.2. Canada
- 4.3.3. Europe
- 4.3.4. Asia-Pacific
- 4.3.4.1. China
- 4.3.4.2. Japan
- 4.3.4.3. India
- 4.3.5. Latin America
- 4.3.6. Middle East
- 4.4. Pricing Analysis
- 4.5. Industry Trends
- 4.5.1. Shortage of Skilled Professionals Leading to the Increased Use of Automated Systems
- 4.5.2. Increasing Applications of Next-Generation Sequencing Technology
- 4.6. Porter's Five Forces Analysis
- 4.6.1. Bargaining Power of Buyers
- 4.6.2. Bargaining Power of Suppliers
- 4.6.3. Threat of Substitutes
- 4.6.4. Threat of New Entrants
- 4.6.5. Degree of Competition
5. Clinical Lab Automation Market Assessment-by Product
- 5.1. Overview
- 5.2. Systems
- 5.2.1. Automated Liquid Handling Systems
- 5.2.2. Automated ELISA Systems
- 5.2.3. Automated Nucleic Acid Purification Systems
- 5.2.4. Automated Microplate Readers
- 5.2.5. Other Systems
- 5.3. Clinical Lab Automation Software
6. Clinical Lab Automation Market Assessment-by End User
- 6.1. Overview
- 6.2. Hospital Laboratories
- 6.3. Diagnostic Laboratories
- 6.4. Other End Users
7. Clinical Lab Automation Market Assessment-by Geography
- 7.1. Overview
- 7.2. North America
- 7.2.1. U.S.
- 7.2.2. Canada
- 7.3. Europe
- 7.3.1. Germany
- 7.3.2. France
- 7.3.3. U.K.
- 7.3.4. Italy
- 7.3.5. Spain
- 7.3.6. Rest of Europe
- 7.4. Asia-Pacific
- 7.4.1. China
- 7.4.2. Japan
- 7.4.3. India
- 7.4.4. Rest of Asia-Pacific
- 7.5. Latin America
- 7.6. Middle East & Africa
8. Competition Analysis
- 8.1. Overview
- 8.2. Key Growth Strategies
- 8.3. Competitive Benchmarking
- 8.4. Competitive Dashboard
- 8.4.1. Industry Leaders
- 8.4.2. Market Differentiators
- 8.4.3. Vanguards
- 8.4.4. Emerging Companies
- 8.5. Market Share Analysis (2022)
- 8.5.1. Danaher Corporation (U.S.)
- 8.5.2. Hamilton Company (U.S.)
- 8.5.3. Abbott Laboratories (U.S.)
9. Company Profiles (Company Overview, Financial Overview, Product Portfolio, Strategic Developments, SWOT Analysis)
- 9.1. Danaher Corporation
- 9.2. Hamilton Company
- 9.3. Abbott Laboratories
- 9.4. F. Hoffmann-La Roche AG
- 9.5. Thermo Fisher Scientific, Inc.
- 9.6. Bio-Rad Laboratories, Inc.
- 9.7. Revvity, Inc. (Formerly Known as PerkinElmer, Inc.)
- 9.8. Agilent Technologies, Inc.
- 9.9. Waters Corporation
- 9.10. Tecan Group Ltd.
- 9.11. Siemens Healthineers Ag
- 9.12. Becton, Dickinson, and Company
- 9.13. Hudson Robotics, Inc.
(Note: SWOT Analysis of Top 5 Companies is Provided)
10. Appendix
- 10.1. Available Customization
- 10.2. Related Reports

